Mastering Multiple Timeframe Analysis Forex trading can be a challenging and complex activity. As a result, many traders struggle to find a strategy that works for them and often lose money. One important aspect of successful forex trading is multiple timeframe analysis. This post will discuss how to perform multiple timeframe analyses in the forex market and how it can help if you're struggling with the concept.
What is Multiple Timeframe Analysis?
Multiple timeframe analysis is the process of analyzing the same currency pair across different timeframes. By looking at different timeframes, you can better understand the market trends and make more informed trading decisions.
For example, if you are trading the EUR/USD currency pair, you might look at the daily chart to get an overview of the long-term trend. You might then look at the hourly chart to identify short-term trends or potential trading opportunities.
Why is Multiple Timeframe Analysis Important?
Multiple timeframe analysis is important for several reasons. Firstly, it allows traders to understand the market trend better. By looking at different timeframes, traders can see if the currency pair is in an uptrend, downtrend, or range.
Secondly, multiple timeframe analysis allows traders to identify potential trading opportunities. By analyzing different timeframes, traders can identify key support and resistance levels, trendlines, and chart patterns that may indicate a potential trade.
Finally, multiple timeframe analysis can help traders to manage their risk. By looking at different timeframes, traders can minimize risk based on opportunities to place tighter stop losses and bigger target profit areas.
How to Perform Multiple Timeframe Analysis
Performing multiple timeframe analysis is not difficult, but it requires some practice and patience. Here are the steps you should follow:
Identify the Currency Pair to Trade
The first step is identifying the currency pair you want to trade. This could be any major currency pair, such as EUR/USD, GBP/USD, or USD/JPY.
2. Select the Timeframes to Analyze
Next, you need to select the timeframes that you want to analyze. A good rule of thumb is to use three different timeframes: a long-term timeframe (daily or weekly), a medium-term timeframe (12 hours or 4 hours), and a short-term timeframe (15 minutes or 5 minutes).
3. Analyze the Long-Term Timeframe
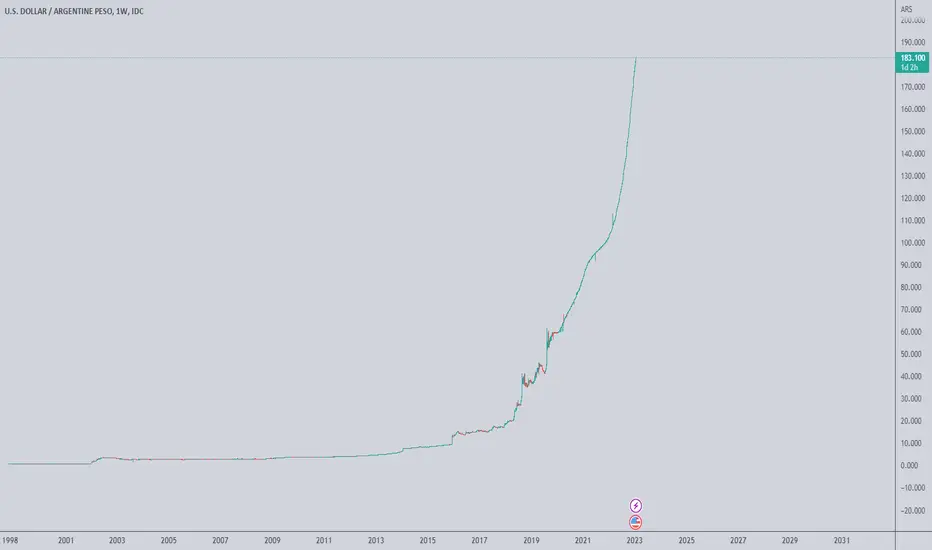
The long-term timeframe is the most important, providing an overview of the market trend. If you're a technical analyst, look for major support or resistance levels, trendlines, or chart patterns indicating a potential trading opportunity.
F.Y.I. My trading is not based on Technical analysis in a conventional manner. I pay more attention to price in the form of price action candlesticks. This makes it easier to separate the timeframes and direction of price when I move up and down in timeframes.
4. Analyze the Medium-Term Timeframe
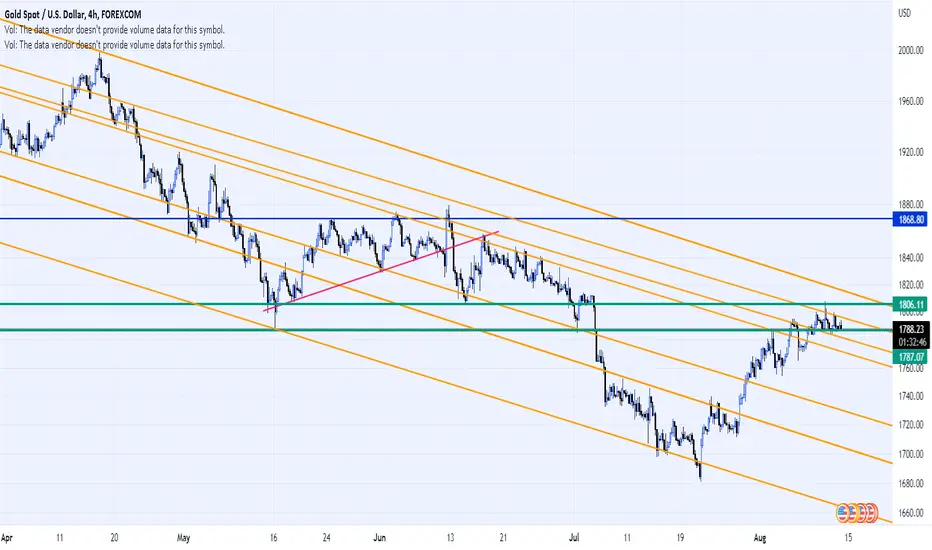
The medium-term timeframe is used to identify any short-term trends that may be developing. Look for any key support and resistance levels, trendlines, or chart patterns that might indicate a potential trading opportunity.
In this example, because GBPUSD is still in an uptrend, it's important to perform a top-down analysis that supports the different trend cycles on lower timeframes to remind yourself what the overall trend is, where the price is now, and where it's going next.
I love the medium timeframes, such as the 12-hour and 4-hour, to analyze where the price is now and get more detail from the charts.
5. Analyze the Short-Term Timeframe
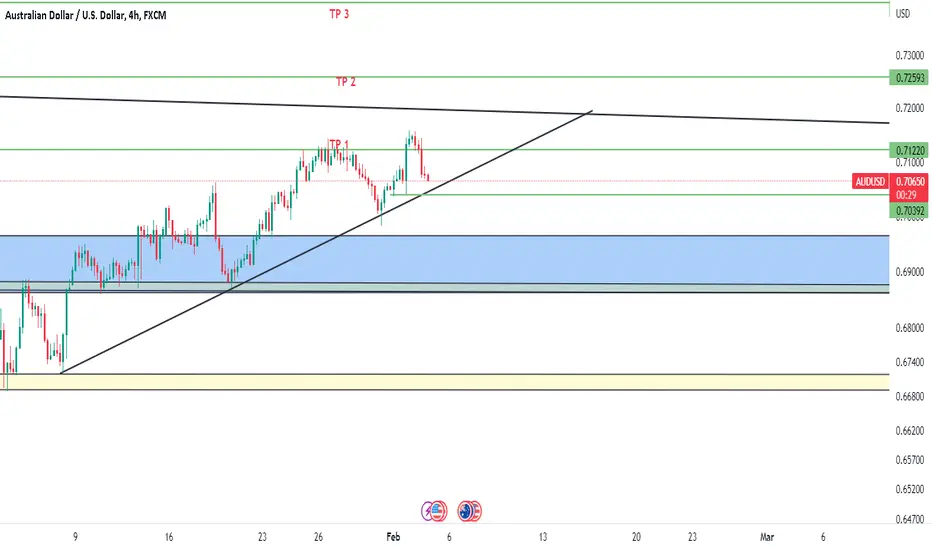
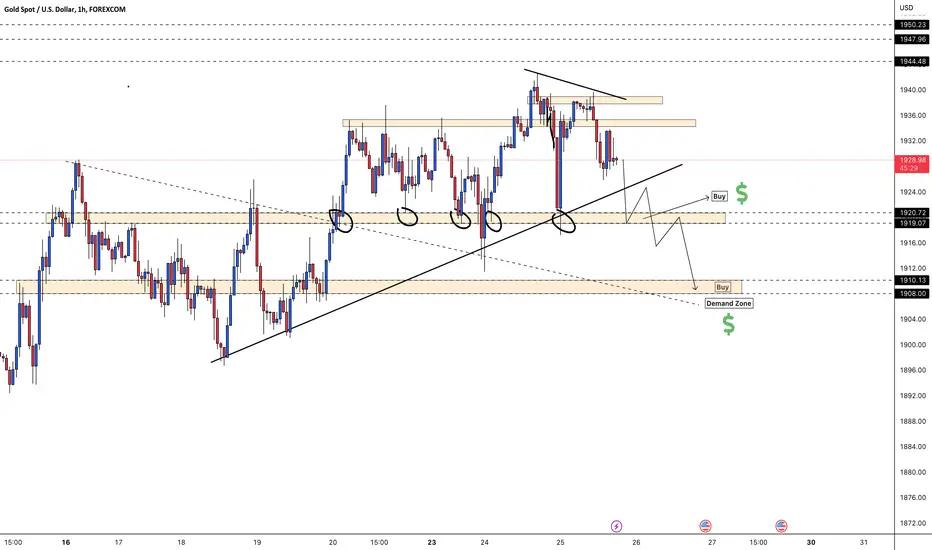
The short-term timeframe is used to identify any potential entry and exit points for a trade. In addition, look for any key support and resistance levels, trend lines, or chart patterns that might indicate a potential trading opportunity.
6. Put it all Together
Once you have analyzed all three timeframes, you should understand the market trend and potential trading opportunities. Use this information to make informed trading decisions, and always remember to manage your risk.
In conclusion, multiple timeframe analysis is an important aspect of successful forex trading.
By analyzing different timeframes, traders can better understand market trends, identify potential trading opportunities, and manage risk. If you are a struggling trader, consider using multiple timeframe analysis in your trading strategy.
If you enjoyed this post and valued the tips, comment to this post to let me know your takeaway. If you're struggling with top-down analysis and have a question, reply with your question, and let's chat a bit.
Your trading coach,
Shaquan
Trend-trading

AUDUSD BULLISH Hey traders, in today's trading session i'm are monitoring AUDUSD for a buying opportunity around 0.70449 zone, once I will receive any bullish confirmation the trade will be executed.
JINDALSTEL FUTURE SHORT SELLJINDALSTEL is weak on chart, trading below 20EMA on daily chart. all major indicators are showing weakness in the stock. Our recommendation is to Short Sell JINDALSTEL future with strict stop loss above 606 for targets 581/564/551.

User Request: How to Set Pull Back Alert on Bull Bear Power VoidOne of the users following me asked a really good question.
Thanks @Manu45e for this one. Its actually a really important thing to know about.
This will help you understand when a pullback is over and its time for a continuation trade.
1. Wait for HTF Volume to cross down below the ZERO level
2. Wait for Volume to turn BLUE while still below ZERO
3. Wait for Blue Volume to cross ABOVE the zero level
4. You need to already have current volume above the Bullish side of the VOID
Continuation trade confirmed.
For this you are going to need one indicator.
The Bull Bear Power Void
Make sure to click the image below and also click the BOOST button on that page to make it popular.
Here's the indicator

XAUUSD gold may drop as predict in the picture, as its hard to predict after the short pull back gold will keep rising again..
lrt me know your thought.
not financlly advise .
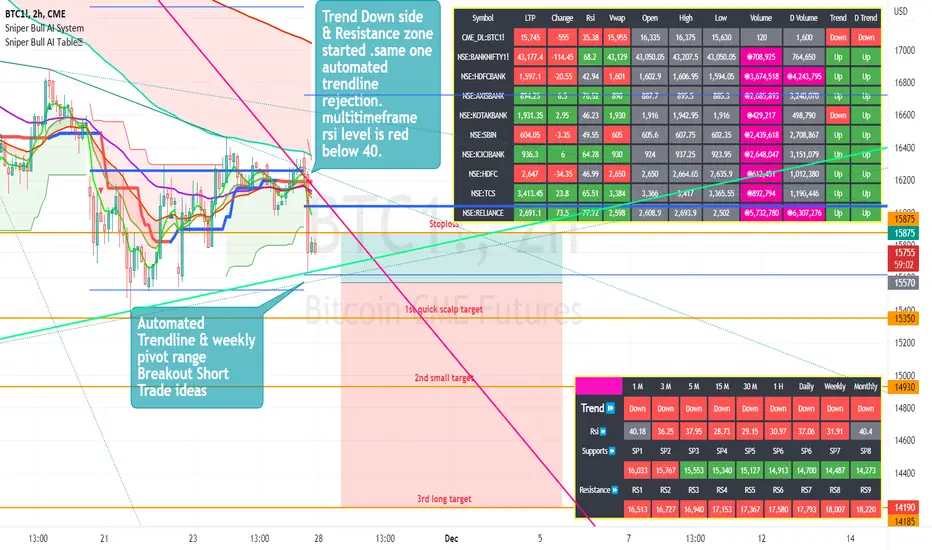
BTC: what does he allow himself?Good evening, colleagues!
Overview of BTC.
The trend is globally downward. Now the price is in a corrective movement.
My opinion, after today's local growth, the price will continue to move up.
Targets for growth 17 200$, 18 200$ and possibly 19 500$!
Reasons for growth: liquidity overlap, last week's high update and weekly FVG zone test!
Good luck everyone and have a great evening!
Back to Basics - Trend and trendlinesThe first thing to do when looking at any chart is to identify the trend. What we need mean by trend? We simply mean what direction is a market moving in? Luckily there’s only three ways a market can move - it can move up; it can move down or it can move sideways.
How do we identify the trend? The definition of an up move is for higher reaction highs and higher reaction lows. The definition of down move is for lower reaction highs and lower reaction lows. The definition of a sideways trend is when the highs and lows are about the same level.
Once we’ve identified the trend. It’s helpful to place on a trend line, now In a down move really you want to be connecting the highs and for a valid trendline you need to connect at least three highs.
Why do we like to do this? because trendlines help to enforce discipline and not only that but they offer potential entry points. They also help you with timing and they can give you a good place to put your stops.
It is worth noting that the longer a trendline the more important it becomes. So a 3-month trend line is more important than a 3-week trend line.

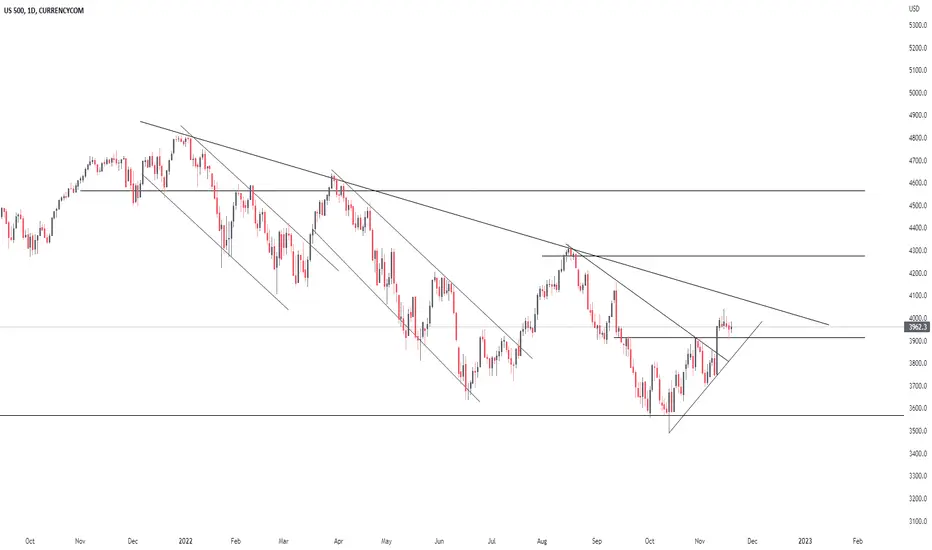
SPX 500 LOOKS BULLISH MAKET LOOKS PURE BULL 4200 IS MONTHLY TARGET
options price will move more volatile
EURUSD INTRAWEEK OUTLOOKWe can see eu is in uptrend. We can look to buy off demand zones.
On Weekly profile we can see value area that is adding confluence to the bottom demand area.

EURGBP: Buy the pullback at previous tops and PivotEURGBP: The pullback at previous tops and the daily pivot gives BUY signal. We will buy at 0.8790, setting the stops below 0.8760, targeting 0.8820.

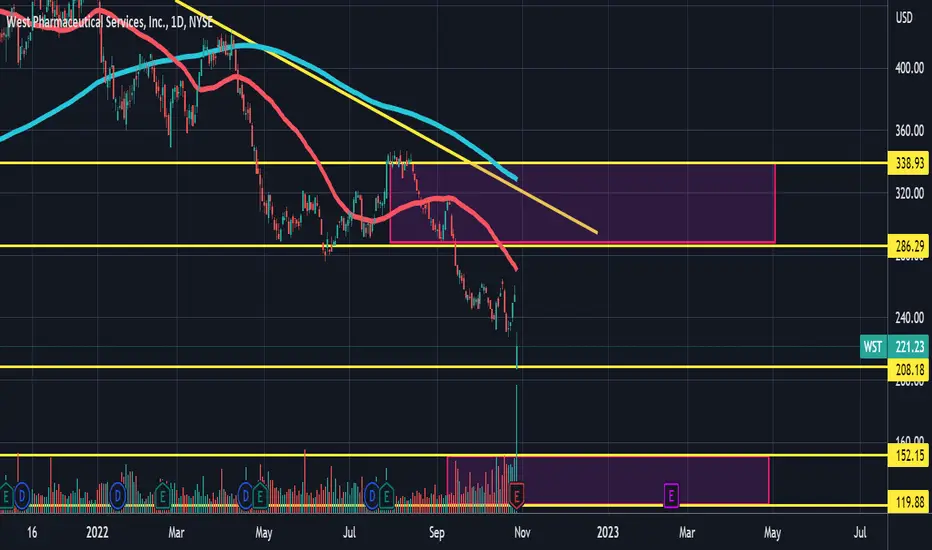
Armónico Bear TrendInteresting stock, Armonic trend, the stock is in obviously bear Market, and it seems will continue in this way. The earnings were below the expectation. The price is continuing its downtrend and the price is using the moving average of the 50 periods as resistance that push down the price. Let's in the coming weeks if the trend will reach the area of attention between levels 152.15 and 119.88.
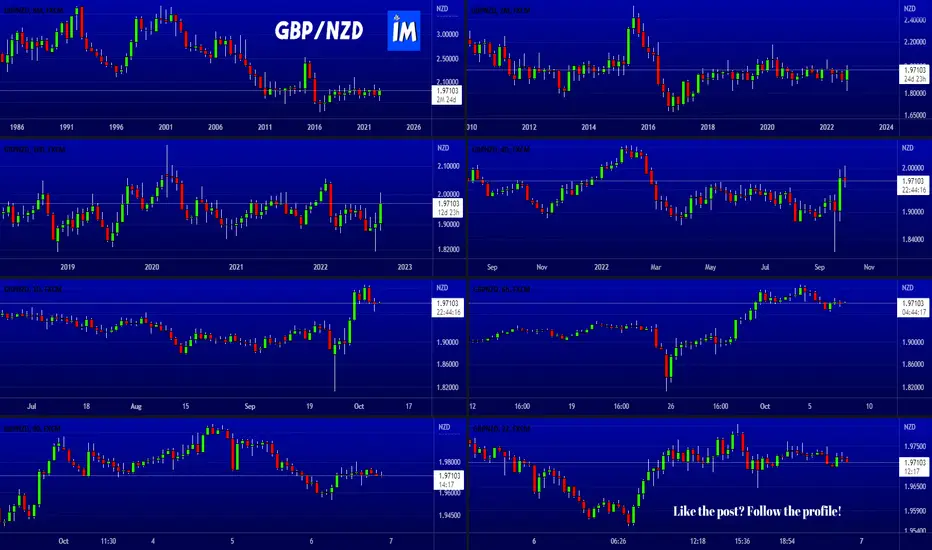
💱GBP/NZD Time to shine MULTI-INTERVAL ANALYSIS💱💱 In the current comprehensive analysis, I would like to draw your attention to the GBP/NZD pair which has caught my attention in recent days.
💱 In the posted post, we can observe eight charts showing the time range from 8 months to 22 minutes (it has been divided from 8 months into four i.e. each subsequent chart-timeframe is four times smaller.
💱 Looking strikte at the price action and the appearance of the candles, it is impossible to deny that since 2016 we have been in accumulation on this pair and the last days have given us many reasons to think that this period may soon end.
💱 Well, in recent weeks we have seen a massive injection of money that flows into the pound and outflows from the New Zealand dollar.
💱 I am very curious to see if the recent breakout that has been taking place since September 26 could be the beginning of a long-term upward wave.
💱 It is worth keeping an eye on this pair.
💱 If you liked the analysis leave a like and drop by the profile for more interesting posts :D
interesting situation at 24.49The interesting situation at 24.49, the price is using this level as a support, and it seems compressed between level 26.81 and 22.12, if the price will broke above Area 1 we will have a good chance to see a little uptrend before a second drop. Let's see, my vision is still short.
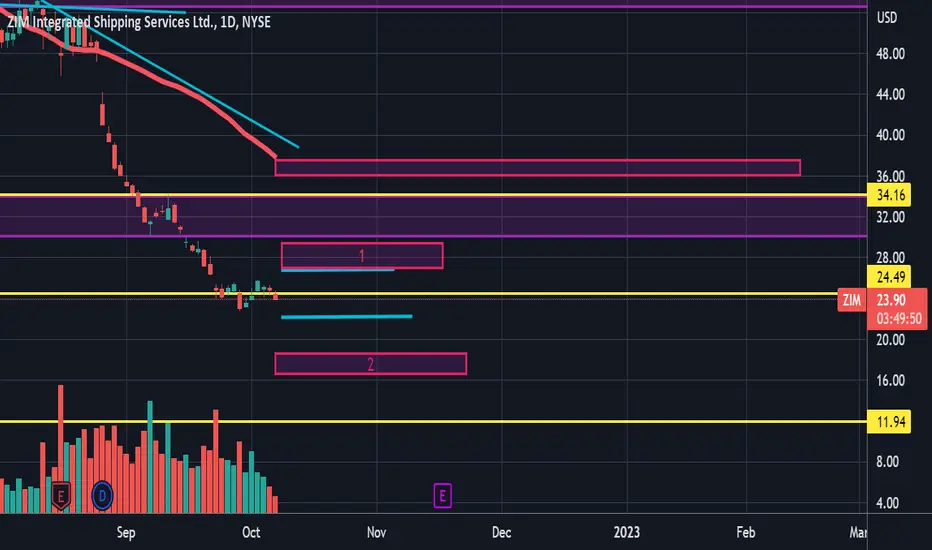
Short closed in interesting area Another position opened and closed in profit, and the price rich a level and an interesting area between the level price of 8.70 and 8.01 let's see if the stock will use this area to accumulate before the broken, continuing the downtrend or will use as a support to start a new up trend.
My vision is still short, let's see.

Still Bearish and waiting for rejection at 20,470 and 21,016
NOT A FINANCIAL ADVICE. PLEASE DO YOUR OWN RESEARCH.
Looking at the daily BTC/USDT Chart, bitcoin is currently following a descending channel pattern. I am still bearish with bitcoin and I am waiting for the price action at $ 20,470 and $21,016. These figures are the 50% and 61.8% fibonacci retracements respectively from previous swing low. If price fails to break these levels, I will definitely continue shorting.

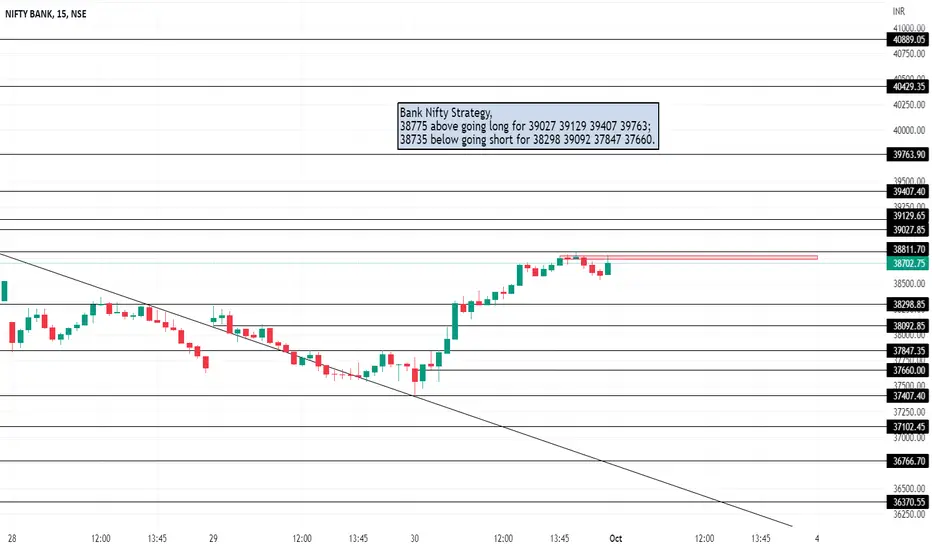
Bank Nifty Strategy for 3 Oct 2022,Bank Nifty Strategy for 3 Oct 2022,
38775 above going long for 39027 39129 39407 39763;
38735 below going short for 38298 39092 37847 37660.
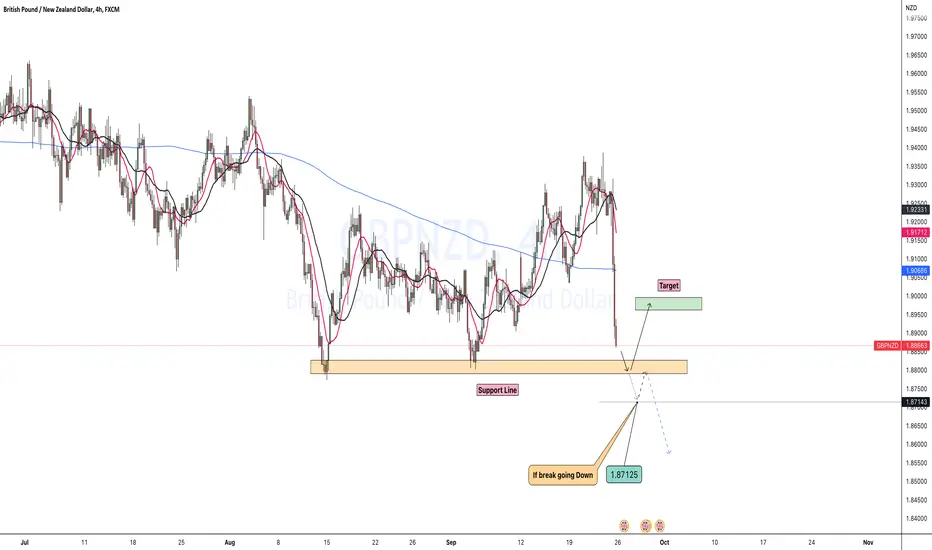
GBPNZDalmost near horizontail line..and here we can take risk to buy on bullish based. i think it rebound from here and make bullish move and can hold for long. what you al think feel free to drop your thoughts in the comment below.
usdjpyusdjpy this pair is rising like real tsunami 25 years a go japan was on this price. as i have marked 1991-1998 price fall from there 2wice will price will fall again from this price..? i am on sell next weak what you guys up to let me know.
i saw a big pull back bearish in side candle on H4 chart waiting for to retest and do the action.

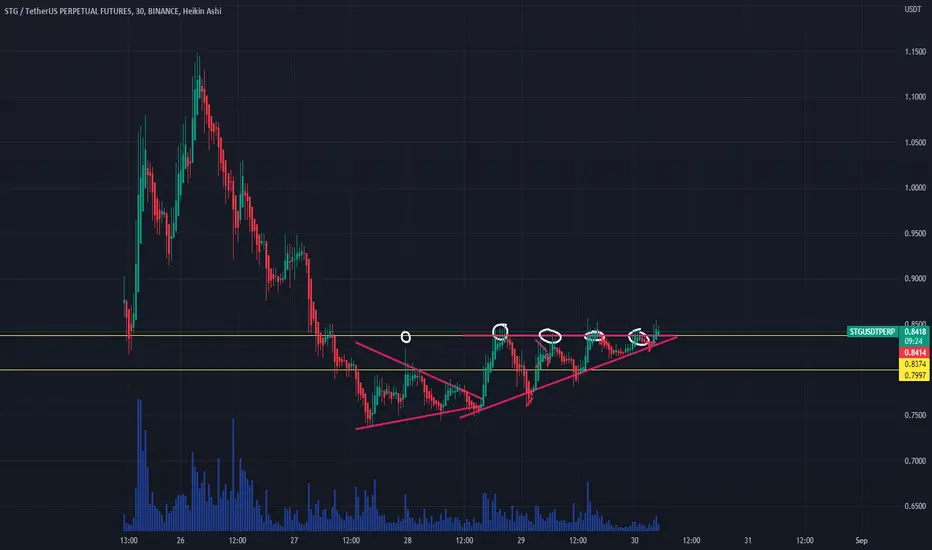
STG breaking out ?Multiple touchpoints to the supply zone, we don't really have too much history on this one to really expect this to be a mayor resistance zone.
My analysis of SOLUSDTHello, this crypto can most likely turn the short-term downward trend into an upward trend after the first placement and gathering of orders.

gold in 4 hhi friends, this is my idea of gold in 4H timeframe .. its the same chart on daily timefram that i published yesterday ..
this is just my oponion and not type of financial advice