BTC/USDT THE WAY TO 122KBTC/USDT THE WAY TO 122K
There is high chance we will see building trend for BTC
Trend

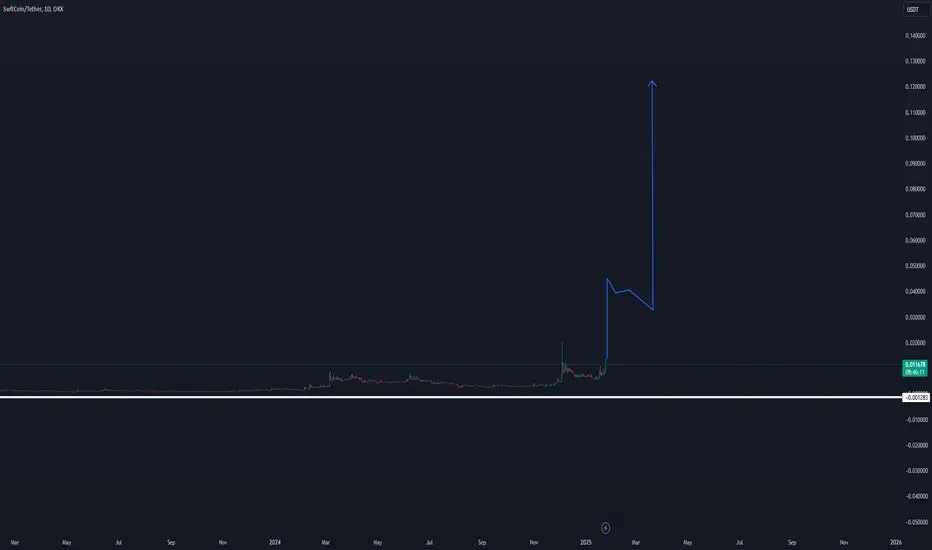
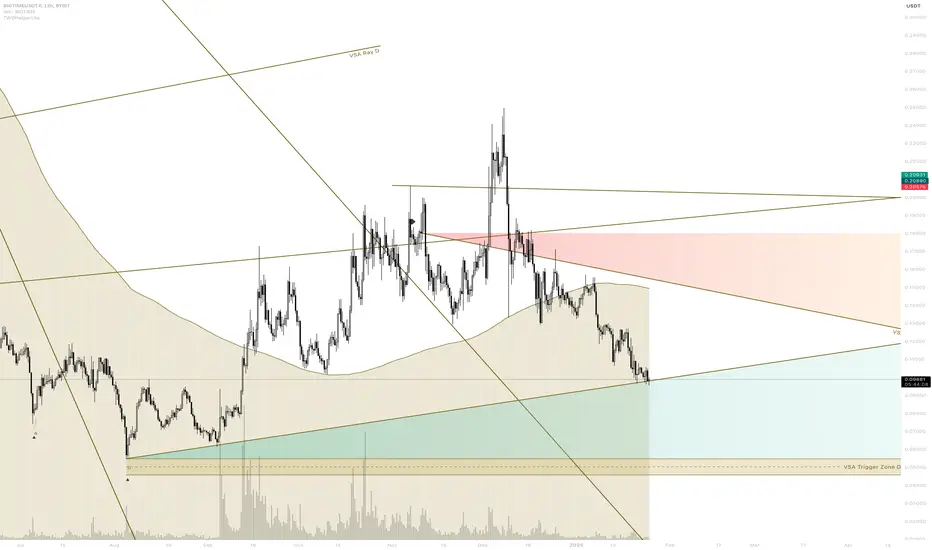
SWFTC/USDT PRICE PREDICTION 2025 $0,12 (Blockchain swift)SWFTC/USDT PRICE PREDICTION 2025
Means for long-term follow, and where the possibility is for this coin 2025
The best way of volume entering is in steps.
Depending on the 2025 protection for this coin, we expect this is a good chance this swift system for blockchain can gain over $0,12
We already know the real swift where billions of transactions going, this one means for the blockchain tech.
How more time the coin stays stable and holding levels, how better it is for the coming volume spike.
This update will stay a prediction, do always your study and manage the risk.
Expect nothing from the market, but more see the possibilities.
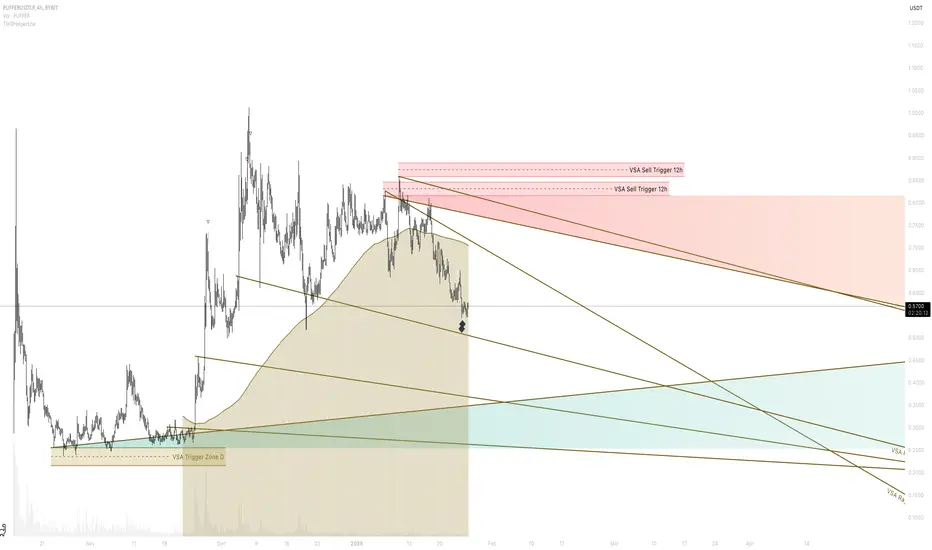
VSA Rays: Mastering the Art of Predicting Future Price MovementsThe cryptocurrency PUFFER/USDT.P has captured our attention today as it flirts with a critical moment of decision. Currently trading at $0.5659, the price reflects a staggering 44% deviation below its all-time high of $1.0122, achieved just 50 days ago. Yet, it has also soared over 138% from its absolute low, a testament to its volatility and potential for rapid moves.
With a Relative Strength Index (RSI) hovering near a neutral 50, and buy volume patterns increasingly dominant over the past 24 hours, the market appears to be in a state of consolidation. The Moving Average 50 (MA50) at $0.5752 suggests minor overhead resistance, while psychological resistance levels are forming near $0.5961, possibly triggering the next rally.
Fundamentally, macroeconomic whispers of liquidity adjustments and renewed interest in altcoin markets are setting the stage for a bold shift. The big question remains: Is this your chance to ride the wave up, or will the bears claw back dominance at this critical threshold? For both traders and investors, the stakes couldn't be higher. The coming days will determine whether PUFFER/USDT.P’s momentum builds into a breakout or fades into retracement.
Are you ready for the ride? The clock is ticking, and this could be your chance to capitalize on a decisive market move. Stay tuned for our detailed analysis on key levels and patterns shaping this opportunity.
PUFFER/USDT.P Roadmap: Decoding the Patterns for Success
Understanding the flow of market movements is crucial for both traders and investors. Here’s a detailed roadmap of the key patterns recently observed in PUFFER/USDT.P, using historical data to confirm their validity and align with anticipated price directions.
January 25, 2025 – VSA Manipulation Buy Pattern 4th
Direction: Buy
Trigger Point: Low of the last 3 bars ($0.5514)
Outcome: The market closed slightly higher at $0.5564, hinting at a bullish impulse. This aligns with the main direction, as the next pattern confirmed upward movement to a high of $0.5777. This is a textbook pattern execution, showing strong buyer momentum.
January 26, 2025 – Increased Buy Volumes
Direction: Buy
Trigger Point: Open price ($0.5628)
Outcome: This pattern delivered as expected, with a close above the open at $0.5768. The immediate next high of $0.5777 supports this buy direction, emphasizing consistent buyer dominance.
January 25, 2025 – Increased Sell Volumes (Skipped)
Direction: Sell
Trigger Point: High of the last 3 bars ($0.6345)
Outcome: Contrary to the sell direction, subsequent price action leaned bullish. This pattern did not trigger effectively, and its impact is minimal in the broader roadmap.
January 24, 2025 – VSA Buy Pattern Extra 1st
Direction: Buy
Trigger Point: Not applicable
Outcome: The market moved consistently higher, with the high extending to $0.6112 shortly after. This pattern highlighted the continuation of a buying trend, supported by increasing volume and a steady climb.
January 22, 2025 – Sell Volumes Take Over (Skipped)
Direction: Sell
Trigger Point: Low of the last 3 bars ($0.5873)
Outcome: While sell volumes showed a momentary dip to $0.5873, the market rebounded quickly, invalidating the sell direction and confirming a persistent bullish bias.
January 23, 2025 – Buy Volumes Take Over
Direction: Buy
Trigger Point: Open price ($0.6024)
Outcome: The price continued upward to $0.6094, marking this as a clean execution of a bullish pattern. Traders who spotted this transition capitalized on the trend.
Key Takeaways from the Roadmap
Bullish patterns like VSA Buy Pattern 4th and Buy Volumes Take Over consistently outperformed, confirming strong market optimism. Sell patterns were largely invalidated, indicating underlying buyer control over the asset during the observed period. Trigger points proved reliable markers for entry, with clear follow-through seen in consecutive highs.
This roadmap demonstrates how understanding pattern execution and aligning with validated directions can significantly enhance trading success. Watch for future VSA Buy Patterns—they've consistently marked golden opportunities for upward momentum. Stay sharp, and ride the trend!
Technical & Price Action Analysis: Key Levels to Watch
When it comes to trading, knowing your levels is half the battle. Below are the critical support and resistance zones for PUFFER/USDT.P, straight from the charts. If these levels fail to hold, you can expect them to flip and act as resistance in the future. Mark these on your radar—miss them at your own risk!
Support Levels
0.5201 – Your first line of defense; a break below could open the door to further downside.
0.2934 – A deeper support level that traders should keep an eye on if the price dives lower.
Resistance Levels
0.5961 – The immediate overhead barrier. Bulls need to clear this for any meaningful push higher.
0.6934 – A higher resistance zone that could attract sell-side interest.
0.7277 – A strong ceiling to watch, marking the upper range of current price action.
0.8881 – A psychological level that’s likely to be a battleground for bulls and bears alike.
Powerful Resistance Levels
1.0122 – The absolute high. Breaking and holding above this level would signal a major trend reversal.
What Happens If These Levels Fail?
If support levels crumble under selling pressure, they’ll likely become resistance as sellers defend their positions. The same goes for resistance—if bulls break through, it flips to support, creating a solid base for further upward momentum. Keep these levels in mind to navigate the chop and make informed decisions in this dynamic market.
This is your roadmap to the action—stay sharp, and let the levels guide your trades!
Trading Strategies Using Rays: From Concept to Actionable Scenarios
The Rays from the Beginning of Movement concept provides a systematic approach to predicting price reactions based on Fibonacci-based geometrical rays. These rays, combined with dynamic factors like moving averages, offer traders a reliable method to identify high-probability trade setups. Below, we outline the framework and suggest two scenarios—optimistic and pessimistic—to align with potential market conditions.
Concept of Rays in Action
Fibonacci Rays and Their Purpose: Each ray defines key dynamic levels derived from the beginning of the price movement. They help map the probable path of the price and identify zones for potential reversals or continuations.
Dynamic Factors: Moving averages (e.g., MA50, MA100, MA200) act as secondary confirmation tools. When price interacts with a ray and aligns with a moving average, the probability of a valid move increases.
Actionable Levels: Traders focus on interactions between rays, moving averages, and VSA patterns on the chart. After a confirmed interaction, the price typically moves from one ray to the next, presenting opportunities for profitable trades.
Optimistic Scenario: A Breakout with Momentum
Initial Interaction Zone: $0.5752 (MA50)
First Target: $0.5862 (MA100, next ray level)
Second Target: $0.6272 (MA200, upper ray boundary)
Third Target: $0.6468 (Extended ray, potential continuation)
Commentary: In this scenario, the price demonstrates bullish momentum after interacting with the MA50 and first Fibonacci ray. Buyers take control, driving the price to subsequent ray levels.
Pessimistic Scenario: A Controlled Decline
Initial Interaction Zone: $0.5752 (MA50)
First Target: $0.5201 (Key support level)
Second Target: $0.2934 (Lower ray boundary)
Third Target: $0.2375 (Absolute low)
Commentary: Here, the price fails to sustain above the MA50, leading to a downward interaction with Fibonacci rays. Sellers dominate, targeting progressively lower levels.
Potential Trade Setups Based on Ray Interactions
Bullish Entry: After price confirms an upward bounce from $0.5752, enter long, aiming for $0.5862 (first target). Place a stop-loss below $0.5730 to manage risk.
Bearish Entry: If the price rejects $0.5752, consider a short position targeting $0.5201 with a stop-loss above $0.5770.
Breakout Trade: Watch for a breakout above $0.5862 with strong volume. Enter long with targets at $0.6272 and $0.6468.
Range Trade: If the price oscillates between $0.5752 and $0.5862, use the range to buy near support and sell near resistance.
Final Notes
The combination of Fibonacci rays and moving averages creates a robust system for identifying dynamic trade zones. Remember, trades should only be entered after clear interaction and validation from the rays and dynamic factors. Whether the market trends bullish or bearish, these scenarios provide a clear framework for traders to follow and adapt as conditions unfold.
Your Turn to Join the Conversation
Hey traders and investors! Let’s make this space interactive. If you’ve got questions about the analysis, specific levels, or just want to dive deeper into the strategy—drop them right in the comments. I’ll be happy to answer and discuss with you.
If you found this analysis helpful, don’t forget to hit Boost and save the idea to revisit later. Watching how price reacts to these levels is the best way to learn and grow as a trader. Remember, understanding entry and exit points is key to consistent success.
For those interested, my proprietary indicator automatically maps out all the rays and levels you see here. It’s available privately, so if you’re curious about using it, feel free to send me a message directly.
Have a specific asset in mind? I’m open to providing analysis! Some ideas I’ll post here for everyone to benefit from, and for others, we can discuss more personalized setups. Whether it’s public or private, we can figure out the best approach together.
Lastly, don’t forget to follow me here on TradingView. This is where I post all my insights and updates, and I’d love to have you as part of my trading community. Let’s keep learning and growing together—one chart at a time. 🚀
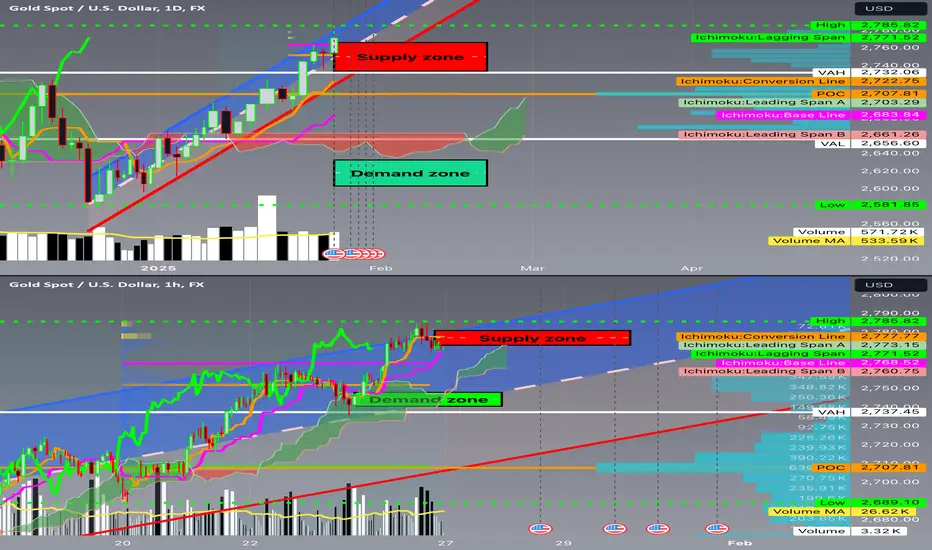
XAUMO: The Ultimate Multi-Timeframe Gold Analysis ReportXAUMO: The Ultimate Multi-Timeframe Gold Analysis Report
Period: January 27 – February 2, 2025
📊 Daily Chart (Long-Term Trend)
🔍 Ichimoku Analysis:
• Clouds (Kumo):
• Thick Kumo ($2,744-$2,752) providing strong long-term support.
• Future Kumo: Steep bullish slope with (Senkou Span A > Senkou Span B), reinforcing the bullish trend.
• Tenkan/Kijun (TK/KS) Crosses:
• Type of Cross: Bullish cross above the Kumo.
• Support Levels:
• Tenkan ($2,774): Dynamic short-term support.
• Kijun ($2,761): Key support during pullbacks.
• Chikou Span:
• Positioned above price and Kumo, confirming strong bullish control.
• Stable slope, suggesting minor consolidation.
📈 Regression Channel Analysis:
• Price is moving within an upward channel, with resistance near $2,785-$2,790, signaling potential overbought conditions.
🔗 Support and Resistance Levels (VRP):
• POC: $2,771 (Pivot point for accumulation).
• VAH: $2,785 (Supply zone).
• VAL: $2,756 (Demand zone).
📦 Supply and Demand Zones:
• Supply: $2,785-$2,790.
• Demand: $2,744-$2,752.
⏳ Sushi Kinko Cycles:
• 26-Period Cycle: Confirms bullish continuation toward $2,800.
📌 Tradeable Levels:
• Upside: $2,785-$2,810 (Fibonacci Extension 161.8%).
• Downside: Below $2,756 targeting $2,740 (VWAP).
⏳ 4-Hour Chart (Swing Trading)
🔍 Ichimoku Analysis:
• Clouds (Kumo):
• Moderate thickness supporting price at $2,744-$2,752.
• Steep bullish slope confirming momentum.
• Tenkan/Kijun (TK/KS) Crosses:
• Bullish cross above the Kumo, reinforcing the trend.
• Key Supports:
• Tenkan ($2,774): Immediate support.
• Kijun ($2,761): Major support.
• Chikou Span:
• Positioned above price and Kumo, signaling strong bullish pressure.
• Upward slope, enhancing bullish momentum.
📦 Supply and Demand Zones:
• Supply: $2,785-$2,790.
• Demand: $2,744-$2,752.
⏳ Sushi Kinko Cycles:
• 9-Period Cycle: Minor pullback toward $2,771.
• 26-Period Cycle: Signal for a move toward $2,800.
📌 Tradeable Levels:
• Upside: $2,785-$2,810.
• Downside: $2,756-$2,744.
⏳ 1-Hour Chart (Intraday)
🔍 Ichimoku Analysis:
• Clouds (Kumo):
• Weak clouds with support near $2,774-$2,771.
• Moderately bullish slope.
• TK/KS Crosses:
• Tenkan ($2,777): Immediate support.
• Kijun ($2,773): Key support level.
📦 Supply and Demand Zones:
• Supply: $2,785-$2,790.
• Demand: $2,773-$2,765.
📌 Tradeable Levels:
• Buy: $2,773 targeting $2,785.
• Sell: Rejection at $2,785 targeting $2,773.
⏳ 30-Minute Chart (Scalping)
🔍 Ichimoku Analysis:
• Thin clouds supporting upward momentum.
• Tenkan ($2,777): Immediate support.
• Kijun ($2,773): Major support for scalping.
📌 Tradeable Levels:
• Buy: $2,773 targeting $2,785.
• Sell: Rejection at $2,785 targeting $2,773.
🔑 Summary:
• Bullish Bias: Above $2,785 targeting $2,800-$2,810.
• Bearish Bias: Below $2,756 targeting $2,740.
• Pivot Point: $2,771 (POC).
📌 Session Insights:
• Tokyo: Scalping at $2,773.
• London: Rejection at $2,785 or breakout opportunities.
• New York: Breakout above $2,785 or correction toward $2,771.
🔗 A blend of analytical tools for a precise and balanced trading strategy.
ETH - Super bullish inverse H&SCould we be looking at a super bullish scenario of an inverse head and shoulders for ETH? It looks ugly, but could work if the neckline is decisively breached. If it is, we could be looking at some serious gains for ETH. This isn't meant to be fake news or an attempt to gain followers, it's all on the pile of possibles until made improbable. So, we'll keep our fingers crossed and look for higher highs. Until then, follow for more.

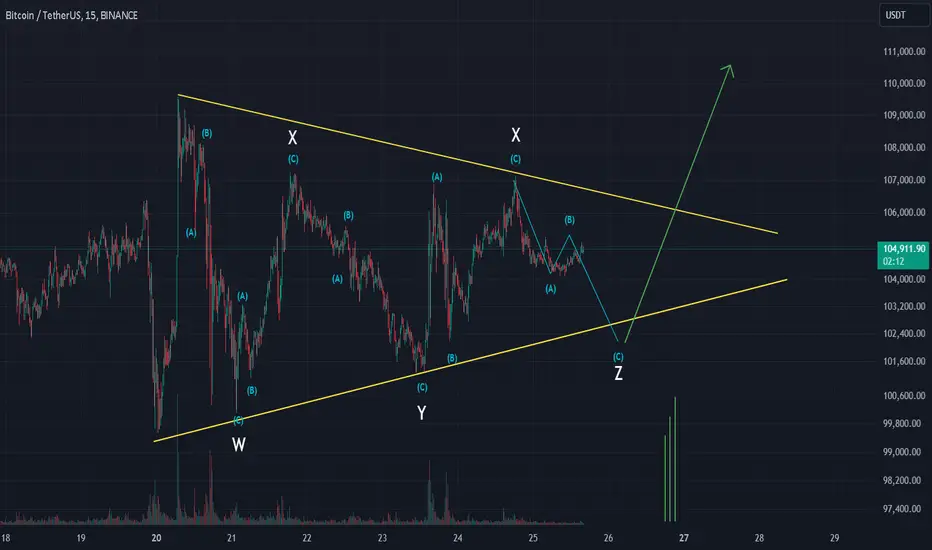
BTC - Steady... steady... almost there!BTC in the short term is looking very much like a WXYXZ is forming. We should therefore see a low, which could temporarily breach the lower trend line. In fact, it'd make for a bullish signal if it did - so watch this carefully. If we see it ping back within the channel, then the formation will likely complete. Next thing we'll need to look for us the breakthrough of the upper trend line. This would then lead to higher higher and the completion of wave 5 of 1 which we have long been looking for. I'm not going to take any actions here until either trend line is decisively broken leading to a trend change. Looks good though, follow for more.
Complete analysis and review of Ethereumhello friends
We came with Ethereum analysis
As you can see, the price reached good support after a drop and was able to grow.
Now that the price has compressed and created a triangle for us, we are facing two scenarios:
1_ According to the beginning of the upward trend, succeed in breaking the ceiling and move to the specified goals.
2_ The price should fall from here until the support area is determined and then it starts to climb.
In our opinion, scenario 1 is more tolerant.
*Trade safely with us*

FWOGUSDT: Approaching the Turning Point – What’s Next?FWOGUSDT is trading at $0.12006, hovering just above its absolute low of $0.11783, established only hours ago. This marks a staggering -84.6% retreat from its absolute high of $0.78189, reached just 72 days prior. With RSI14 dipping to 29.42, the asset is entering oversold territory, raising the stakes for a potential reversal or a continuation of the bearish trend.
A surge in sell volume, as confirmed by recent VSA patterns, highlights increasing market activity amidst uncertainty. The asset is also testing critical resistance at $0.13946 while struggling to break above the 50-day moving average of $0.15193, emphasizing the importance of this consolidation phase.
Is the market setting the stage for a bullish rebound or bracing for deeper lows? With macroeconomic factors such as volatile liquidity conditions and heightened market sentiment, the next move could offer opportunities for both traders eyeing quick scalps and investors seeking long-term positioning.
The big question remains: Are you ready to seize the moment, or will this opportunity pass you by? Stay tuned as we dive deeper into the technicals and strategies for this critical juncture.
Roadmap: Tracing FWOGUSDT’s Path Through Pattern Dynamics
FWOGUSDT has had a whirlwind of activity in recent trading sessions, as highlighted by a sequence of critical patterns. Below, we’ve broken down the roadmap of these patterns in order of their emergence, filtering only the ones that delivered accurate directional moves based on the previous pattern’s main direction.
Pattern 1: Increased Sell Volumes (Jan 21, 18:00 UTC)
The market initiated a significant sell wave, closing at $0.21192 after an open of $0.22732, marking a notable drop. The main direction was clearly bearish, and this pattern laid the groundwork for subsequent sell-offs.
Pattern 2: Buy Volumes Takeover (Jan 23, 20:00 UTC)
Despite a brief bullish attempt that pushed the price to a high of $0.16481, the market turned back to bearish territory, aligning with the previous sell-off. This confirms the direction set earlier, showing the strength of sellers.
Pattern 3: VSA Buy Pattern Extra 1st (Jan 25, 00:00 UTC)
Here, the market attempted a reversal, with a closing price of $0.12599 and a high of $0.13648. While buyers showed strength, the follow-through failed as the price closed lower in subsequent sessions. This indicates the struggle of bulls to reclaim control.
Pattern 4: Increased Sell Volumes (Jan 25, 02:00 UTC)
The most recent sell-off, aligning perfectly with the earlier bearish direction, confirms the dominance of sellers. With a low of $0.11783, FWOGUSDT reached its absolute bottom. This marks a critical juncture for traders.
Key Takeaways
The bearish trends dominated, with multiple sell patterns confirming the overall downtrend.
Bullish patterns showed potential but failed to break critical resistance, indicating weak momentum.
The most recent bearish breakout to $0.11783 highlights the market’s vulnerability at these levels.
What’s Next?
Investors and traders should watch for sustained price action at critical support zones. Will the bulls finally stage a comeback, or is more downside ahead? Follow the roadmap to stay in tune with the market's rhythm!
Technical & Price Action Analysis: Key Support and Resistance Levels
When it comes to navigating the FWOGUSDT price action, the key levels below are your bread and butter. Let’s break it down:
Support Levels
These zones are where buyers are likely to step in. If the market doesn’t respect these, expect them to flip into resistance faster than you can blink:
$0.11783 – This is the absolute low. If broken, we’re diving into uncharted waters.
$0.29444 – A strong psychological area to watch if prices stage a rally from current levels.
Resistance Levels
Here’s where sellers are holding their ground. Break these, and the bulls might just get the upper hand:
$0.13946 – The first line of fire for any upward push.
$0.19064 – A significant hurdle for medium-term bulls.
$0.23757 – Beyond here, the market might just start cooking.
$0.25695 – The final boss level for this structure.
Powerful Support Levels
These are your safety nets if the market wobbles. But if they give way, you’re looking at resistance zones in the making:
$0.29444 – Not just a level, but a fortress for the bulls to defend.
Powerful Resistance Levels
While none were detected in this cycle, keep an eye on the levels above as potential magnets for price.
Pro Tip: If these levels don’t play out, the market could be flipping the script, turning support into resistance or resistance into support. Keep your eyes peeled and trade smart!
Trading Strategies Using Rays: Optimistic and Pessimistic Scenarios
The "Rays from the Beginning of Movement" concept provides traders with dynamic levels derived from Fibonacci principles. These rays form a predictive framework, guiding price action from one ray to the next. Interactions between rays and moving averages (MAs) further confirm key market zones. Let’s dive into the strategy.
Concept Overview
Rays and Fibonacci: Rays are constructed at precise angles that correlate with the start of a trend.
Dynamic Levels: The rays adjust to new patterns, providing an updated roadmap for price movement.
Key Interaction Points: Trade entries are based on price reactions to rays, confirmed by interaction with MAs.
Directional Flow: Price moves from one ray to the next, making each ray a potential trade target.
Scenarios and Strategies
Optimistic Scenario
This assumes the price successfully interacts with a ray, confirming bullish momentum.
Initial Entry Point: Interaction at support ray near $0.11783 (absolute low).
First Target: $0.13946 (next ray and first resistance level).
Second Target: $0.19064 (medium-term ray resistance).
Confirmation Tools: Price above MA50 ($0.15193) signals upward momentum.
Pessimistic Scenario
In this scenario, the price interacts with a resistance ray and begins to reverse, confirming bearish sentiment.
Initial Entry Point: Rejection at resistance ray near $0.13946.
First Target: $0.11783 (absolute low and ray support).
Second Target: $0.29444 (long-term powerful support zone, now acting as resistance).
Confirmation Tools: Price below MA50 ($0.15193) reinforces a downward trend.
Suggested Trades
Bullish Trade Idea :
Enter long at $0.11783 after confirmation of ray support and MA interaction. First target $0.13946, with stop-loss below $0.11700.
Bearish Trade Idea :
Enter short at $0.13946 upon rejection. First target $0.11783, with stop-loss above $0.14000.
Scalp Trade Idea :
Trade between $0.13946 and $0.19064 for quick profits within the ray structure, confirming movement via the MA50.
Final Thoughts
Dynamic rays and MAs act as a dual system for identifying actionable trades. Always enter after a confirmed interaction and let the price move between rays for optimal profit opportunities. Adapt to new ray formations and keep an eye on volume surges for added confirmation. This strategy offers precision for both cautious and aggressive traders.
Your Feedback and Ideas Matter!
Hey traders, thanks for taking the time to explore this analysis! If you’ve got questions or ideas, don’t hesitate—drop them in the comments. I love seeing your thoughts and will do my best to respond to everyone.
If this idea resonates with you, hit Boost and save it to your favorites so you can revisit it later and track how the price moves along my levels. This is the cornerstone of successful trading—understanding the points where trades can be made with confidence.
For those curious about my indicator-strategy, it automatically plots all the rays and levels, simplifying your analysis. While it’s available privately, feel free to DM me if you’re interested in using it—I’m happy to share details.
Need a custom analysis for your favorite asset? Let me know in the comments! I’m open to doing some for free and posting them here, or working on something private if you’d prefer to keep your ideas exclusive. The rays work on any asset, and I can craft a personalized layout just for you.
And of course, if you’d like to see more of my work, follow me here on TradingView. This is where I post all my articles and strategies, so don’t miss out!
Trade smart, stay curious, and let’s keep the conversation going! 💬📊

Is SWARMUSDT Ready for a Breakout?
SWARMUSDT has entered a fascinating phase, trading at $0.11341, far below its historical peak of $0.62689—a stunning 81.91% deviation from the highs recorded just 18 days ago. Yet, with the asset rebounding 25.1% above its recent low, the question arises: Is this the calm before the storm?
Current technicals suggest a potential setup worth watching. The RSI sits at 36.39, hinting at oversold conditions, while a series of VSA Buy Patterns on recent candles signal accumulation at these levels. With the MA50 trending downward to $0.13403, SWARMUSDT remains under pressure—but could this be the catalyst for a breakout as bulls test new resistance?
In a market swayed by macroeconomic shifts and investor sentiment, now is the time to stay vigilant. Is this your opportunity to ride the wave, or will the market pull back for one last consolidation? Keep an eye on this volatile mover—every second counts.
Roadmap of SWARMUSDT: From Signal to Momentum
Dive into the timeline of recent SWARMUSDT patterns to decode how the asset’s price movements align with key signals. Let’s analyze the most relevant patterns that hit the mark and proved their predictive power.
VSA Buy Pattern Extra 1st: January 25, 2025
Direction: Buy
The opening price of $0.11491 and closing at $0.1109 didn’t fully deliver immediate upside action. While the pattern aimed for a bullish push, the subsequent VSA Buy Pattern Extra 1st on January 24 also signaled Buy—validating a short-lived reversal that held potential. Prices stayed in a tight range but hinted at incoming accumulation.
Increased Sell Volumes: January 24, 2025
Direction: Sell
Here’s where things get spicy. The asset opened at $0.141 but sharply closed at $0.12597—a classic example of heavy sell-side pressure. This sell pattern succeeded in directing the market downward, confirming a clear alignment with the downward trajectory.
VSA Buy Pattern Extra 1st: January 23, 2025
Direction: Buy
This time, the Buy signal partially delivered. Opening at $0.15108, the price closed only marginally lower at $0.15101. However, it’s the interaction with the subsequent Buy Volumes pattern on January 22 that confirmed this pattern's intent, as the price rallied from $0.2026 to $0.22059—an undeniable proof of accumulation feeding the fire.
Increased Buy Volumes: January 22, 2025
Direction: Buy
This is the breakout you dream of. The market opened at $0.2026 and closed strongly at $0.22059, proving the upward bias was no fluke. What followed was a confirmation that this momentum marked a reversal point, supported by the next sequence.
VSA Manipulation Sell Pattern 2nd: January 21, 2025
Direction: Sell
The bears momentarily gained control here, with the price falling from $0.17216 to $0.1641. This retracement set the stage for the next accumulation phase, aligning perfectly with the Buy Volumes pattern that came to fruition soon after.
Buy Volumes Takeover: January 21, 2025
Direction: Buy
Boom. The market rebounded, closing at $0.17529 after an opening of $0.16161, signaling a firm buyer's grasp. This aligned perfectly with the trendline’s trajectory and set up a bullish consolidation period.
Key Takeaways for Traders
The Buy Volumes pattern consistently validated itself, signaling effective accumulation and trend reversals. Sell patterns like Increased Sell Volumes confirmed bearish phases, ensuring traders were aware of short-term downward movements. The roadmap suggests that combining VSA patterns with volume indicators amplifies accuracy. Future opportunities lie in identifying similar setups and leveraging momentum for entry/exit strategies.
This sequence is your guide to understanding how predictive signals can transform trading outcomes. Stay tuned and keep an eye on the next wave of SWARMUSDT patterns!
Technical & Price Action Analysis: Key Support and Resistance Levels
Let’s break it down with pinpoint accuracy. These levels are the battle lines where bulls and bears will clash, and price action will reveal its hand. If these levels don’t hold, they’ll flip into resistance zones, so keep a close watch.
Support Levels:
These levels are where buyers might step in to defend the trend:
0.09065 (recent absolute low)
If broken, expect this level to act as a brick wall of resistance for any bullish recovery attempts.
Resistance Levels:
These are the ceilings that price needs to smash for a breakout:
0.14784
0.24552
0.3642
If momentum fizzles out here, these levels will flip, becoming tough hurdles for the bulls.
Powerful Support Levels:
Currently, no standout zones are in play, suggesting the price is testing buyers’ resolve near dynamic supports like moving averages.
Powerful Resistance Levels:
Major areas to watch where the bears are likely to stack their sell orders:
0.24552 (also aligns with a key fib retracement zone).
Once the market closes above this with volume, a significant bullish run could ignite, but failure will likely spell trouble for any recovery momentum.
The game plan is simple: watch how the price reacts at these zones. A breakout or failure will guide the next move. Always trade with a plan—respect the levels, and let the market show its hand before diving in.
Trading Strategies Based on Rays: Fibonacci Meets Market Dynamics
The "Rays from the Beginning of Movement" concept integrates Fibonacci-based geometric principles with dynamic price action, creating a robust framework for trading SWARMUSDT. By leveraging these rays, traders can identify high-probability zones for interaction and subsequent movement, supported by dynamic factors such as Moving Averages and VSA (Volume Spread Analysis) rays.
Concept of Rays
Core Idea: Rays, based on Fibonacci angles, are drawn from the start of movement patterns to define channels and dynamic interaction zones. Unlike classical analysis relying on extremum points, this method adapts to market dynamics in real-time.
Dynamic Factors: Interaction with key Moving Averages (MA50, MA100) provides additional confirmation of trends and support/resistance zones.
Interaction Scenarios: When the price interacts with a ray, traders should wait for confirmation of reversal or continuation patterns. This ensures trades are placed at moments of high probability. Targeting Zones: Each ray transition creates a roadmap of price objectives, with the price typically moving from one ray to the next, offering clear entry and exit strategies.
Trading Scenarios
Optimistic Scenario:
Key Interaction Zone: Price bounces off the ascending Fibonacci ray near $0.11341 and interacts with MA50 at $0.13403.
Targets:
First target at $0.14784, aligned with dynamic resistance and the next Fibonacci ray.
Second target at $0.24552, achievable upon breaking MA100 at $0.1545.
Third target at $0.3642, signaling a significant trend breakout.
Strategy: Enter long after confirmation of the bounce from $0.11341, supported by volume and bullish VSA rays. Maintain trailing stops as the price moves toward each target.
Pessimistic Scenario:
Key Interaction Zone: Price fails to hold above the Fibonacci ray at $0.11341 and breaks below the critical level of $0.09065.
Targets:
First target at $0.09065, turning into resistance if broken.
Second target at $0.081, representing a potential oversold zone if significant bearish pressure emerges.
Strategy: Enter short after confirmation of a breakdown below $0.11341 and a bearish crossover of MA50 and MA100. Look for VSA sell signals to reinforce the decision.
Suggested Trades
Long from $0.11341 to $0.14784: Entry after interaction with the Fibonacci ray and confirmation of bullish momentum.
Short from $0.11341 to $0.09065: Entry upon bearish break below the ray, confirmed by sell-side volume dominance.
Continuation Long from $0.14784 to $0.24552: Add to positions after a breakout and interaction with MA100.
Trend Reversal Short from $0.14784 to $0.09065: Reevaluate bias if price fails to hold above the ray and reverses significantly.
These strategies offer traders flexibility to adapt to either direction, leveraging the synergy of Fibonacci rays, MAs, and VSA dynamics. Plan your entries wisely, and let the rays guide your trades from level to level!
Your Questions and Ideas Matter!
Hey traders! Let’s keep the conversation alive—drop your questions, thoughts, or requests right here in the comments. I always enjoy hearing your insights and discussing how we can navigate these markets together.
If you found value in this idea, don’t forget to hit Boost and save it to revisit later. Watching how the price respects the levels and rays over time is a game-changer—it’s all about nailing those key zones for entry and exit. Let’s see how this setup plays out together.
By the way, my indicator draws all these rays and levels automatically, making analysis smoother and more accurate. If you’re interested in accessing it, shoot me a private message—I’ll be happy to explain how it works. Whether you’re new or experienced, I can help tailor strategies to your needs.
Have an asset in mind that you’d like analyzed? Leave a comment with the ticker, and if it resonates, I’ll do my best to share a breakdown. For more detailed, private analysis, let’s chat directly—we can work out the perfect solution for your needs.
If you enjoy this content, hit Follow to stay updated with my latest ideas and strategies. It’s here on TradingView that I’ll continue sharing insights, so let’s grow together! 🚀
Trade smart and stay inspired!

Big Time (BYBIT-BIGTIMEUSDT.P): A Hidden Giant Poised for ActionThe Market's Crossroads: Ready for the Next Big Wave?
Imagine holding an asset that’s down over 90% from its historical highs yet brimming with subtle signs of revival. Big Time (BYBIT-BIGTIMEUSDT.P) is trading at $0.09929, a far cry from its $0.9995 peak, but its deviation creates a golden window for both opportunistic traders and long-term investors. With RSI hovering near a neutral 47, the market appears undecided, creating an atmosphere thick with potential.
Adding intrigue, the "VSA Buy Pattern Extra 1st" and other bullish patterns from recent trading sessions highlight momentum brewing below the surface. The asset seems primed to break past resistance levels of $0.11624 and higher, while the moving averages suggest this consolidation could be the calm before a storm.
Could this be the moment the market pivots? With fundamentals steady and technical signals aligning, Big Time may just be living up to its name. Are you ready to ride the wave? The clock is ticking.
Roadmap: Big Time's Pattern Analysis and Market Journey
January 23, 2025, 21:00 UTC: VSA Buy Pattern Extra 1st - The Setup The market flashed a VSA Buy Pattern Extra 1st with a main_direction: Buy, aiming for a breakout above key resistance levels. However, the subsequent candle failed to align with the bullish projection as the price closed lower, nullifying the pattern’s expected trigger. This pattern was skipped as it did not deliver on its forecast.
January 24, 2025, 11:00 UTC: Increased Buy Volumes - A Bullish Signal Emerges This pattern signaled heightened buying pressure, with the price closing higher at $0.10378, a decisive move aligning with the bullish direction. The increased volume reinforced the strength of the move, setting the stage for a potential trend reversal. This pattern validated its signal and established a positive market tone.
January 24, 2025, 22:00 UTC: VSA Buy Pattern Extra 2nd - Momentum Builds As the price rallied from the earlier Increased Buy Volumes, this pattern continued to support the bullish narrative. The price hovered above the $0.09916 low, confirming the strength of the prior setup. The trend gained traction, with the next bars maintaining the upward trajectory—a textbook example of pattern validation.
January 25, 2025, 00:00 UTC: VSA Buy Pattern Extra 1st - The Breakout Play Closing at $0.09567, this pattern projected another main_direction: Buy. The subsequent movement saw the price stabilize, with no significant downward corrections, proving the resilience of the bullish momentum. As the price tested key levels without breaking the upward trendline, traders had a clear signal to ride the wave.
Takeaway
Big Time's recent patterns reflect a game of patience and precision. By sticking to validated setups like the Increased Buy Volumes and tracking the interplay of price and direction, traders can navigate with confidence. Whether you're looking for short-term pops or longer-term positioning, the roadmap above provides clarity on when to jump in and ride the action. Are you ready to capitalize on the next big move?
Technical & Price Action Analysis: Key Support and Resistance Levels
Support Levels
The current playbook for support shows price flirting with soft zones that could act as springboards if the market behaves. These include:
Support 1: $0.0727
Support 2: $0.0657
If the price slices through these levels without any bounce, they flip to resistance—tough barriers that could choke any upside attempts.
Resistance Levels
Where the bulls need to show up big to clear the air:
Resistance 1: $0.11624
Resistance 2: $0.12546
Resistance 3: $0.12934
Resistance 4: $0.13203
Resistance 5: $0.13467
If the market can't sustain above these levels, expect them to act as headwinds, keeping prices boxed in.
Powerful Support Levels
Stronger levels that could hold the fort if volatility spikes:
Powerful Support 1: $0.11475
Powerful Support 2: $0.3138
Powerful Support 3: $0.6463
Break these, and it’s game over for the bulls, with these levels flipping to powerful resistance zones.
Powerful Resistance Levels
Big dogs on the chart—the ones to break for a breakout run:
Powerful Resistance 1: $0.0727
Powerful Resistance 2: $0.0657
If these get tested and fail to crack, they’ll anchor the market to lower trading ranges.
Summary
These levels are your roadmap—play them right, and they’ll be your guide. But remember, in trading, what doesn’t hold as support becomes the wall to climb as resistance. The market doesn't owe anyone, so trade smart and stay nimble!
Concept of Rays: Trading Strategies and Scenarios
The "Rays from the Beginning of Movement" concept provides a unique approach to identifying dynamic levels where price interaction signals potential reversals or continuations. Built on Fibonacci principles, these rays adapt to new trends, offering traders actionable insights.
How Rays Work in Practice
Fibonacci Rays and Their Dynamic Role
Constructed from the start of movement patterns, rays provide dynamic support and resistance zones. Unlike traditional methods, rays adjust in real-time, defining boundaries for trend channels and helping traders anticipate movements.
Moving Averages as Dynamic Factors
Key MAs (e.g., MA50, MA100, MA200) interact with rays, confirming potential entry points. When price crosses a ray near a critical MA, it’s a signal for possible trend continuation or reversal.
From Ray to Ray Movement
Once price interacts with a ray, traders can expect movement toward the next ray, offering clear trade targets. Entry occurs after confirmation of interaction, with the first target being the next ray, followed by subsequent levels.
Optimistic Scenario: Bullish Trade Setup
Price is currently trading near MA50 ($0.10033) and a key ascending ray. If interaction occurs and the price breaks upward:
First Target: $0.11624 (Resistance Level)
Price interaction with this resistance may trigger further bullish momentum.
Second Target: $0.12546 (Next Resistance)
A continuation beyond the first ray indicates strengthening bullish sentiment.
Third Target: $0.12934 (Final Ray for Trade)
This would signal an extended move, reaching the boundary of the current bullish channel.
Pessimistic Scenario: Bearish Trade Setup
If price fails to hold above the MA50 and descends through the ray:
First Target: $0.0727 (Powerful Support)
A breakdown here could reinforce bearish pressure.
Second Target: $0.0657 (Next Support)
Price continuation toward this level suggests a deeper corrective phase.
Third Target: $0.0548 (Absolute Low)
A breach of this ray signals a potential long-term bearish trend.
Sample Trade Ideas
Long Trade
Entry: Upon confirmation of interaction with ascending ray and MA50.
Targets: $0.11624 (T1), $0.12546 (T2), $0.12934 (T3).
Stop Loss: Below the ray and MA50.
Comment: Bullish momentum driven by ray alignment and MA support.
Short Trade
Entry: After price breaks below descending ray and MA50.
Targets: $0.0727 (T1), $0.0657 (T2), $0.0548 (T3).
Stop Loss: Above the ray and MA50.
Comment: Bearish continuation fueled by interaction with descending rays.
Conclusion
These strategies are built on precise ray alignments and dynamic MA factors visible on the chart. Every level becomes a crucial step in managing trades effectively. By following the movement from ray to ray, traders can capitalize on high-probability setups while adapting to changing market dynamics. Let the rays guide your way!
Let’s Keep the Conversation Going!
Have questions or thoughts? Don’t hesitate—drop them in the comments! Your insights and ideas matter, and I’m here to discuss them with you. Whether it’s clarifying levels, refining strategies, or just sharing perspectives, let’s connect and grow together.
If you found this analysis helpful, hit Boost and save the post to revisit later. Watch how the price respects the rays and levels we’ve outlined—because nailing those key zones is what trading is all about.
For those curious about my indicator-strategy that automatically maps out all the rays and levels: it’s available privately. If you’d like access, just send me a direct message, and we’ll figure something out. It’s a game-changer for precise trading on any asset.
Need analysis for your favorite asset? Let me know in the comments or DM me. Some ideas I share openly, while others can be personalized if you prefer to keep them private. The rays work universally, and I can create a tailored setup for you, no matter the market.
Lastly, don’t forget to follow me here on TradingView. This is where all my updates, insights, and new strategies land first. Let’s build a trading community that thrives on knowledge and results. 🚀
Looking forward to your comments and boosts—let’s make trading smarter together!
Will CVCUSDT Rebound or Continue to Decline?Can the Bulls Revive Momentum, or Will the Bears Rule?
With the current price of $0.14603, CVCUSDT has deviated nearly -54% from its all-time high of $0.31737, set back in March 2024. The market has been hovering in a zone of indecision, with its RSI at 52.7, signaling a neutral stance—neither overbought nor oversold.
Recent patterns, such as the "VSA Buy Pattern Extra 1st," suggest potential upside, supported by the MA50 of $0.14429 acting as dynamic support. However, resistance looms at $0.15543, testing the resolve of buyers. Meanwhile, macroeconomic headwinds and a cooling momentum in MFI at 45.57 underscore a challenging road ahead.
The question remains: Will the bulls manage to overcome resistance, or is this the setup for a further leg downward?
In this pivotal moment, traders must assess whether the recent upward flickers signal a recovery or merely a pause in the ongoing decline. Stay tuned for further insights!
Let me know if you'd like me to expand or adjust the tone.
Roadmap of Recent Patterns: CVCUSDT’s Price Movements Decoded
This roadmap dives deep into the chain of verified patterns shaping CVCUSDT’s recent price movements. Only the patterns with confirmed trigger points and validated main directions are included, ensuring we focus on actionable insights for traders.
January 23, 21:00 UTC – Buy Volumes Takeover (Sell Direction)
At this point, the price closed at $0.14092, signaling a potential sell-off. The next pattern confirmed this direction as the subsequent bars pushed the price down further, reaffirming the sell bias.
January 24, 04:00 UTC – Increased Buy Volumes (Buy Direction)
Here, the market showed a rebound with a close at $0.14366, above the key low of $0.14080. This directional shift was validated by the subsequent upward momentum, demonstrating the effectiveness of this buy setup.
January 24, 06:00 UTC – VSA Sell Pattern 2 (Sell Direction)
Price action confirmed this sell direction as the next few bars pushed the price downward, with a close at $0.14566, validating the pattern’s prediction. The previous buy trigger point around $0.14366 acted as temporary resistance.
January 24, 13:00 UTC – VSA Sell Pattern 4 (Sell Direction)
This was a textbook example of follow-through. The price closed lower at $0.14765, maintaining the bearish momentum. Trigger zones from earlier patterns remained untested as the market adhered to the bearish outlook.
January 25, 00:00 UTC – VSA Buy Pattern Extra 1st (Buy Direction)
Closing at $0.14281, this pattern marked a shift to bullish momentum. The price moved upward in the next sessions, confirming the buy direction and establishing support around the $0.14268 zone.
January 25, 12:00 UTC – Current Status
The most recent patterns suggest a tug-of-war between buyers and sellers, with $0.15543 resistance as the critical level to watch. Future confirmation of buy or sell zones will depend on whether the market respects the established supports and resistances.
This sequence highlights a dynamic interplay between bullish and bearish setups, with actionable confirmation points aligning with broader market movements. Traders should remain vigilant, especially around the resistance zones, to capitalize on potential breakout opportunities.
Technical & Price Action Analysis: Key Levels in Focus
In this section, we break down the major support and resistance levels currently shaping CVCUSDT. These levels are not just markers—they’re the battlegrounds where buyers and sellers duke it out. If these levels don’t hold, they will flip roles and become strong resistance zones to watch for potential pullbacks.
Support Levels
0.14009 – A critical level where buyers have stepped in before. If it doesn’t hold, expect it to act as resistance on the next push upward.
0.13301 – The last line of defense before the bears take full control.
Resistance Levels
0.15543 – First big hurdle for the bulls. A clean break here could open the door to higher highs.
0.16423 – Momentum needs to stay strong to clear this zone.
0.17641 – A key level that could act as a magnet if momentum continues.
0.18664 – Breaking this will be a significant milestone for bulls, confirming mid-term strength.
0.18997 – The final major resistance before potential new highs. Watch for exhaustion here.
Powerful Support Levels
Currently absent—suggesting the market may lack the deep buyer conviction needed for a solid base.
Powerful Resistance Levels
0.11096 – A fortress of resistance; if tested and rejected, it could send the price spiraling downward.
0.08804 – A distant, but highly significant, ceiling that could come into play in a bear-dominated market.
These levels will define the next moves. Bulls need to lock and hold support levels, while bears are waiting for resistance to falter. Stay sharp—levels that break could flip roles and become the next hotspots for action.
Concept of Rays: A Precise Framework for CVCUSDT Trading Strategies
The "Rays from the Beginning of Movement" concept relies on Fibonacci-based principles to create dynamic levels that predict potential price movements. These rays adapt to new trends and corrective phases, offering a unique advantage in forecasting interaction zones. Combined with Moving Averages (MA) and VSA rays visible on the user’s chart, they provide actionable insights for both bullish and bearish scenarios.
How Rays Work in Practice
Fibonacci Rays : Built from the inception of a price movement, these rays define the potential movement boundaries and key zones of interaction.
Dynamic Support and Resistance : Moving Averages such as MA50 ($0.14429), MA100 ($0.14601), and MA200 ($0.15353) act as dynamic factors, confirming trend direction and interaction points with the rays.
Adaptive Levels : Rays adjust with new patterns, ensuring relevance even as trends evolve. Price movement from one ray to the next defines key trade targets.
Entry Points : Enter trades only after price interaction with a ray and confirmation of a move’s direction. This reduces noise and increases precision.
Trading Scenarios
Optimistic Scenario
In this scenario, bullish momentum dominates after price interacts with ascending rays and key Moving Averages.
Entry: On a breakout above $0.14601 (MA100).
First Target: $0.15543 (first ray-resistance interaction).
Second Target: $0.16423 (next ray level).
Third Target: $0.17641 (extension target).
Rationale: Ascending rays combined with bullish MA crossovers indicate strength, and the price is likely to travel from one ray to the next before pausing.
Pessimistic Scenario
If bearish factors take over, the price is expected to interact with descending rays, forming resistance and initiating a move downward.
Entry: On a breakdown below $0.14429 (MA50).
First Target: $0.14009 (first ray-support interaction).
Second Target: $0.13301 (deeper ray support).
Third Target: $0.11096 (extension to powerful ray resistance).
Rationale: Interaction with descending rays and Moving Averages confirms the bearish continuation, with prices likely moving systematically through descending ray levels.
Proposed Trades
Breakout Trade: Enter above $0.14601 with targets $0.15543, $0.16423, and $0.17641.
Comment: Watch for a strong bullish MA cross and ray interaction for confirmation.
Pullback Trade: Enter on rejection near $0.14429 with targets $0.14009 and $0.13301.
Comment: Ensure interaction with descending rays to validate bearish momentum.
Trend Continuation: Enter on sustained movement within ray boundaries, aiming for the next ray level in sequence.
Comment: Use VSA and price-volume signals for additional confirmation.
In both scenarios, patience and adherence to ray interactions are crucial. These dynamic zones act as guides, helping traders navigate from ray to ray with calculated precision.
Let’s Keep the Conversation Going!
Hey, traders! If you’ve got any questions or thoughts, drop them right in the comments—I’d love to hear from you. Whether it’s about this analysis or another asset you’d like to see marked up, I’m here to help. Your feedback and ideas keep the trading community sharp!
If you found this roadmap useful, don’t forget to hit that Boost button and save this post. Come back later to see how the price respects the levels and rays in the markup. This isn’t just a forecast; it’s an opportunity to learn how key zones define trading opportunities.
By the way, the rays and levels you see here are drawn automatically using my private indicator-strategy. If you’re interested in exploring it for your own trades, feel free to reach out via direct message—I’ll share the details on how it works.
Need analysis for a specific asset? I’ve got you covered. Let me know in the comments or DMs. Some ideas I can publish publicly for everyone to benefit, and if you prefer a personal breakdown, we can arrange that too. Rays work on any asset, and I can tailor them to your needs.
Make sure to follow me here on TradingView to stay updated. This is where I post all my articles, ideas, and insights to keep you ahead in the market. Let’s build better trades together!
ETC On Vital Trendline Retracement !Ethereum Classic (ETC/USDT) is showing promising signs of bullish momentum following its breakout from a descending triangle formation. The price is currently consolidating above the trendline, indicating that the breakout level is holding as a strong support. This consolidation phase often precedes the next leg of a price movement, as the market builds strength for a potential continuation.
At the current price of $27, Ethereum Classic appears to be in a retesting phase. This is a critical moment where the price tests the breakout level to confirm it as support. Successfully holding this level would reinforce the validity of the breakout and provide confidence for further upward movement.
A significant factor to watch here is volume. A notable spike in trading volume would signal strong buying pressure, which could drive the price higher. If this occurs, the next resistance to overcome lies around $31, and surpassing that could lead ETC toward the $35 to $40 range, based on historical price action and the measured move from the triangle breakout.
If the price fails to maintain support above the $25.50-$27 range, it could lead to a deeper pullback, invalidating the bullish scenario. This makes the current consolidation phase a crucial moment for traders to watch.
Ethereum Classic is positioned for a potential upward move, provided it holds above the trendline and volume supports the breakout. Patience and vigilance are key as the market awaits a decisive push.

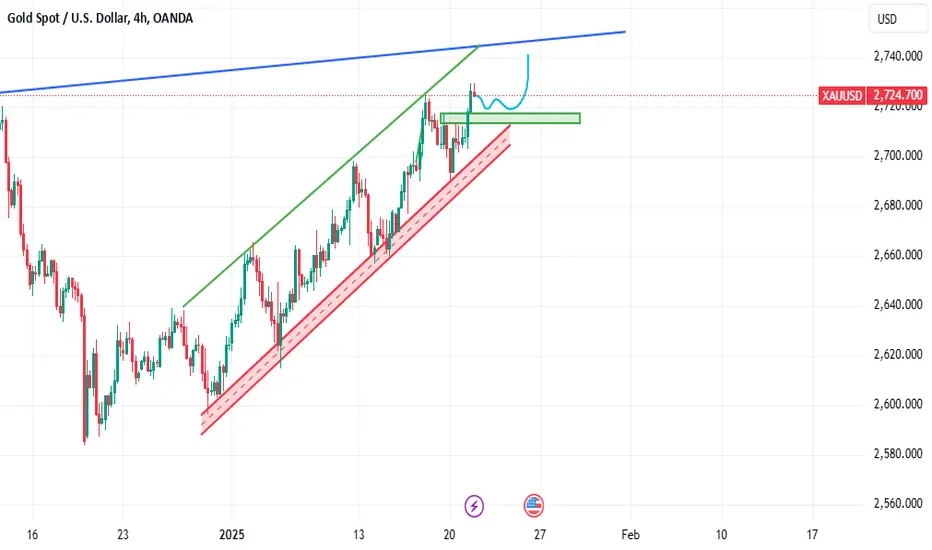
Scenario on XAUUSD 23.1.2025 [update]This analysis will only be about adjusting the level from the previous analysis, because my longivy setup turned out better than I expected, but now the question is what will happen next, I personally would like the scenario as I displayed it with sfp above high and then a proper correction to lower levels is important sr the level is at the price of 2730, if the market holds it then there could be a movement of gold to a new ath, but if this level were to break, my scenario would be fulfilled

XMR/USDT NEW VOLUMEXMR/USDT NEW VOLUME
It is able to show new uptrend volume in the coming time on day trade.

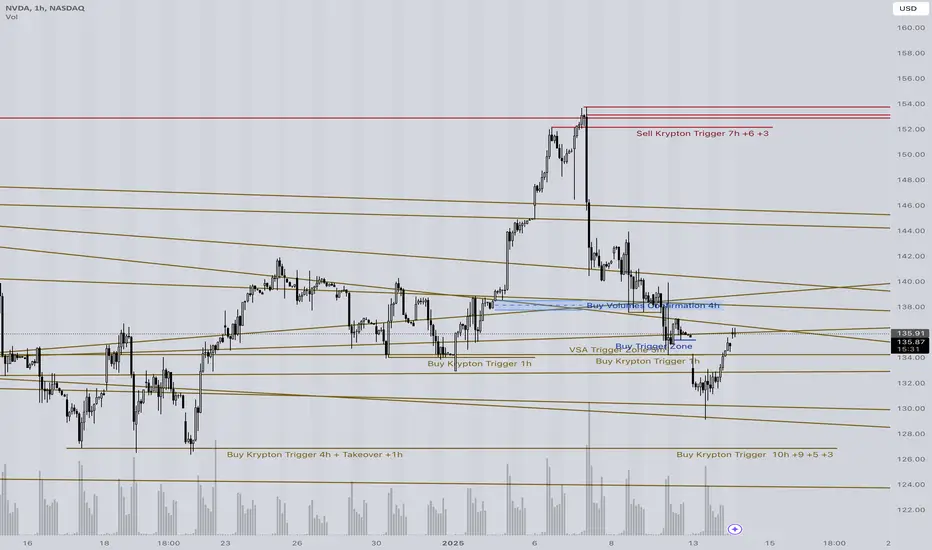
Nvidia. Analysis and Price Forecast: A Strategic OutlookIntroduction:
Nvidia Inc. (NASDAQ: NVDA) continues to be at the forefront of the AI and semiconductor revolution, showcasing robust innovation and a compelling business model. This analysis leverages advanced tools such as TheWaved™ and utilizes VSA Analysis, Technical Indicators, Price Action, and Fundamental Analysis to craft a comprehensive forecast.
Recent Price Movements and Key Patterns:
1. Candle Pattern Analysis:
From the provided patterns sequence data:
January 13, 2025, 14:00:
Pattern: "Increased Buy Volumes"
Movement: +6.69% from open to close, suggesting strong buyer activity and market confidence.
January 10, 2025, 16:00:
Pattern: "Buy Volumes Take Over"
Movement: -5.7%, indicating potential sell-offs after profit-taking.
These patterns highlight the recent tug-of-war between buyers and sellers, creating opportunities for strategic entries and exits.
2. Key Levels and Trend Analysis:
From technicals:
Current Price: $135.19
Resistance Levels:
Short-Term: $139.48 (MA200 on the hourly chart)
Mid-Term: $141.15 (MA100)
Support Levels:
Immediate: $127.30
Key Support Zone: $123.69-$127.30
Nvidia's price is trading below critical moving averages (e.g., MA50 and MA200), suggesting a potential rebound or consolidation phase before further directional movement.
Multi-Dimensional Analysis:
1. Volume Spread Analysis (VSA):
Analysis: Strong buy patterns are evident, with significant volume upticks near critical support zones. This implies institutional interest in accumulation phases.
Prediction: Anticipate continuation of buying pressure if price stabilizes above $135. Resistance at $140 may pose challenges in the short term.
2. Fundamental Insights:
Nvidia’s Q4 earnings report showed record revenue driven by AI GPU demand.
Major customers in cloud computing and automotive industries continue to bolster growth.
However, rising interest rates and potential geopolitical risks (e.g., China’s tech policies) might pressure valuations.
3. Price Action Analysis:
Recent bullish engulfing candles near $127 indicate buyer confidence.
Price may revisit $130 before testing $140. Breaking $140 could pave the way to retest $150 (January’s absolute high).
Projections:
Short-Term (1 Week):
Target: $138.50
Stop-Loss: $132.00
Rationale: A breakout above MA50 ($136.93) will signal short-term bullish momentum.
Mid-Term (1 Month):
Target: $145.00
Stop-Loss: $130.00
Rationale: Stabilization above $140 supported by institutional buying and potential macroeconomic support.
Long-Term (3-6 Months):
Target: $160.00
Stop-Loss: $125.00
Rationale: Continued demand for Nvidia’s GPUs in AI and automotive applications combined with broader tech sector recovery.
Strategic Recommendations:
Support Levels:
-
1. 127.3
2. 123.69
3. 113.9
4. 90.4855
5. 87.88
Resistance Levels:
-
1. 127.3
2. 123.69
3. 113.9
4. 90.4855
5. 87.88
Powerful Support Levels:
-
Powerful Resistance Levels:
-
1. 89.599
2. 89.599
3. 63.974
4. 63.974
5. 48.462
Above $160: Consider reducing positions to hedge against potential market corrections.
3. Stop-Loss & Risk Management:
Strict stop-loss at $130 for short-term trades.
Trail stops to lock profits as price moves favorably.
Tools and Insights:
Analysis powered by TheWaved™, leveraging decades of professional experience and cutting-edge analytics. Key insights have been shared to align with both retail and institutional perspectives.
Call to Action:
For personalized queries or deeper insights into Nvidia’s price action, feel free to reach out via direct message. Explore our tools and indicators through the link in our profile.
Concept of Rays
Explanation of the "Rays from the Beginning of Movement" Concept
Core Idea
My proprietary analysis method is based on using rays constructed on Fibonacci mathematical and geometric principles. These rays create a system of dynamic levels that help predict precise asset movements and identify key zones where price interactions occur. Price interaction with these rays signals probable scenarios: either a reversal or a continuation of movement, but only after interaction and the appearance of dynamic factors and patterns.
Why Predicting Specific Levels is Not Possible
Financial markets are nonlinear systems, where price movement is determined by numerous variables, including market volumes, liquidity, macroeconomic factors, and participant psychology. Instead of attempting to predict specific levels, I propose analyzing probabilities of price reaction at pre-calculated key zones. Price interaction with rays provides additional insights into the direction and strength of movement.
Disclaimer: This analysis reflects the author’s perspective based on available data and does not constitute financial advice. Trading involves risks; ensure proper due diligence.
Follow TheWaved for more actionable insights!
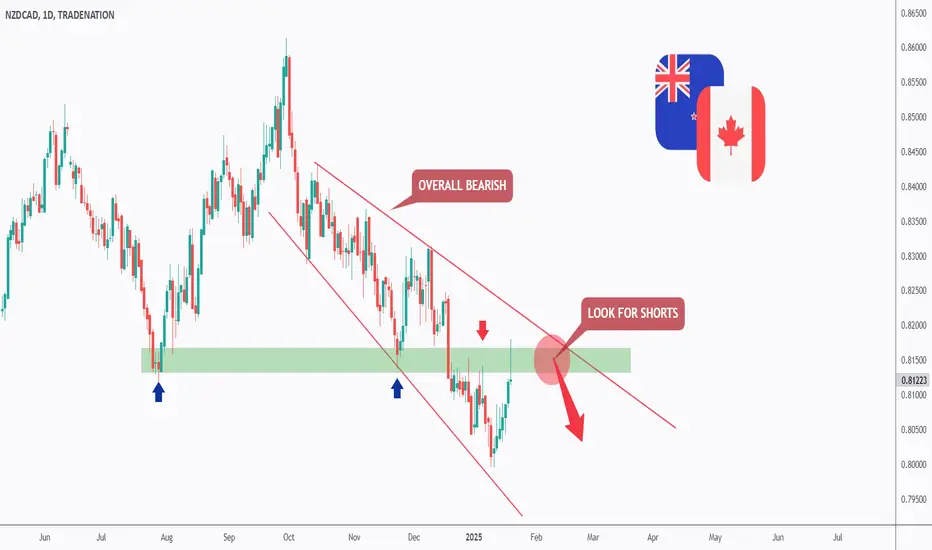
NZDCAD - Follow the Bears!Hello TradingView Family / Fellow Traders. This is Richard, also known as theSignalyst.
📈NZDCAD has been bearish trading within the falling wedge pattern in red.
Currently, NZDCAD is approaching the upper bound of the wedge.
Moreover, the green zone is a strong structure.
🏹 Thus, the highlighted red circle is a strong area to look for sell setups as it is the intersection of the green structure and upper red trendline.
📚 As per my trading style:
As #NZDCAD is around the red circle zone, I will be looking for bearish reversal setups (like a double top pattern, trendline break , and so on...)
📚 Always follow your trading plan regarding entry, risk management, and trade management.
Good luck!
All Strategies Are Good; If Managed Properly!
~Rich
Buy on XAU Gold has been in a strong uptrend, and I believe the following scenario might play out: a correction down to the green zone, followed by a move toward the blue line.
USDCHF - Reversal Soon!Hello TradingView Family / Fellow Traders. This is Richard, also known as theSignalyst.
📈 USDCHF has been bullish trading within the rising channel in orange.
Currently, USDCHF is approaching the upper bound of the channel.
Moreover, the blue zone is a strong resistance.
🏹 Thus, the highlighted red circle is a strong area to look for sell setups as it is the intersection of the blue resistance and upper orange trendline.
📚 As per my trading style:
As #USDCHF is around the red circle zone, I will be looking for bearish reversal setups (like a double top pattern, trendline break , and so on...)
📚 Always follow your trading plan regarding entry, risk management, and trade management.
Good luck!
All Strategies Are Good; If Managed Properly!
~Rich

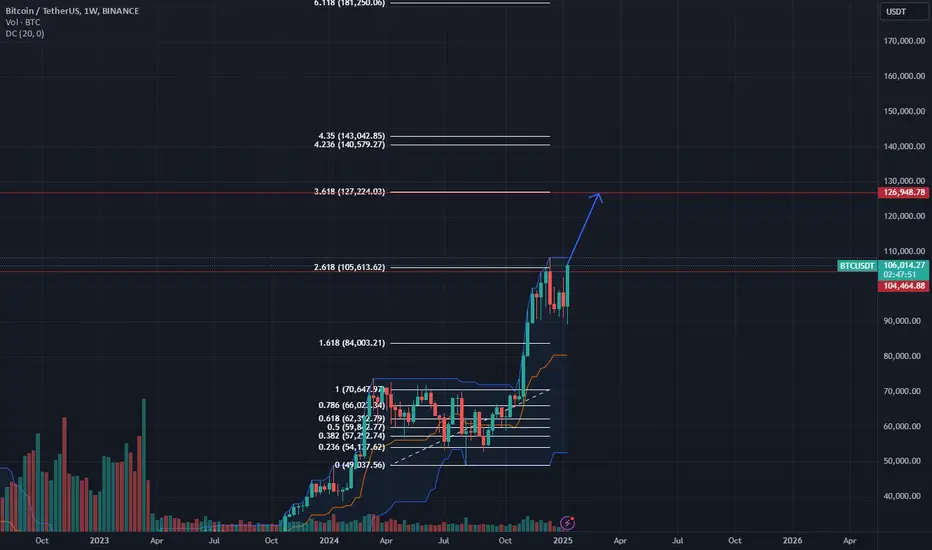
Bitcoin - New All time high incomingAs you can see, Bitcoin is about to close a weekly candle over the previous VSA resistance. $TRUMP token has also pushed bullish narrative onto public therefore I think that this correction is over.
Next stop is around 127k and after that we should reconsider whether there will be continuation or that's it.
TRUMP - High volatility, no highs to be seen - yetIt looks as though the TRUMP coin is trading within a range. Lots of chop, but no clear sign of a breakout to the up or downside. The recent red candle shows an 85% correction in one day. That's hugely impressive and will low liquididy this 'meme' coin could also fall off a cliff to the same degree. Sorry but there's too much at risk here, especially being connected to geo-political events and instability. Either way, it looks to be bouncing off the bumbers for now in a succinct WXYXZ fashion. Either trend line breach will signal a higher high or lower low. Follow and share for more.

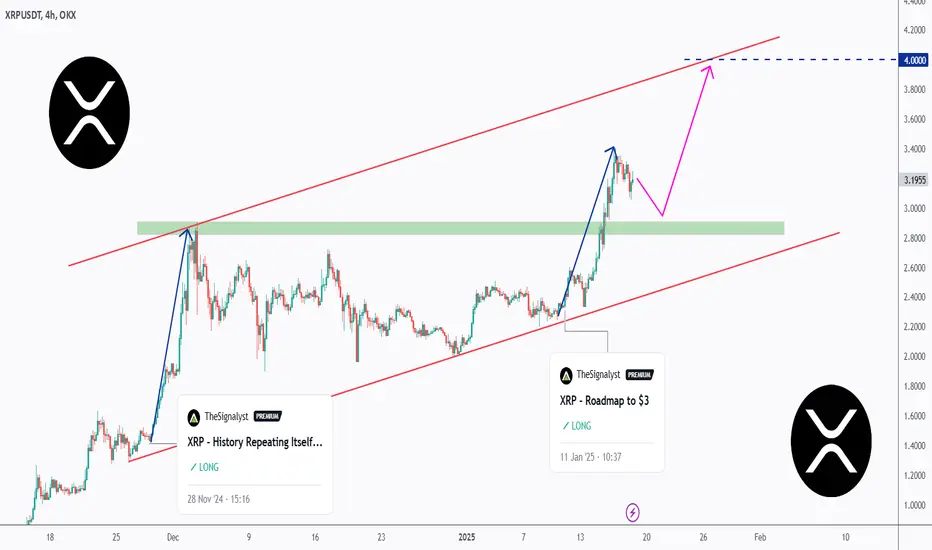
XRP - Next Target => $4Hello TradingView Family / Fellow Traders. This is Richard, also known as theSignalyst.
📌 According to our last analysis (attached on the chart), XRP has reached our $3 target.
What’s next?
🏹As long as the all-time structure marked in green and the $3 round number hold, the bulls will remain in control, potentially pushing towards the upper bound of the red channel around $4.
📚 Always follow your trading plan regarding entry, risk management, and trade management.
Good luck!
All Strategies Are Good; If Managed Properly!
~Rich
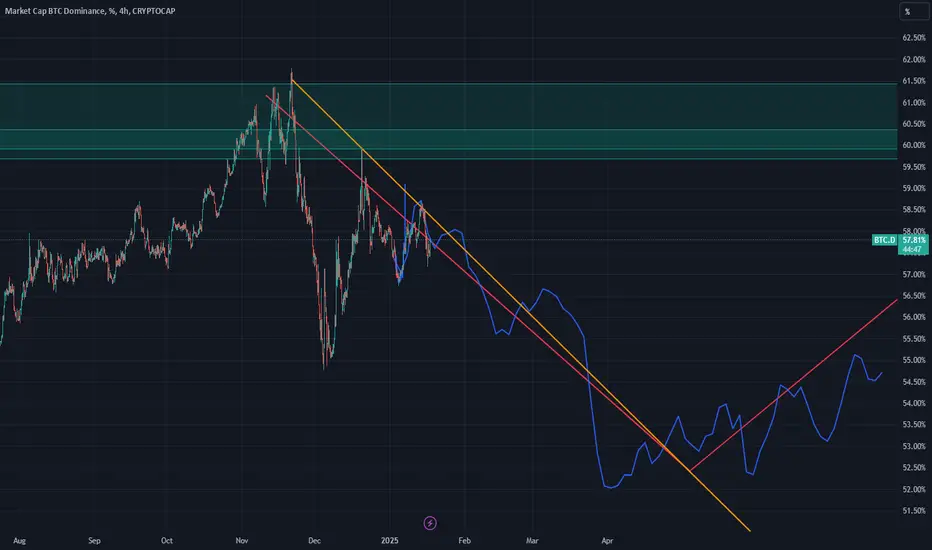
BTC.D G.O.O.D BYEnothing new and the Dominance of Bitcoin Gonna fall
but that's fine bcz for now D is fall but price is rise = market Bull
SOL/USDT: Are We Gearing Up for a Big Move?Take a step back and look at the big picture for SOL/USDT. There's a long-term head and shoulders pattern forming that could redefine where Solana is headed. Pair that with the Hurst cycles, and we have a cocktail of signals that just… works.
If this plays out, we might see a week-long breach of the upper trend line in the next 18 months—a move that would confirm higher highs are on the horizon.
This is the kind of setup that rewards patience. Do you see it breaking out, or is this just wishful thinking? Follow and share your thoughts below—let’s see how this one plays out. 🚀
