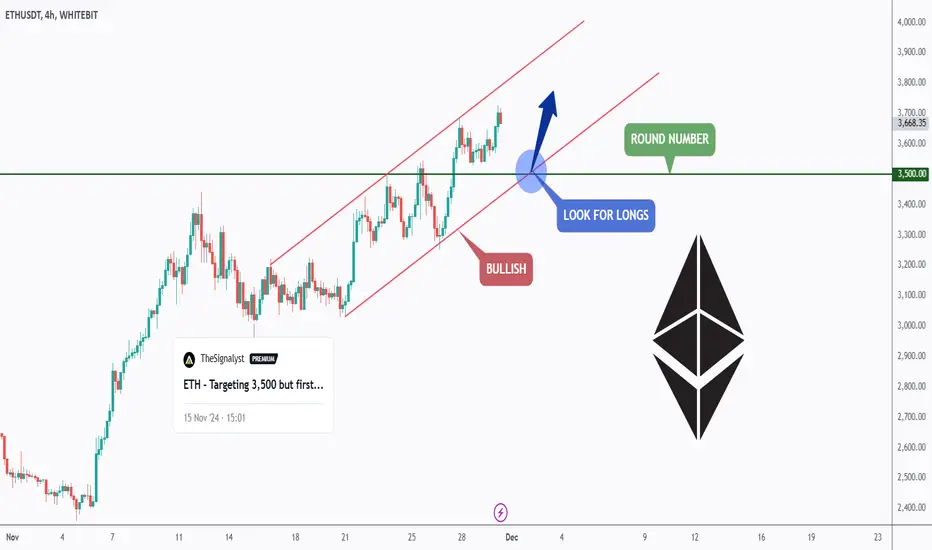
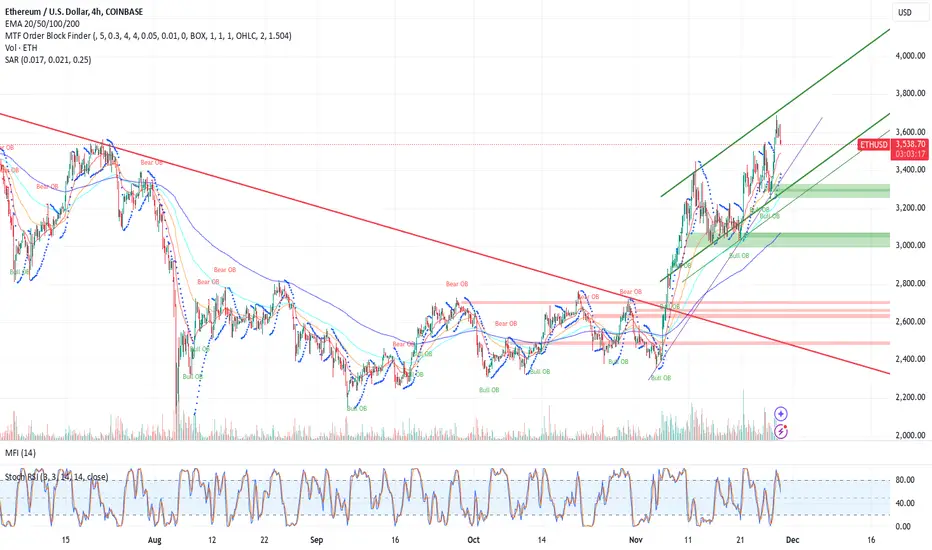
ETH - Trend-Following Long!Hello TradingView Family / Fellow Traders. This is Richard, also known as theSignalyst.
📈ETH has been bullish trading within the rising channel in red.
Currently, ETH is approaching the lower bound of the channel.
Moreover, the level marked in green is a strong round number $3,500.
🏹 Thus, the highlighted blue circle is a strong area to look for buy setups as it is the intersection of the round number and lower trendline acting as non-horizontal support.
📚 As per my trading style:
As #ETH approaches the blue circle, I will be looking for bullish reversal setups (like a double bottom pattern, trendline break , and so on...)
📚 Always follow your trading plan regarding entry, risk management, and trade management.
Good luck!
All Strategies Are Good; If Managed Properly!
~Rich
Trend
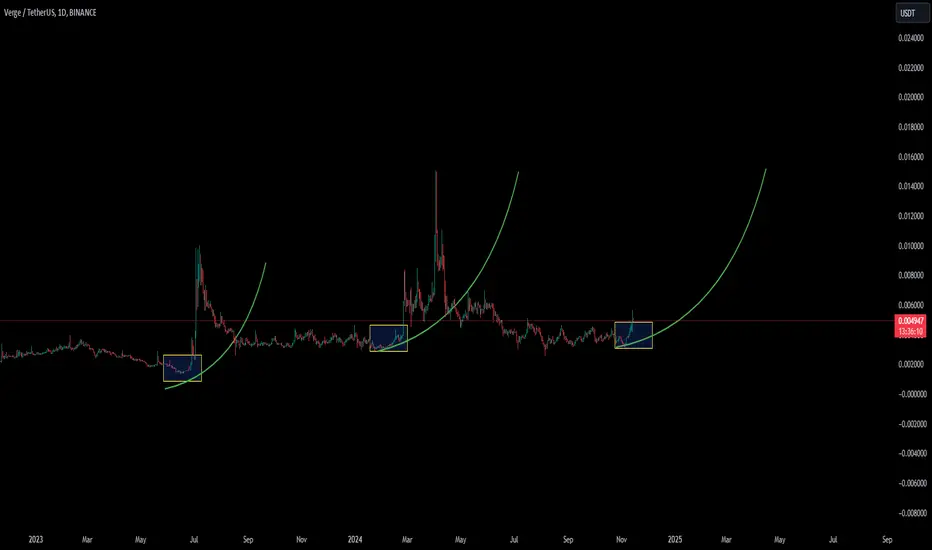
XVG NEW RUN ON WAY..Is verge(XVG) starting for a new cycle..
XVG looks to have new data that can get confirmed into a new break.
It is interesting to watch out for XVG in the coming time for a new run.
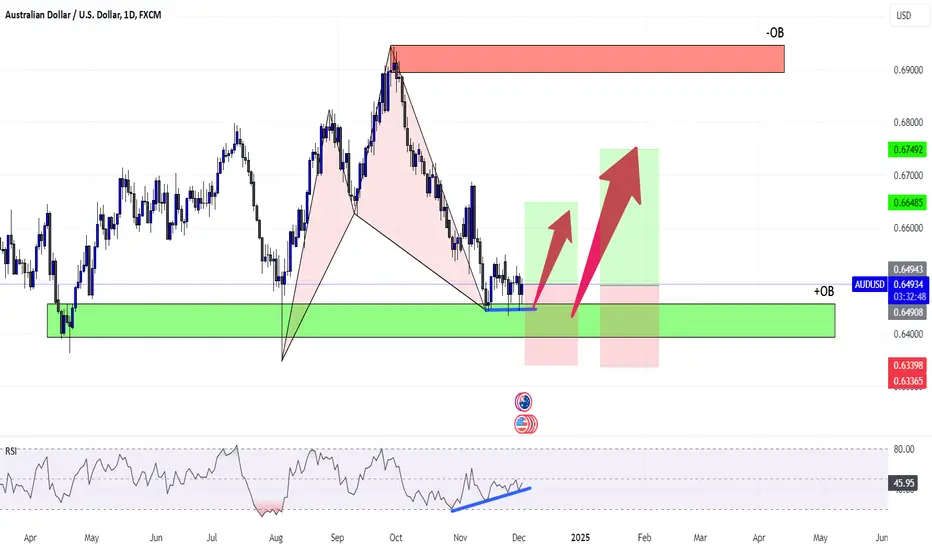
AUD-USD | 1 Day | Swing Trading Hello traders, I prepared FX:AUDUSD analysis for you. In my analysis, I detected the patterns on the chart, I would be very happy if you press the like button, thank you.
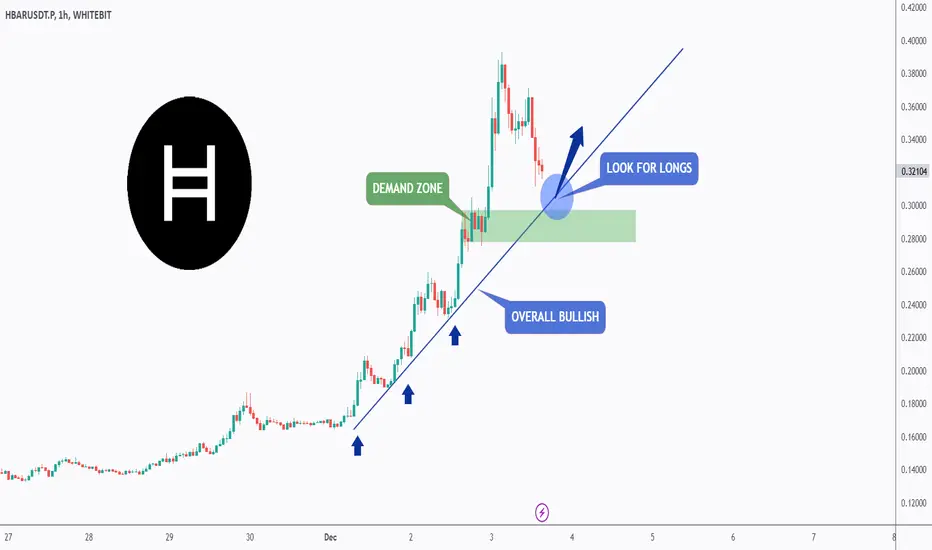
HBAR - Riding The Beast!Hello TradingView Family / Fellow Traders. This is Richard, also known as theSignalyst.
📈After breaking above the $0.1 mark, HBAR surged by almost 400%.
Currently, HBAR is in a minor correction phase.
Moreover, the green zone is a strong demand.
🏹 Thus, the highlighted blue circle is a strong area to look for buy setups as it is the intersection of the demand zone and blue trendline acting as non-horizontal support.
📚 As per my trading style:
As #HBAR approaches the blue circle, I will be looking for bullish reversal setups (like a double bottom pattern, trendline break , and so on...)
📚 Always follow your trading plan regarding entry, risk management, and trade management.
Good luck!
All Strategies Are Good; If Managed Properly!
~Rich
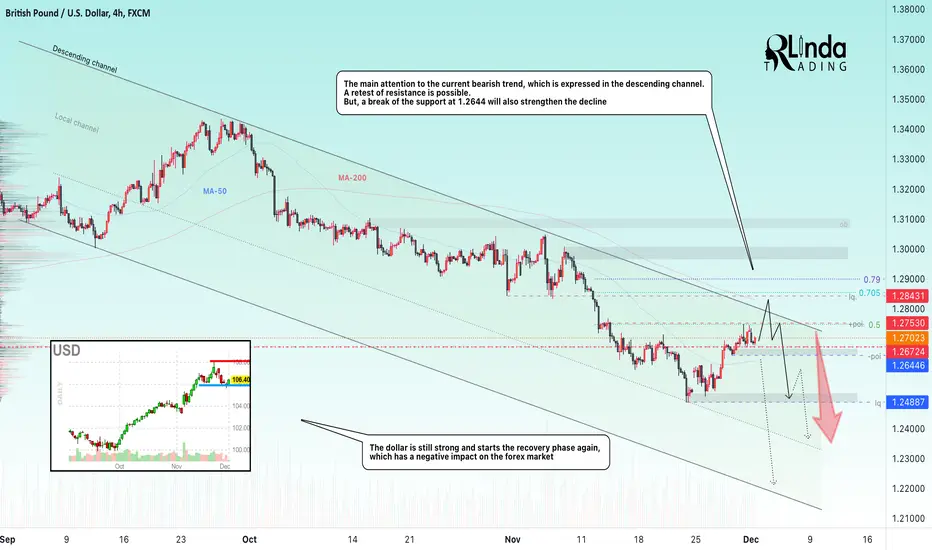
GBPUSD → Counter-trend correction before further declineFX:GBPUSD within the correction reaches a zone of interest and resistance from which the decline may resume as the dollar returns to a northbound rut ...
Traders continue to fight for the 1.267 area, an area that is a strong enough support. Buyers don't have much of a chance as the dollar looks quite strong on the back of Trump's policies and is putting quite a lot of pressure on the forex market.
Technically, the downtrend is the priority and we will be pulling back from it. Key zones: 0.5 Fibo and the boundary of the downtrend. False breakout may provoke further decline.
Resistance levels: 1.275, 1.284
Support levels: 1.267, 1.264
False breakout of resistance will indicate the bears' domning and may provoke further selling. It is also worth emphasizing 1.267-1.264. A breakdown and consolidation of the price below this zone will also confirm the bears' intention
Rate, share your opinion and questions, let's discuss what's going on with ★ FX:GBPUSD ;)
Regards R. Linda!
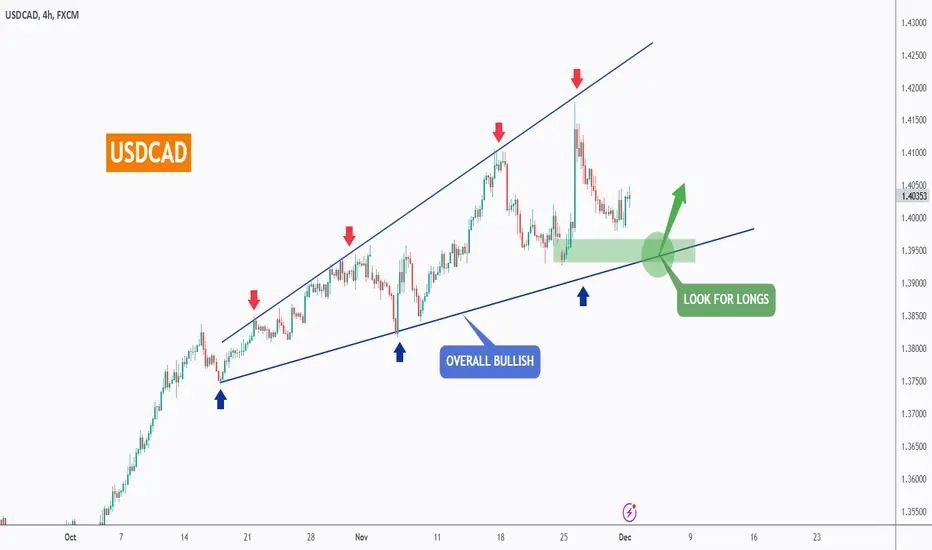
USDCAD - Follow the Bulls!Hello TradingView Family / Fellow Traders. This is Richard, also known as theSignalyst.
📈USDCAD has been bullish trading within the rising wedge pattern in blue.
Currently, USDCAD is approaching the lower bound of the wedge.
Moreover, the zone marked in green is a strong demand.
🏹 Thus, the highlighted green circle is a strong area to look for buy setups as it is the intersection of the demand zone and lower trendline acting as non-horizontal support.
📚 As per my trading style:
As #USDCAD approaches the green circle, I will be looking for bullish reversal setups (like a double bottom pattern, trendline break , and so on...)
📚 Always follow your trading plan regarding entry, risk management, and trade management.
Good luck!
All Strategies Are Good; If Managed Properly!
~Rich
GBPAUD - Follow The Trend!Hello TradingView Family / Fellow Traders. This is Richard, also known as theSignalyst.
📈GBPAUD has been bullish trading within the rising channel in blue.
Currently, GBPAUD is approaching the lower bound of the channel.
Moreover, the zone marked in green is a strong structure.
🏹 Thus, the highlighted blue circle is a strong area to look for buy setups as it is the intersection of the structure zone and lower trendline acting as non-horizontal support.
📚 As per my trading style:
As #GBPAUD approaches the blue circle, I will be looking for bullish reversal setups (like a double bottom pattern, trendline break , and so on...)
📚 Always follow your trading plan regarding entry, risk management, and trade management.
Good luck!
All Strategies Are Good; If Managed Properly!
~Rich

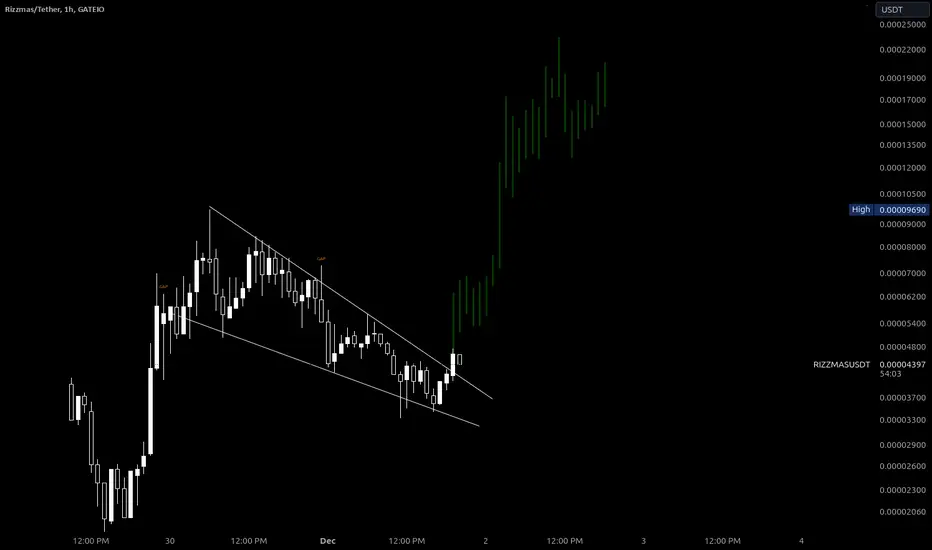
RIZZMAS... next SHIB!???Five key points explaining why it might be worth considering:
High Token Supply: With 500 billion tokens in circulation, Rizzmas ensures significant market liquidity, making it accessible for trades
Recovery from Historic Lows: While the token has fallen 75% from its all-time high, it has rebounded by 170% from its lowest price, indicating a potential recovery trend
Low Entry Price: With an average price of $0.000046 per token, it offers an affordable entry point, allowing smaller investors to accumulate a significant quantity of tokens
Popularity of Meme Coins: Like Dogecoin and Shiba Inu, Rizzmas is part of the meme coin category. Such coins can exhibit high volatility but often capture significant attention and trading volume during their peaks
Availability Across Platforms: Rizzmas is available on both decentralized exchanges like Raydium and centralized exchanges like Gate.io, providing accessibility for a wide range of traders
For me, it looks like high risk. Use your risk management.
JB.-
BTCUSD Breakout Alert: Head and Shoulders Pattern Targets $108K!Bitcoin is showing a textbook Head and Shoulders breakout, with a potential move above the neckline (dotted line). The projected target for this bullish structure points toward $108,000, marking a significant continuation of the long-term uptrend.
Entry Idea: On retest of the neckline or consolidation above the breakout zone.
Stop-Loss: Below the right shoulder for risk management.
Take-Profit Target: $108K, in line with the projected breakout target.
Keep an eye on volume too.
Disclaimer: This is not financial advice. Conduct your own analysis and manage risk accordingly.
Follow for more.

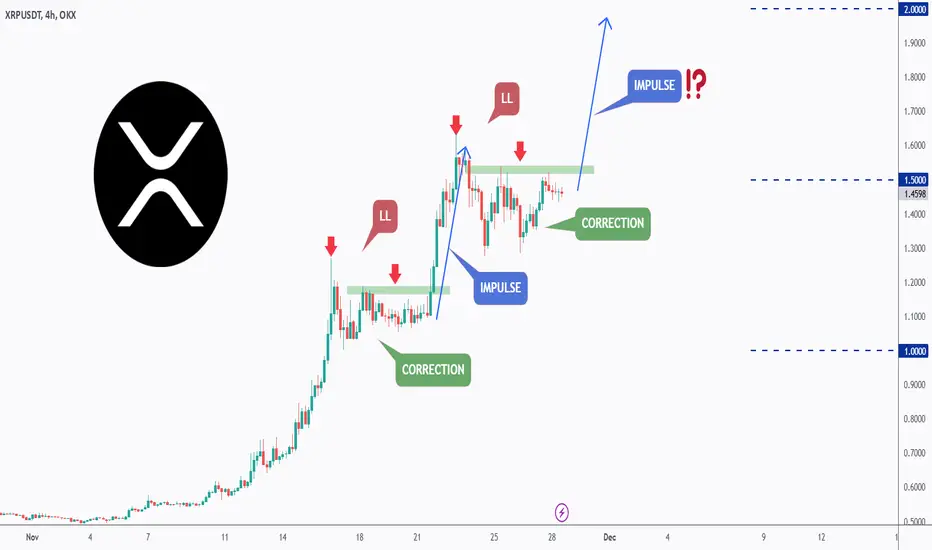
XRP - History Repeating Itself...Hello TradingView Family / Fellow Traders. This is Richard, also known as theSignalyst.
📔I find the BINANCE:XRPUSDT 4H chart interesting.
Do you notice a pattern here?
Take a look at the first two red arrows.
📊Mid-November, XRP made a lower low (red arrows), got stuck within a range (green zone), and finally broke above the green zone to start its bullish impulse.
Currently, XRP seems to be forming a similar pattern.
🔄 If history repeats itself, a break above the green zone around $1.53 is needed to signal the start of the next bullish movement.
🎯Once the setup is activated, I will target the $2 mark!
📚 Always follow your trading plan regarding entry, risk management, and trade management.
Good luck!
All Strategies Are Good; If Managed Properly!
~Rich
BOBA/USDT 100% POSSIBLITY BREAKBOBS/USDT Analysis: Potential Break Ahead
BOBA iTHE new omisego.
A good coin takes small steps and holds levels.
The BOBA/USDT pair is showing an intriguing setup, which a new break zone could confirm. We will closely monitor the market for any signs of confirmation regarding this coin's movement.
If this coin manages to rise from the current zone, it could initiate a new upward cycle.
The most promising scenario is a 100% increase which can go with time. However, it’s important to note that this may take time, as there are no guarantees in the crypto market. Additionally, much will depend on further data confirmations.
If BOBA achieves a break soon the price could potentially target the $0.45 –$0.62 range.
This coin has many levels as open space which can have a break to old levels.
Don't expect fast results, the market is going on its way.

ETH breakout, short term pullback, long term runThere was more than 6 months of pullback for ETH but there was a clear descending resistance for the last 6 months, every time ETH hit it, it pulled back. We had a double tap and failure to penetrate in October and early November and then 24.Nov we broke through resistance and started to run. This still seems to be early on in the run. We have seen days where ETH outperformed BTC and in fact we are trying to break down the support for BTC Dominance. You can see its clear trend up and how we are testing that support line now. If it breaks down we will likely see ETH run and the stage may be set for a flippening.
I think more likely is that support holds and BTC dominance will start to rise again around this point.
BTC Dominance:
There are many reasons BTC dominance will run but one that is common is that BTC pulls back and the rest of the market pulls back a lot harder. If BTC loses 5% a lot of alts will lose 20% often. Another way BTC dominance runs is if it breaks out and runs for big gains, already having a near a $2T marketcap now, a 5% run would add $100B of market cap for BTC.
BTC tried to break out and it rejected, there is a possiblity that we could trace this all the way back to $68-$70k here depending on the speed of descent. Also though, BTC has been strong and bullish, there is very much a chance that we consolidate and build up here and break out, so this line is really significant, its probably the difference on whether BTC dominance runs because of BTC pulling back or running hard.
BTC Chart:
ETH on the other hand, looks like it has broken out of recent multi-month resistance and seems to just be getting started, but this channel it has assumed is already showing us were we should see support and resistance as it continues to run. This looks like its early on in the breakout really but does look likely that we will pull back more here. If you see this price break top of channel, expect another run and if it breaks bottom of channel, be prepared for a noticeable pullback. In the meantime, as long as it is assuming the channel, it is ascending and bullish.
Keep an eye on BTC, we know if its not happy, generally the whole market suffers. Its hard to find profits on other assets while BTC is dumping so even if you are not trading BTC, you should be watching it.
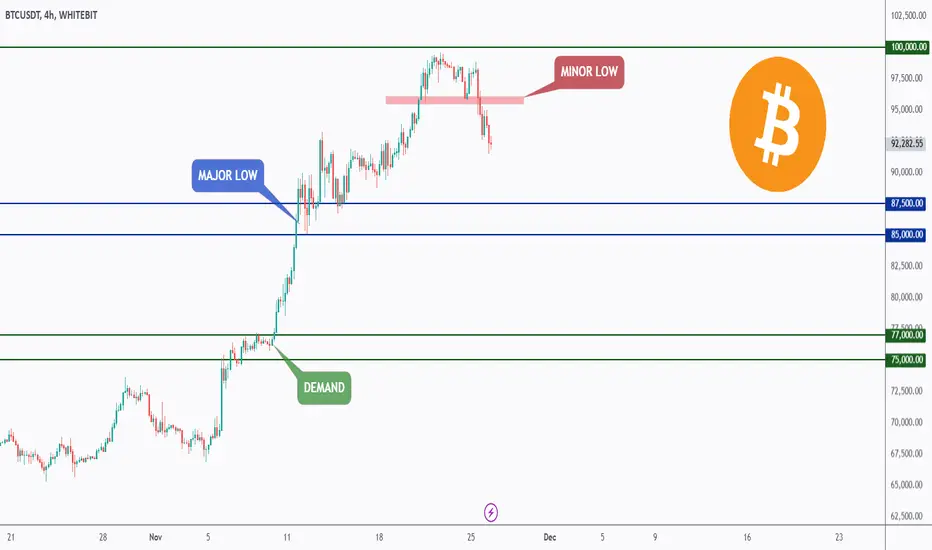
Structure broken! How much can BTC go?Hello TradingView Family / Fellow Traders. This is Richard, also known as theSignalyst.
📉 After breaking the minor low marked in red at $95,000, the bears have already taken over in the short term.
However, BTC will remain bullish in the medium term as long as the last major low in blue at $85,000 holds.
Thus, as BTC approaches the $85,000 zone, I will be looking for bullish reversal setups to form at the rejection.
If and only if $85,000 is broken downward, a bigger bearish correction towards the $75,000 demand zone would be expected.
Which scenario do you think is more likely to happen and why?
📚 Always follow your trading plan regarding entry, risk management, and trade management.
Good luck!
All Strategies Are Good; If Managed Properly!
~Rich
$BTC Analysis update: What's Next ?** CRYPTOCAP:BTC Analysis: What's Next?**
As you can see, CRYPTOCAP:BTC has completed its previous consolidation phase, which lasted six months. The recent *Trump election pump* coincided with the end of that phase, leading to a new, massive parabolic rally.
However, signs are emerging that the market is overheating:
- **RSI**: Indicates overbought conditions, suggesting a correction is due.
- **MACD**: Overheated and also signaling an impending correction.
On a **weekly timeframe**, history tells us that similar situations have resulted in sideways movement for about six months, with a 30–40% downside, before the next major rally begins.
---
### Will This Trigger an Altseason?
Most likely, yes. During these cooling-off periods, investors often turn their attention to altcoins, which tend to be more active and engaging during such times.
---
### MACD Insights
By counting the bars on the MACD, it looks like we might have **two more weeks of upward movement** before an EMA crossover signals the start of consolidation.
---
### Looking Ahead
The next major pump could occur around **May**. Let’s see how this unfolds.
**Remember:** Do Your Own Research (DYOR).

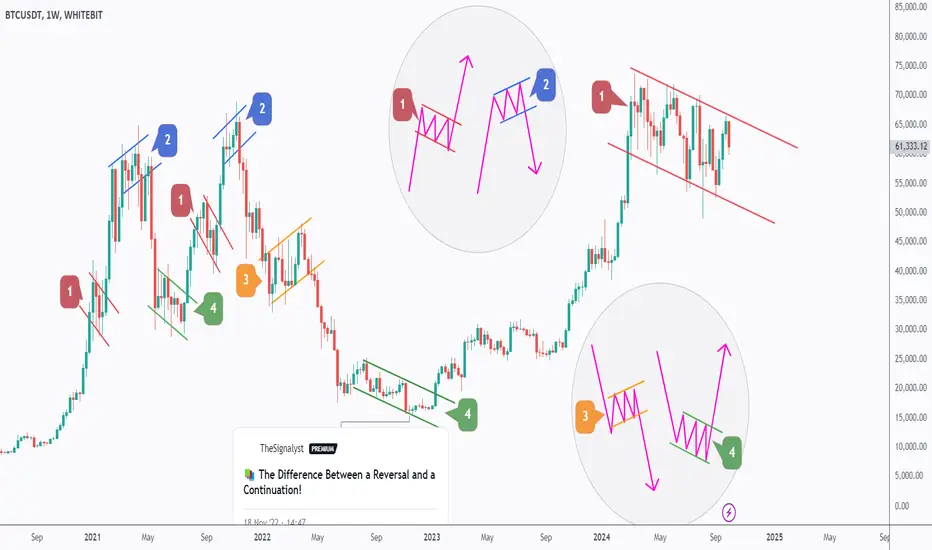
BTC - Thank Me Later!Hello TradingView Family / Fellow Traders. This is Richard.
🗒 Do you remember this post from 2023?
As mentioned back then, BTC was forming Pattern 4, which was activated after breaking above the falling green channel, leading to a surge of over 200%.
So, according to the educational post, where are we now⁉️
🔑A falling correction after a bullish impulse signals what?
That’s right — we are now in the process of forming Pattern 1.
For this pattern to be activated and the bullish continuation phase to begin, we need a weekly candle close above $70,000.
Of course, in the meantime, as long as BTC is trading within the falling channel, it can still retest the lower bound before activating the phase.
❗️N.B. Always remember, nothing moves in a straight line, so we might see a correction (in the form of a higher low) along the way.
📉 Which scenario do you think is more likely to happen, and why?
Always follow your trading plan regarding entry, risk management, and trade management.
Good luck!
🗒 All strategies are good, if managed properly!
~Rich
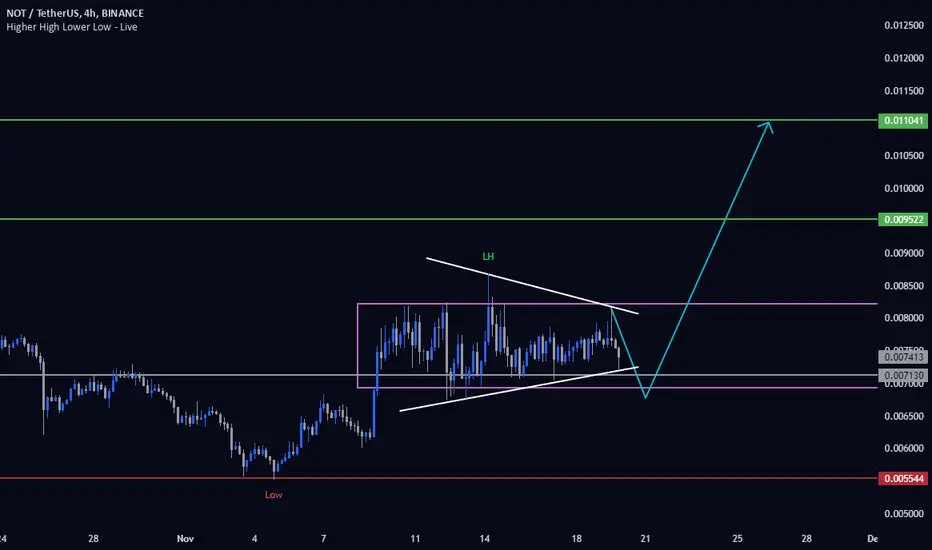
#NOT 4H. Symmetrical triangle and potential for growth. 11/20/24Looks solid. At the moment, the price has formed a "symmetrical triangle" pattern.
I expect a bit more sideways movement, followed by a breakout and an upward move. I believe the launch of new tap-to-earn tokens in November will drive growth across the entire Ton ecosystem.
From the current levels, I anticipate at least a 50% increase without leverage. You already know the mid-term targets for Notcoin. Well, these are my targets and my opinion—it's up to you to decide what to do with these thoughts.
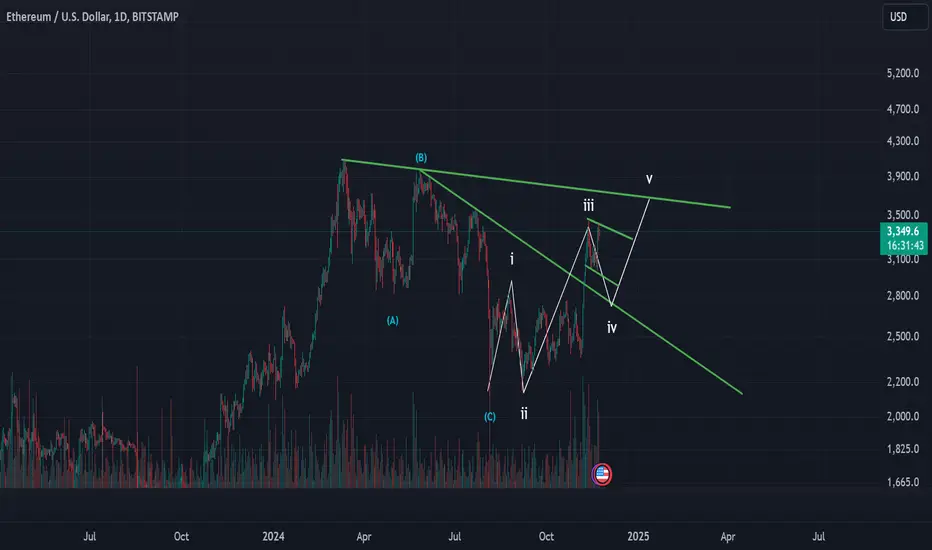
Not seeing a huge upside to ETHIt looks as though a recent correction for ABC is complete with a new impulse of 5 waves just commencing. Will the 5 waves break through the upper trend line in this impulse or will they correct as it they buffet the trend line down for another short ABC and then push through the trend line in the next set of 5 waves? We have some wonderful upward lunges of late with ETH, but I'm not seeing the size and scale that we're seeing with BTC. Going long, but not aggresively. Follow for more.
STELLAR and DOGECOIN_chartsThe similarity between Dogecoin's run up and the current trend of XLM is quite similar leading me to see the price of Stellar holding up to the position current on the chart, that is if the similarity between both charts is an example of what happens among many other theories on price and targets.

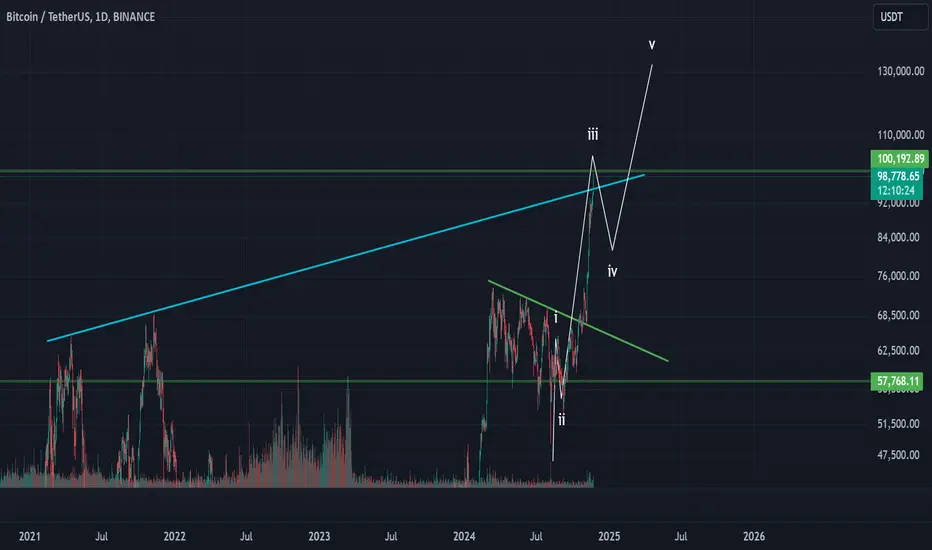
100k might start wave 4 of 5Hi all, what an exiting time to be part of crypto. BTC is putting in all time new highs almost daily at the moment, it's incredible to watch. This chart shows that hitting 100k might end the gorgeous wave 3 of 5 we've been having of late and plunge is into a wave 4. Not to worry, if this happens this will be a lovely buy dip as wave 5 will be owed at this point. Don't forget, this 1-5 impulse is only wave ONE of FIVE of a higher degree of trend so there's plenty more up to go as yet. Follow more more.
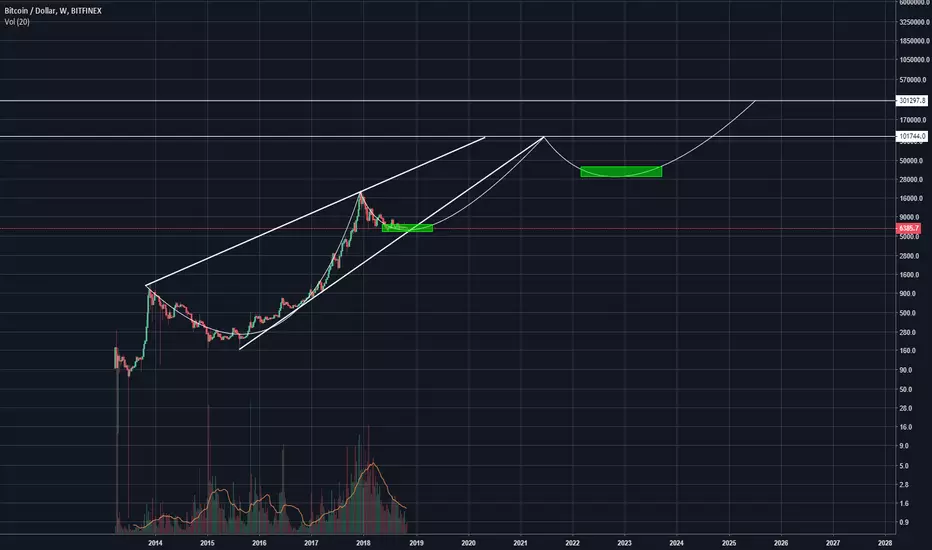
Bitcoin: $300k by 2025Long-term Bitcoin analysis using a logarithmic scale. As shown, Bitcoin remains in the long term trend lines set by the top and bottom of the 2014 bear market, if Bitcoin is to remain in these trend lines, it needs to start making an upwards move in early 2019. I have also drawn a few curves that Bitcoin could follow if it is to fall below the trend line.
My first price target is $100k which I expect to be met between mid 2020 and mid 2021. I then anticipate another 12-16 month bear market before finally resuming the bull market and heading towards $300k between 2025 and 2026; I have chosen $300k as that would put Bitcoin on a slightly smaller market cap than gold assuming that 20 million coins had been mined ($6 trillion).
Finally, I have indicated accumulation zones in green, currently between $5.7k and $7k, I expect to move out of this range within the coming few months. Then similarly in the 2022/2023 bear market I expect Bitcoin to fall 60-70% and accumulate between $30k and $40k range.
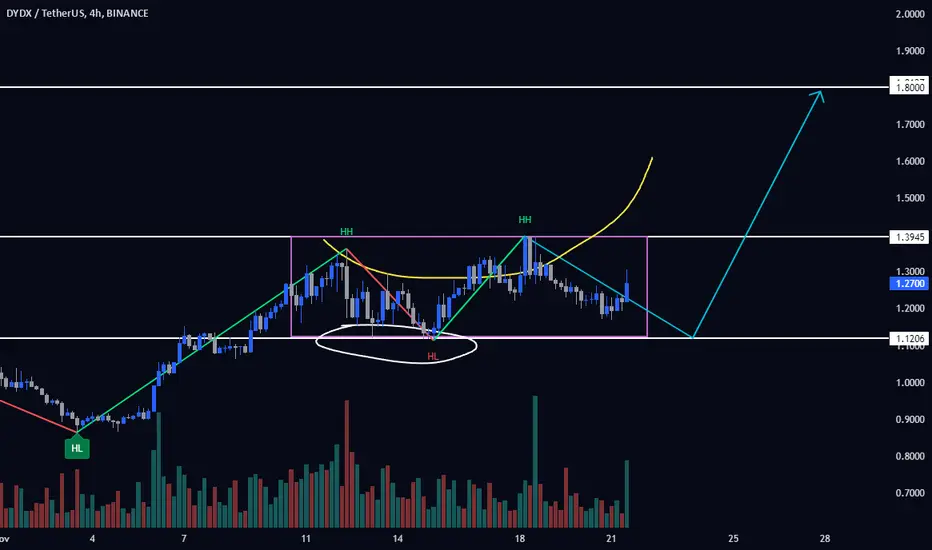
#DYDX 4H. X2 Potential. 11/21/24The coin is in a sideways trend and near the lower boundary. If not now, then when to enter a position? Personally, I can’t give advice, as the best opportunity was yesterday, and the second-best opportunity is today.
From the current levels to $0.9, it’s quite reasonable to accumulate on spot. The nearest target is $1.8. You can easily take at least 2x on spot.
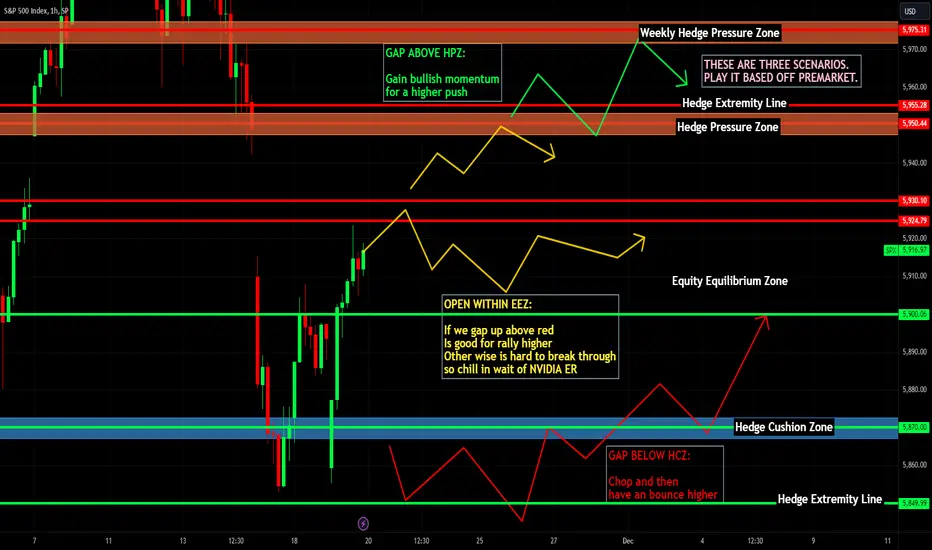
Nightly $SPX / $SPY Predictions for 11.20.2024🔮
⏰10:30am
Crude Oil Inventories
#trading #stock #stockmarket #today #daytrading #swingtrading #charting #investing
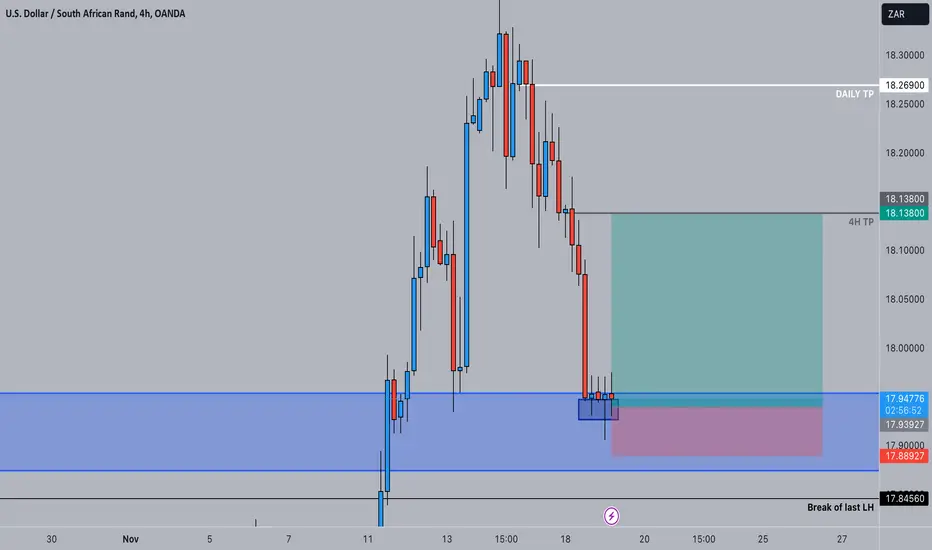
Trade idea - USDZAR Long4H
Deceleration box received at entry zone.
Instant market execution Buy.
1.5% risk.
Full profit at 4H TP.
Would be enough to complete prop firm challenge.