SOL - Trend-Following Longs in the making!Hello TradingView Family / Fellow Traders. This is Richard, also known as theSignalyst.
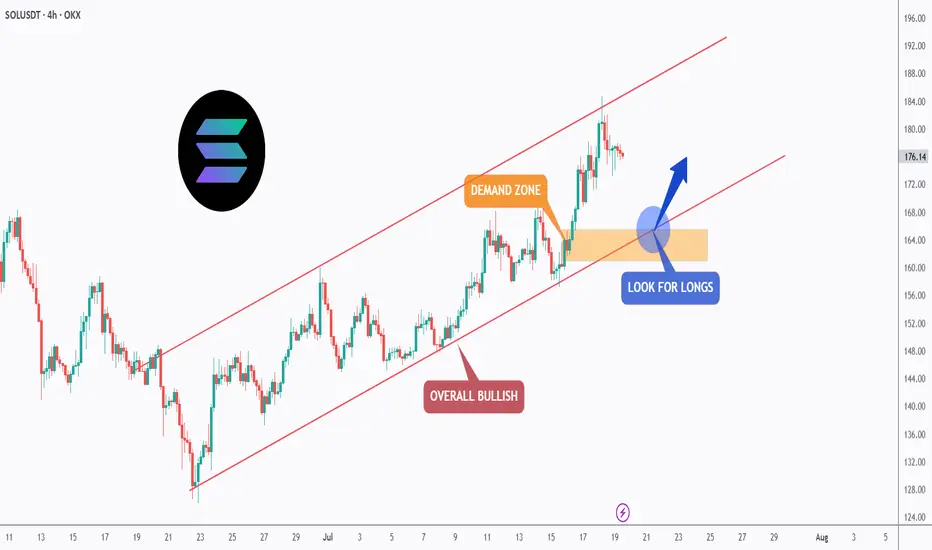
📈SOL has been overall bullish trading within the rising channel in red.
Moreover, the orange zone is a strong demand.
🏹 The highlighted blue circle is a strong area to look for buy setups as it is the intersection of the orange demand zone and lower red trendline acting as a non-horizontal support.
📚 As per my trading style:
As #SOL retests the blue circle zone, I will be looking for bullish reversal setups (like a double bottom pattern, trendline break , and so on...)
📚 Always follow your trading plan regarding entry, risk management, and trade management.
Good luck!
All Strategies Are Good; If Managed Properly!
~Richard Nasr
Trend
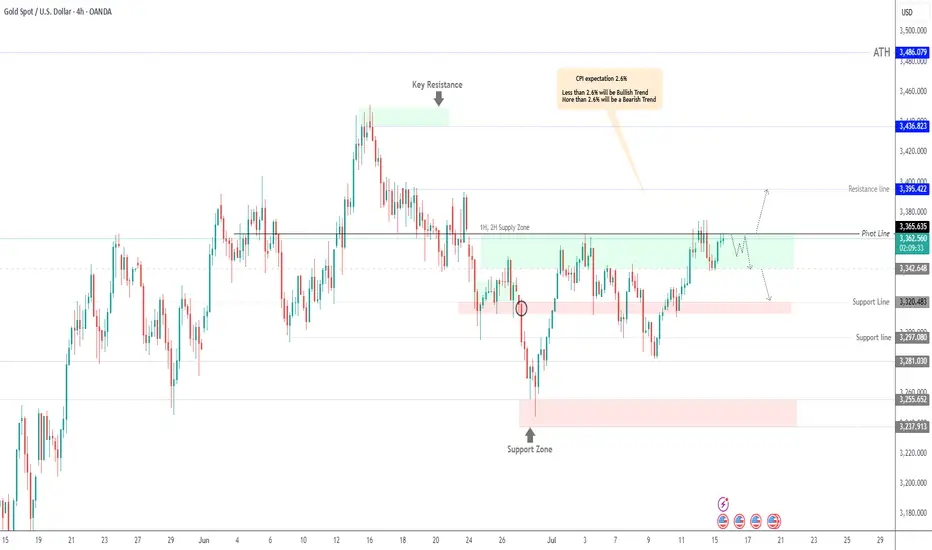
GOLD Under Pressure – CPI to Drive the Next MoveGOLD Outlook – Bearish Below 3365, CPI in Focus
Gold is showing bearish momentum while trading below 3365, with a likely move toward 3342.
However, if the price closes a 1H or 4H candle above 3365, it may shift to a bullish trend targeting 3395.
CPI data will be the key factor in determining the next move.
The market expects a print of 2.6%, which would signal no Fed rate cuts this year due to rising tariff pressures.
That said, we expect a 2.7% release, which would likely support a bearish trend for gold.
But if the release is less than 2.6% that will support the bullish trend.
Pivot Line: 3365
Support: 3342 – 3320
Resistance: 3375 – 3395
ORCA/USDT NEW VOLUME ENTERYORCA shows for the first time in long time ago a new volume uptrend, which can get confirmed in the next hours to a new volume.
When there are new confirmations or updates, they will be listed here below.
If there is new confirmations coming, we could see this coin soon to targets
$3.17
$4.20
Best target $5
The trend study shows there is new interest in ORCA

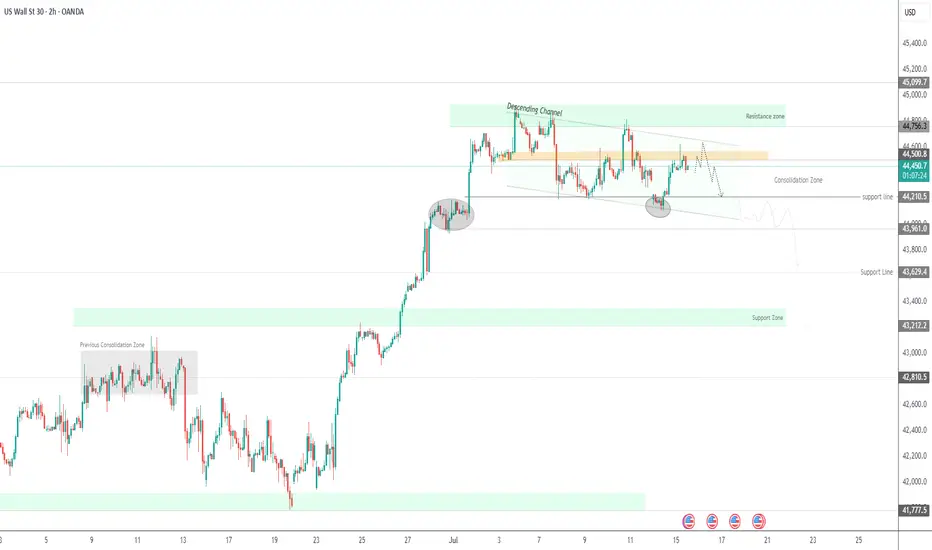
US30 – Bearish Outlook Below 44,500 as CPI Looms US30 – Bearish Outlook Below 44,500 as CPI Looms
US30 rallied and successfully reached our resistance target, as expected in the previous analysis.
However, with today’s CPI release, the market is likely to see increased volatility. As long as the index trades below 44,500–44,570, the bias remains bearish, with downside targets at 44,210 and 43,960.
• If CPI prints below 2.6%, we may see a bullish breakout toward 45,100
• Above or equal to 2.6% supports continuation of the bearish move
However, we expect a 2.7% reading, driven by tariff-related price increases, which would support the bearish scenario.
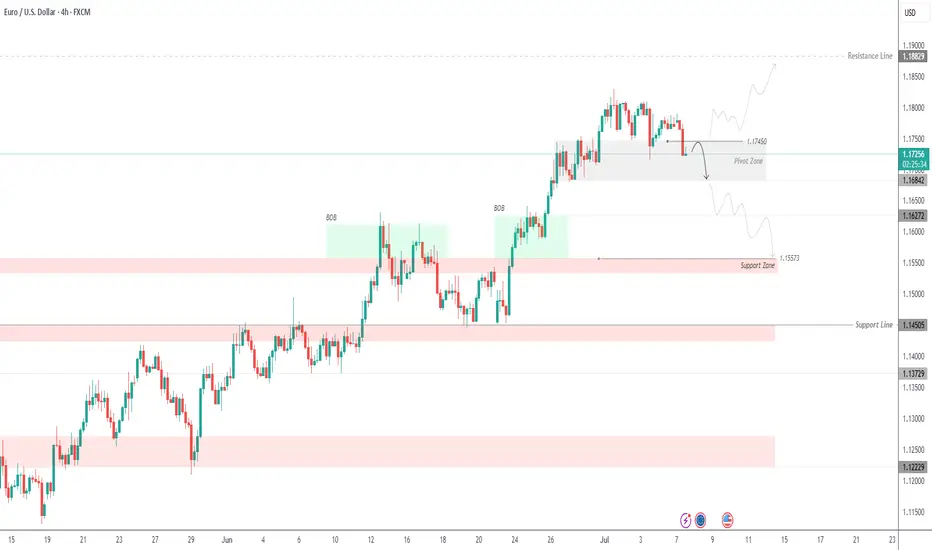
EURUSD – From Structure to Shift
1H Technical Outlook by MJTrading
EURUSD moved cleanly through a sequence of structural phases:
• Previous Base
• Multi-day Consolidation (potential quiet accumulation)
• Transition into a well-respected Descending Channel
Price has since shown repeated rejections from the upper boundary, including a decisive selloff from the 1.1750 zone, forming what we now label a "Pressure Gap" — a space where aggressive sellers overwhelmed price.
🧭 Key Scenarios Ahead:
🔻 Bearish Continuation:
Breakdown below 1.1700 opens room toward:
• 1.1640 (channel bottom)
• 1.1600 Liquidity Zone
Watch for impulsive sell candles + EMA rejection
🔁 Short-Term Bounce or Trap:
Holding above 1.1700 could spark a rebound toward 1.1750
This may serve as a final test before another leg lower
Only a clean break and hold above 1.1763 flips structure bullish
🔍 Bonus Confluence:
1D Chart shows broader bullish context (inset)
EMAs tightening = expect volatility burst
Well-defined structure gives clear invalidation and targets
Every trend tells a story — from base building to breakout, and now a possible breakdown. Trade the structure, not the prediction.
#EURUSD #Forex #TradingView #TechnicalAnalysis #PriceAction #DescendingChannel #LiquidityZone #SmartMoney #MJTrading

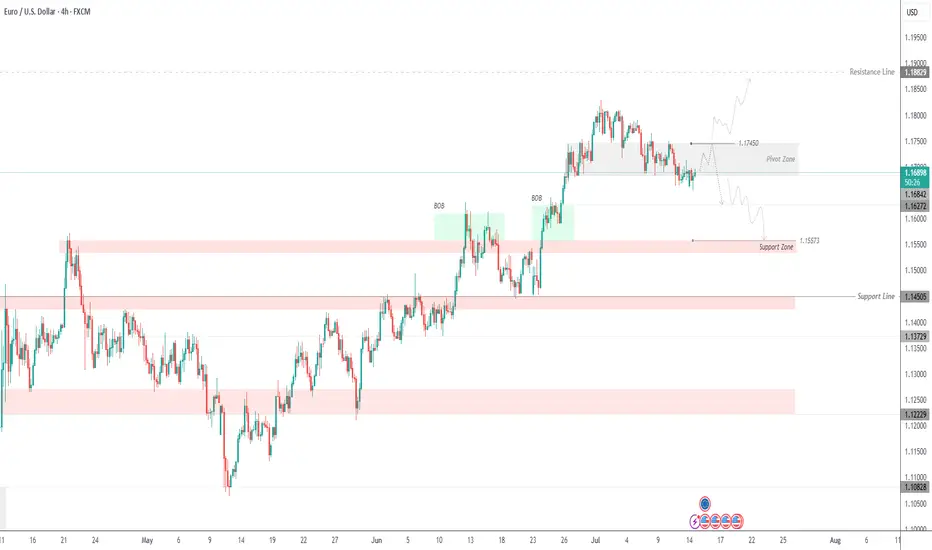
EURUSD Testing Patience – Bearish Trend Not Over YetEURUSD – Overview
EURUSD continues to trade under pressure amid bearish momentum, respecting key technical levels.
The price maintains bearish momentum as long as it trades below 1.1745, with downside targets at 1.1627 and 1.1557.
A retest of 1.1745 is possible and considered normal in this structure. However, if the price stabilizes below 1.1684, it will likely continue dropping toward the support targets.
To shift back to a bullish bias, the pair must break and hold above 1.1745.
Pivot Line: 1.1695
Support Levels: 1.1627 – 1.1557
Resistance Levels: 1.1745 – 1.1810
previous idea:
BREAK 2.0 upcoming for VELO/USDTVELO/USDT has high chance to break in the coming hours, more updates later when there is more confirmations below this update

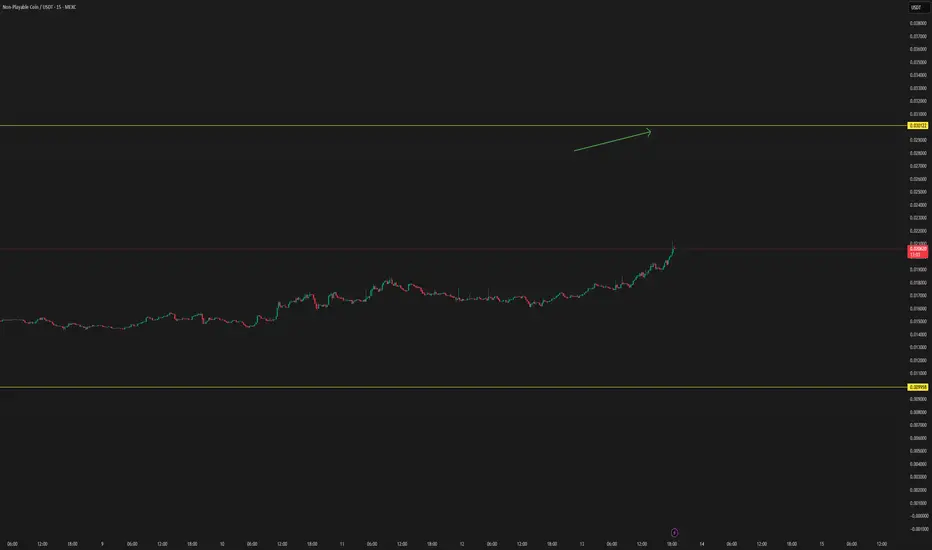
NPC/USDT NEW VOLUME WAVENew volume wave seems to start on this coin, which can get confirmed in the coming hours.
If there is new updates depending on data or volume, the chart will be updated here.
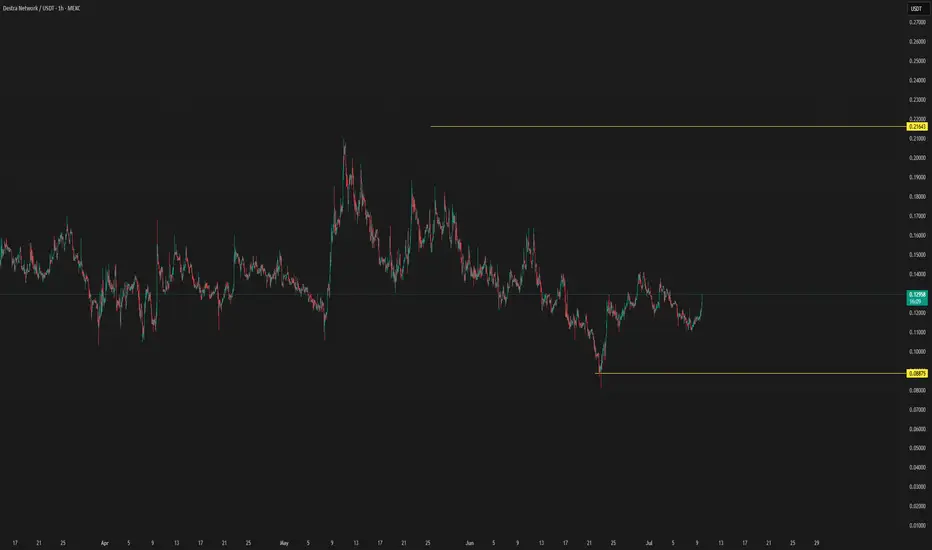
CLOUD THIS CAN BE THE BOTTOM STARTThis is a new coin to watch in the coming period, as it is showing signs of potentially forming a new bottom.
By respecting the previous all-time low, there’s a possibility that a new upward trend could begin from this level. Some indicators are also pointing toward this scenario.
If the coin provides further confirmations, updates will be shared below.

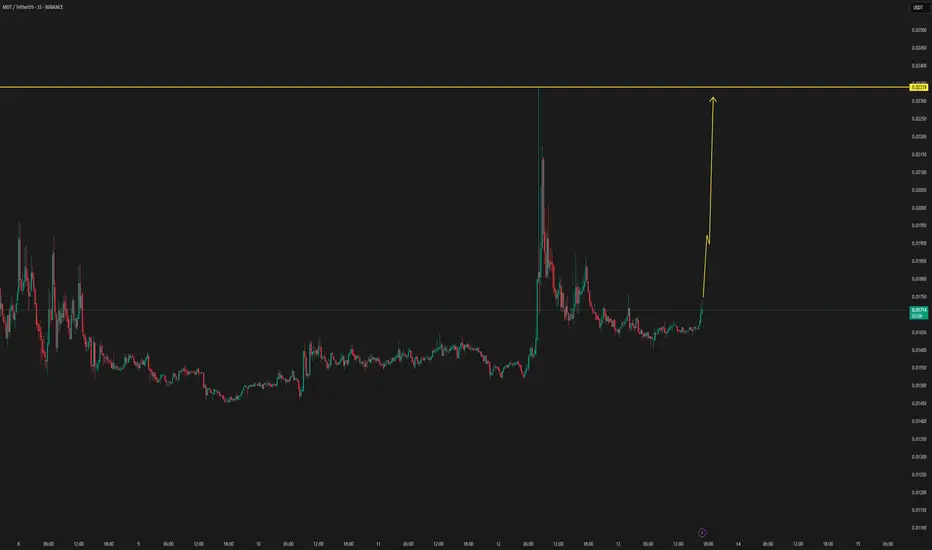
MDT NEW INCREASE VOLUMEMDT/USDT has new volume upcoming, which can be confirmed in the coming time frames. by new confirmations, the update will be followed below.
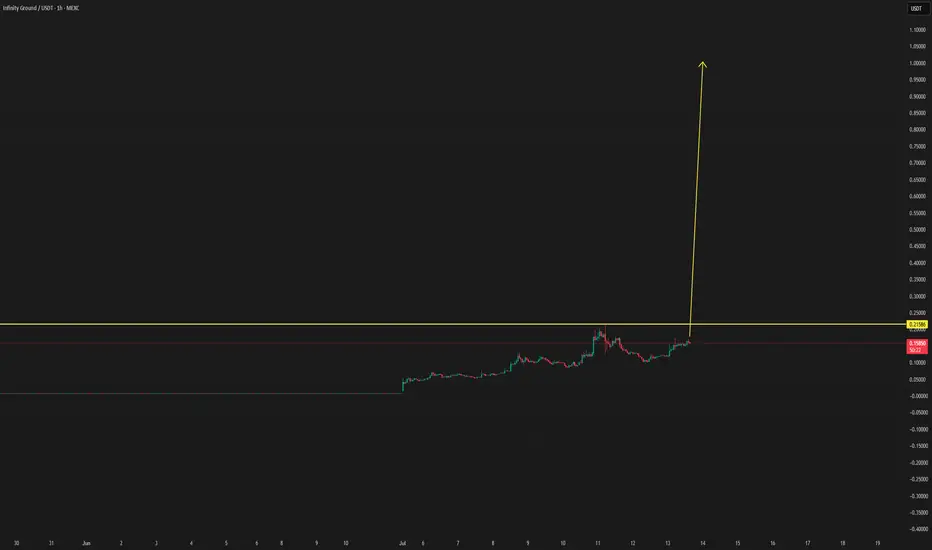
AIN/USDT : IS THIS THE COIN THAT WILL DO IT?? MOON SHOTAfter analyzing this coin, we’ve identified signals suggesting a potential breakout in the near future. As a result, we will continue monitoring it closely for confirmation.
Once confirmation is established, further updates will be provided below.
follow up the $0,30, expecting as first target
BTC & USDT.D => Bullish Correction Incoming?Hello TradingView Family / Fellow Traders. This is Richard, also known as theSignalyst.
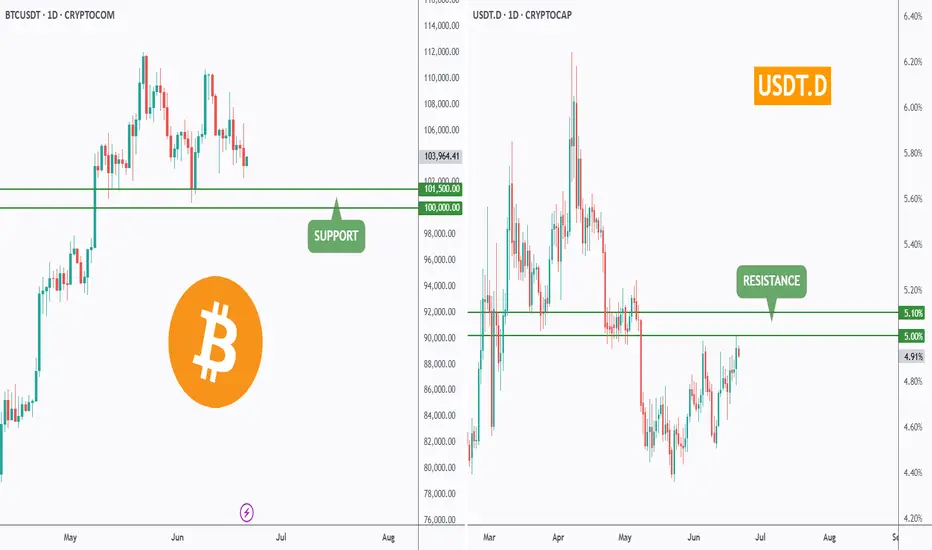
Both BTC and USDT.D are sitting around key rejection zones.
💰 BTC is hovering near the $100,000 level — a major previous low and a psychological round number.
📊 Meanwhile, USDT.D is testing the 5% resistance — a supply zone and another critical round number.
As long as $100,000 holds as support on BTC and 5.1% holds as resistance on USDT.D, we could expect a bullish correction across the crypto market.
What do you think? Will these levels hold or break? 🤔
📚 Always follow your trading plan regarding entry, risk management, and trade management.
Good luck!
All Strategies Are Good; If Managed Properly!
~Rich
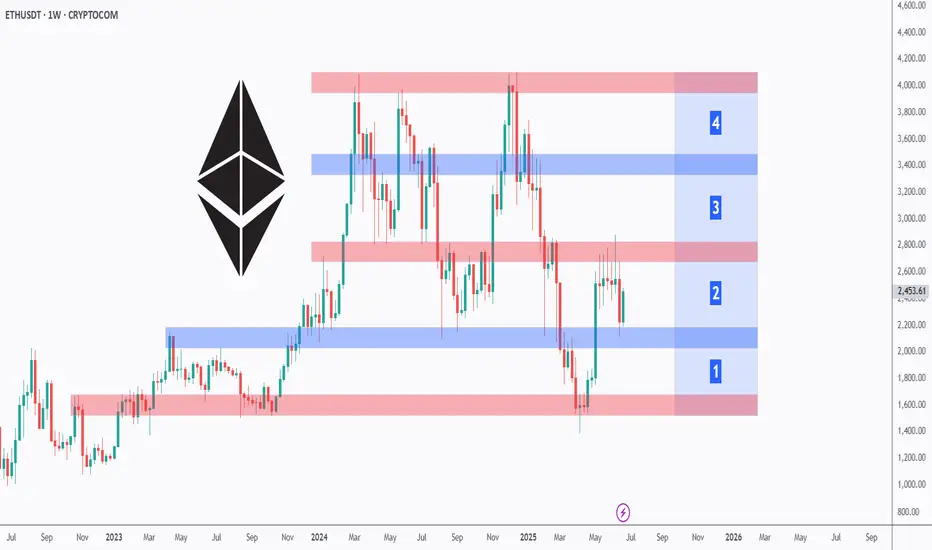
ETH Building Blocks - Keep it Simple🧱 Building Block - ETH Weekly Analysis 🧱
Ethereum has been trading within a well-defined structure, respecting key horizontal zones — each acting as a crucial building block in ETH’s macro journey.
🔹 Zone 1 ($1,700 - $2,100)
A strong demand and accumulation zone. ETH bounced from here multiple times, proving itself as the foundation of the current bullish attempt.
🔹 Zone 2 ($2,400 - $2,600)
We're currently hovering around this key mid-range resistance. A successful break above it would pave the way for the next major leg up.
🔹 Zone 3 ($2,900 - $3,400)
A major historical resistance turned supply area. ETH needs strong momentum and volume to break through this ceiling.
🔹 Zone 4 ($3,800 - $4,200)
The final building block before retesting ATH territory. A retest here could signal full bullish control in the coming months.
📍 As long as Zone 1 holds, ETH remains structurally bullish. Watch for breaks and rejections at each building block to gauge the next move.
Which block will ETH break next? 🔮
📚 Always follow your trading plan regarding entry, risk management, and trade management.
Good luck!
All Strategies Are Good; If Managed Properly!
~Rich
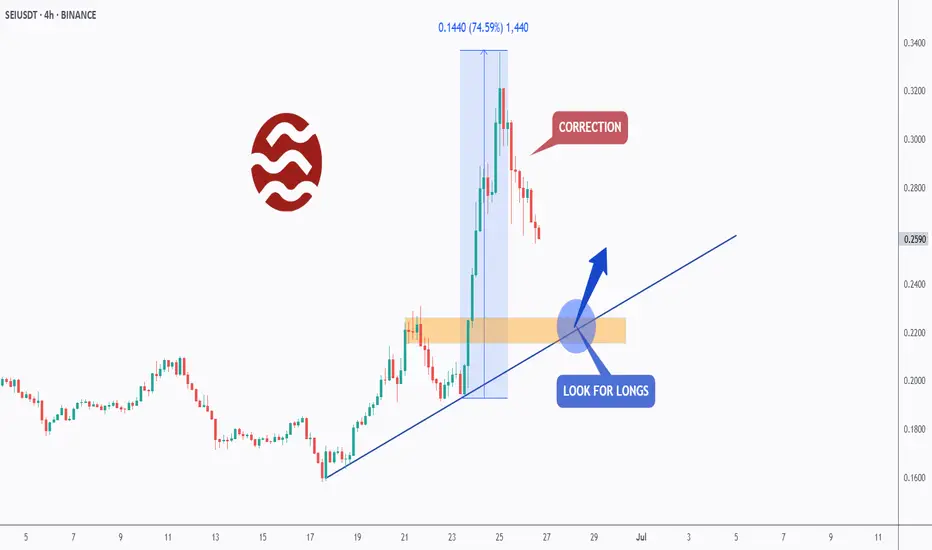
SEI - One More Bullish Impulse Soon!Hello TradingView Family / Fellow Traders. This is Richard, also known as theSignalyst.
📈After surging by over 75% last week , SEI is currently in a correction phase.
However, it is approaching the intersection of the previous high marked in orange and blue trendline acting as a non-horizontal support.
📚 As per my trading style:
As #SEI approaches the blue circle zone, I will be looking for bullish reversal setups (like a double bottom pattern, trendline break , and so on...)
📚 Always follow your trading plan regarding entry, risk management, and trade management.
Good luck!
All Strategies Are Good; If Managed Properly!
~Rich
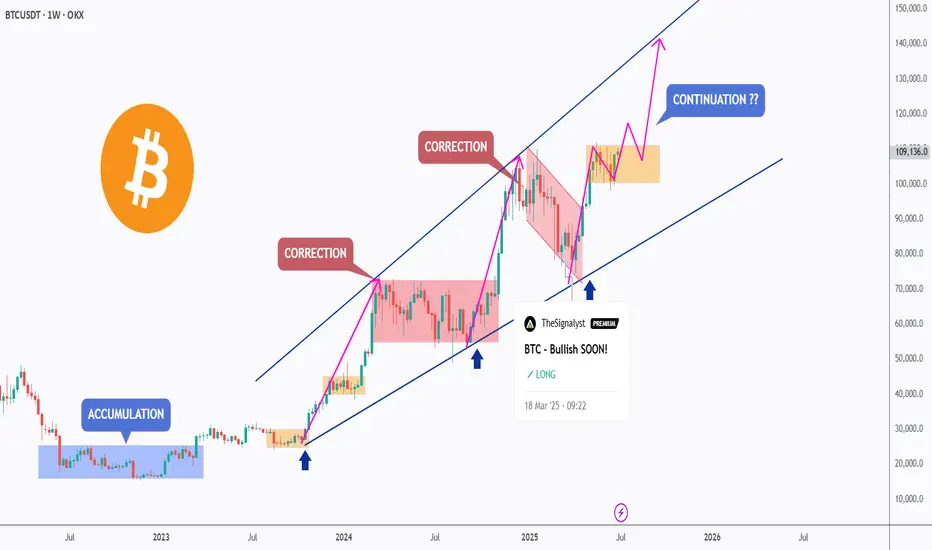
BTC – Bullish Continuation Ahead ?Bitcoin has been trading within a well-defined rising channel since mid-2023, respecting both upper and lower bounds beautifully.
After each impulsive move, we’ve seen healthy corrections followed by bullish continuations — a classic market structure in play.
🟦 Accumulation Zone: After a long accumulation phase, BTC kicked off a strong bullish cycle.
🟥 Correction Phases: Each major move was followed by a red correction zone before resuming the uptrend.
🟧 Current Phase: BTC is consolidating just below the upper channel boundary. A breakout above this zone could confirm the next bullish wave toward $140K+.
🔵 Key Observations:
Structure remains intact within the channel
Previous breakout zones now acting as support (blue arrows)
Continuation patterns are forming, signaling potential upside
🏹As long as the orange zone holds, BTC remains in a bullish structure, and a breakout would likely push us to new highs.
📍Will history repeat and BTC continue its journey toward the upper channel boundary? Let’s wait for confirmation!
💬 What’s your bias here? Are you bullish or waiting for a deeper pullback?
📚 Always follow your trading plan regarding entry, risk management, and trade management.
Good luck!
All Strategies Are Good; If Managed Properly!
~Richard Nasr
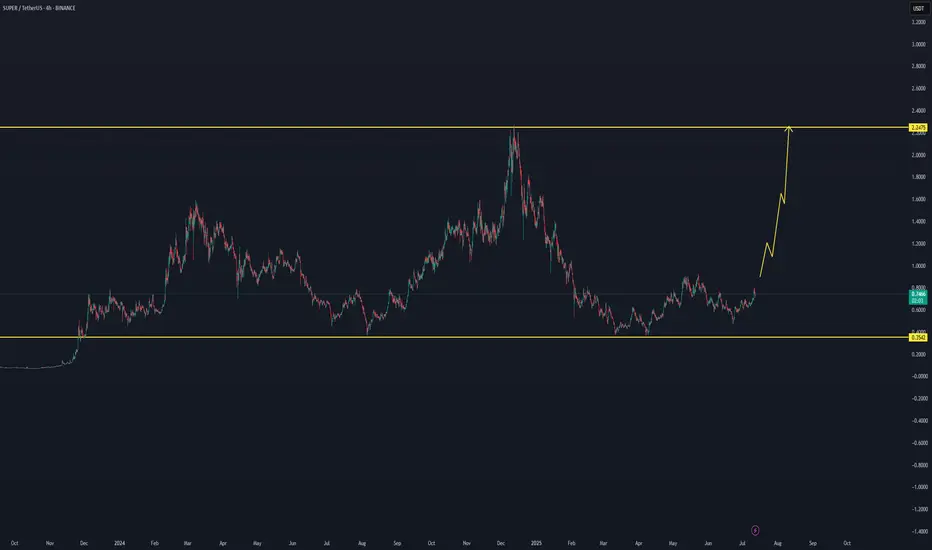
SUPER = BACK WITH SUPER EFFECT - MOON SHOTSuper can show in the coming time frames an interesting view.
When there is confirmations, will add below this update.
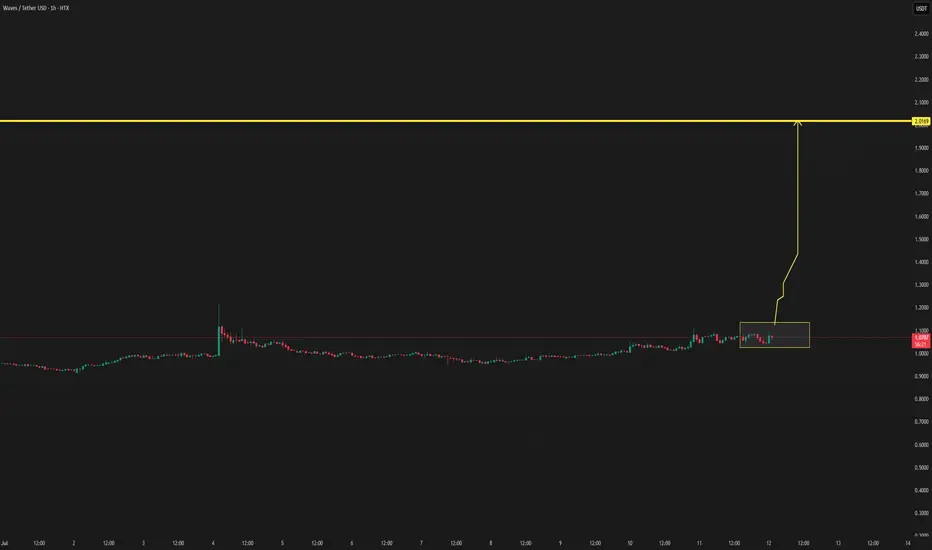
WAVES ON WAY TO $2waves have a high chance to enter a new break to 2 usd, since the last data.
When there is more confirmation, the updates will be below.
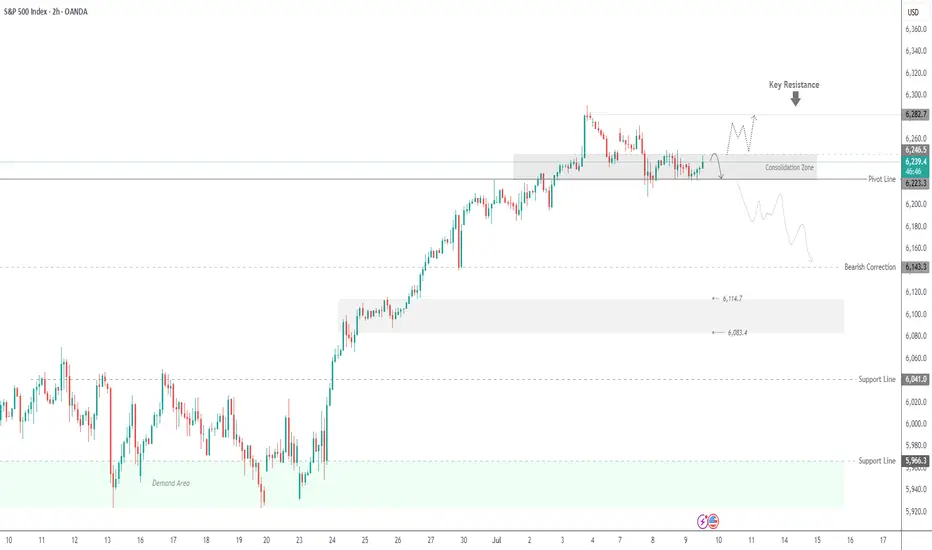
SPX500 Bearish Below 6246 – Eyes 6223 and 6195SPX500 Analysis
SPX500 stays under bearish pressure below 6246, targeting 6223 and possibly 6195 if the decline continues.
Recent tariff escalation by President Trump is adding weight to downside momentum across indices.
Pivot: 6246
Support: 6223, 6195, 6143
Resistance: 6268, 6291
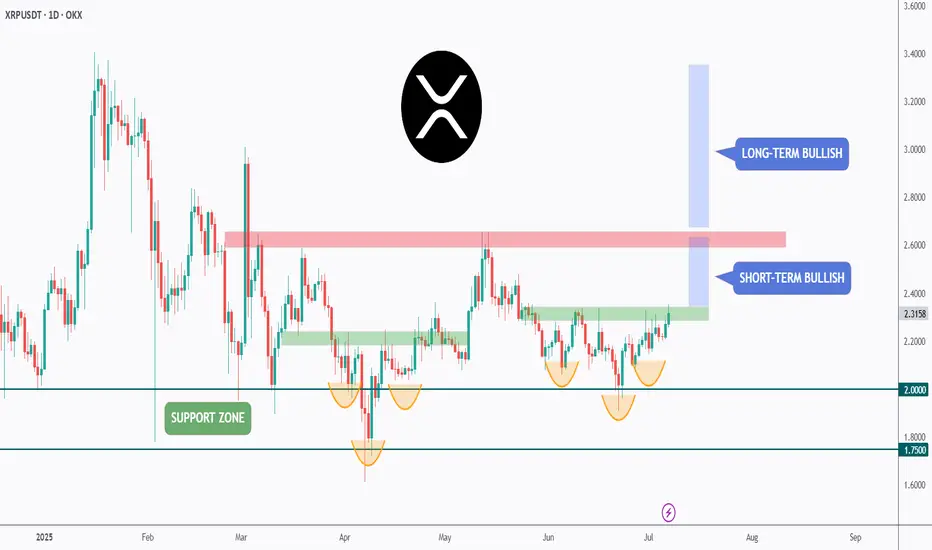
XRP - Wait For It!Hello TradingView Family / Fellow Traders. This is Richard, also known as theSignalyst.
📈 Is history repeating itself? 🤔
XRP is now back at the $1.75–$2 support zone and forming a fresh inverse head and shoulders pattern.
As long as this support holds, we’ll be on the lookout for new long opportunities. 🟢
For the bulls to take over in the short term, a break above the green neckline is needed.
And for long-term control, a break above the red structure is essential. 🔺
For now, we wait patiently! ⏳
📚 Always follow your trading plan regarding entry, risk management, and trade management.
Good luck!
All Strategies Are Good; If Managed Properly!
~Rich
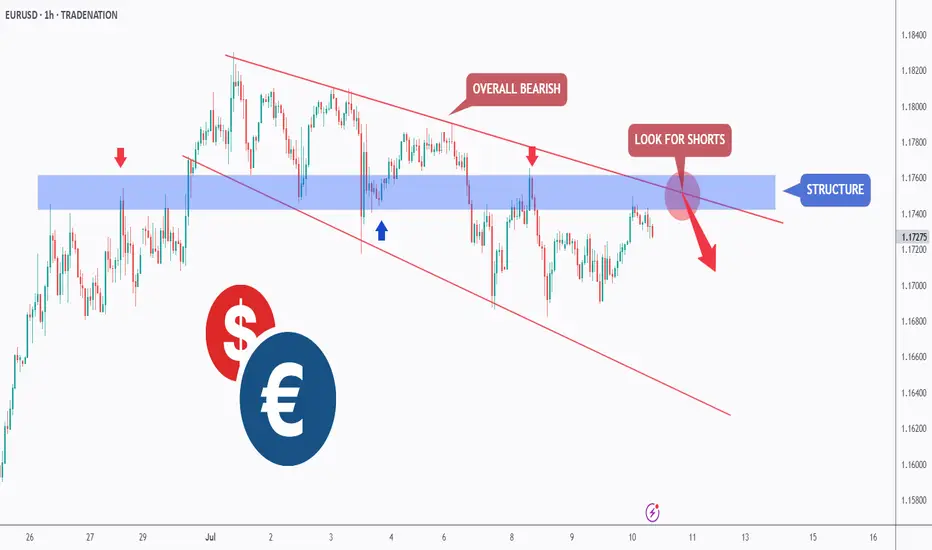
EURUSD - Bears Are on the MoveHello TradingView Family / Fellow Traders. This is Richard, also known as theSignalyst.
📈EURUSD has been overall bearish trading within the falling wedge pattern marked in red. And it is currently retesting the upper bound of the wedge.
Moreover, the blue zone is a strong structure.
🏹 Thus, the highlighted red circle is a strong area to look for sell setups as it is the intersection of the upper red trendline and structure.
📚 As per my trading style:
As #EURUSD approaches the red circle zone, I will be looking for bearish reversal setups (like a double top pattern, trendline break , and so on...)
📚 Always follow your trading plan regarding entry, risk management, and trade management.
Good luck!
All Strategies Are Good; If Managed Properly!
~Rich
Disclosure: I am part of Trade Nation's Influencer program and receive a monthly fee for using their TradingView charts in my analysis.
EURUSD Below 1.1745 – Bearish Bias in PlayFX:EURUSD Technical Outlook
EURUSD maintains bearish momentum as long as the price remains below 1.1745, with a near-term target at 1.1684.
A confirmed breakout above 1.1745 would shift the trend to bullish, opening the path toward 1.1808 and 1.1883.
On the downside, a 1H or 4H candle close below 1.1684 would reinforce the bearish trend, likely extending losses toward 1.1627, and possibly 1.1557.
Support: 1.1684 / 1.1627 / 1.1557
Resistance: 1.1808 / 1.1883
DSYNC/USDT NEW INCREASE VOLUMEDSYNC/USDT NEW INCREASE VOLUME
New upcoming volume, that's what the trend data shows, we will follow this coin with updates by confirmations.
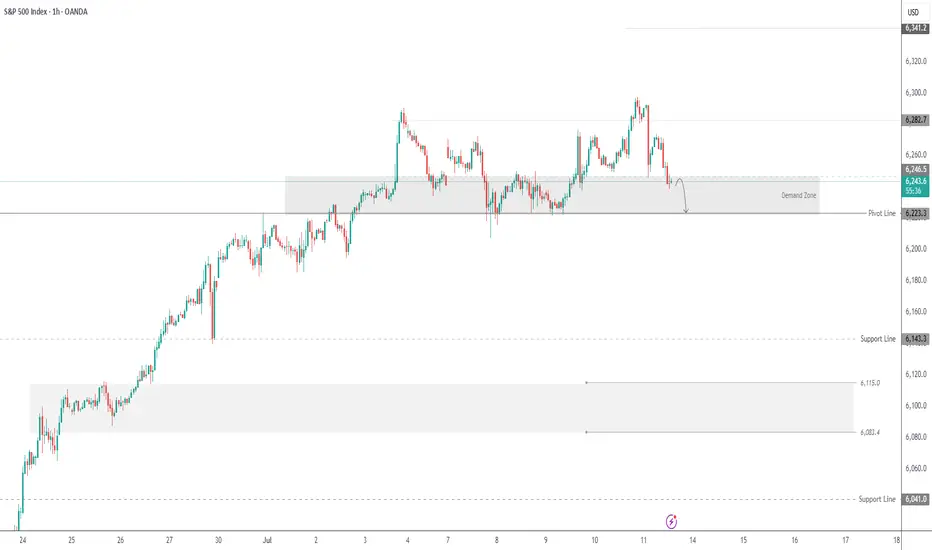
SPX500 Awaits Breakout as Trade Talks Fuel Market CautionWall Street Edges Up Amid Tariff Talks & Trade Turbulence
U.S. stock index inched higher on Wednesday as markets remain on edge over President Donald Trump's aggressive tariff stance and the ongoing negotiations with global trade partners. Traders are cautiously watching for clarity, with sentiment shifting quickly on any updates.
📉 SPX500 Technical Outlook
The index continues to consolidate within a narrow range between 6223 and 6246. A confirmed breakout from this zone is needed to define the next directional move.
A break below 6223 would confirm bearish continuation toward 6194, with potential extension to 6143.
A break above 6246 would shift the bias bullish, targeting 6282, followed by 6305.
Key Levels:
Support: 6223 / 6195 / 6143
Resistance: 6282 / 6305