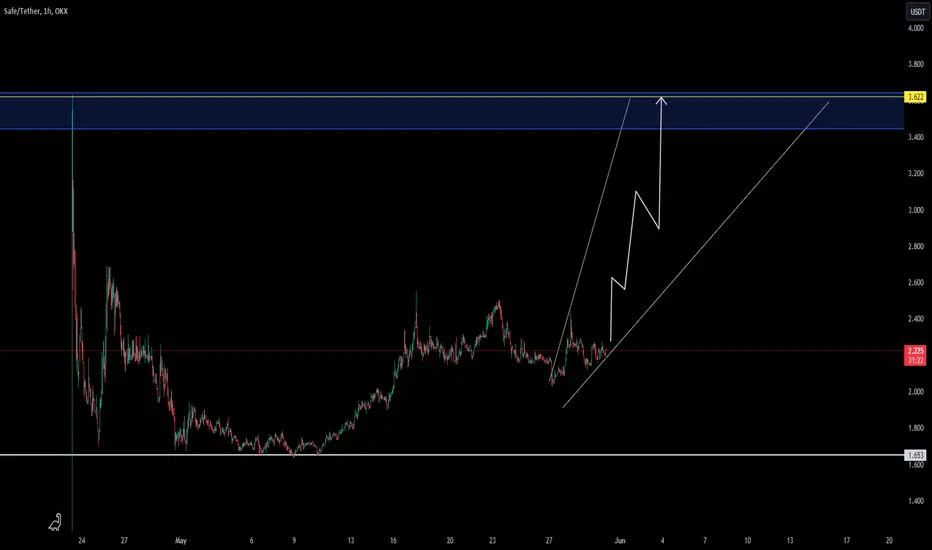
SAFE NEW INCREASE VOLUMEHello traders,
SAFEUSDT is showing an interesting reversal pattern that could signal a new trend towards its previous all-time high (ATH) level.
Today, the coin has demonstrated a new trend activation, prompting us to update the idea chart to reflect this increased potential.
There is a high probability that we will see a rise in volume in the upcoming time frames.
Markets are going on their way, and there is not always a reason that the market should move directly. Sometimes it takes more time before the trend gets a confirmation.
there are no guarantees in the market and This idea is not trading advice.
The goal is to check where are the moment possibilities in trading, and the possibilities that the market can have in the coming time frames. ( depending on study and high chance)
Trend
Trends Mixed; Overall Neutral Short Term on MarketsSo, as stated in the video, the shorter term timeframes of 30m/1hr/2hr have opened up to lower movements, while the 3hr/4hr/6hr have been violated and would call for a movement back up, but haven't shown that potential movement yet.
We are still in a short term Bullish Zone in accordance with my moving momentum algorithm, but we are very close to hitting below that Zero Line into Bearish territory, especially if we continue to stay low like this. What I may look for is a movement into the Bearish zone, a move upward, and if that movement upward doesn't bounce us back into a bullish zone I may short the market, but we shall see.
Overall long term, I'm curious if the Daily can push below and settle under 5160ish for a Lower Low. It would be the first time in quite some time that we had a lower low on the Daily trend, putting us at risk of getting a lower high Daily rebound that will call for markets to be on a decline.
Overall, The Mag 7, especially NVidia, still continue to mostly carry the market with the bulk of the Dow in neutral territory at best, and the Nasdaq outside of the Mag 7 also neutral. I continue to be concerned about this rally being too narrow and traders continuing to use Mag 7 stocks as safety stashes, and what will happen if they choose to take that safety money out to stash it somewhere else.
Trends into today are;
Last Macro Trend Signal Spots (ES Contract)
30m - 5319 Downtrend (5/28/2024) Lower Low
1Hr - 5313 Downtrend (5/28/2024) Lower Low
2Hr - 5309 Downtrend (5/28/2024) Lower Low
3Hr - 5286 Downtrend (5/23/2024) Higher Low
4Hr - 5286 Downtrend (5/23/2024) Higher Low
6Hr - 5287 Downtrend (5/23/2024) Higher Low
12Hr - 5188 Uptrend (5/6/2024) Higher High
Daily - 5330 Uptrend (5/15/2023) Higher High
Weekly - 4769 Uptrend (12/11/2023) Higher High
Monthly - 5304 Uptrend (03/31/2024) Higher High
Economic Calendar;
GDP Thursday
PCE Friday
Earnings to watch;
Salesforce AMC today
Costco earnings are tomorrow
My sentiment on the market is as follows;
Shorter Term - Bearish
Short Term - Bearish / Neutral
Medium Term - Neutral / Bullish
Long Term - Bullish
Basically, I don't see major risks in the long-term just yet, but the short term is a bag of mixed reactions. Currently in a place I feel we may need to look elsewhere. If you were looking for me to give you a warm and fuzzy on where to trade the ES Futures, I just can't give that today.
Safe trading and remember your risk management.

GOLD FORECASTThe current analysis indicates a Bullish trend for OANDA:XAUUSD , should continue on the secondary channel till 2369, and after that stabilizing above 2369 will continue the bullish trend till 2397. otherwise stabilizing below 2369 will try to reach 2334 and 2306.
Key Levels:
Bullish Lines: 2369, 2397, 2412
Bearish Lines: 2334, 2306, 2281

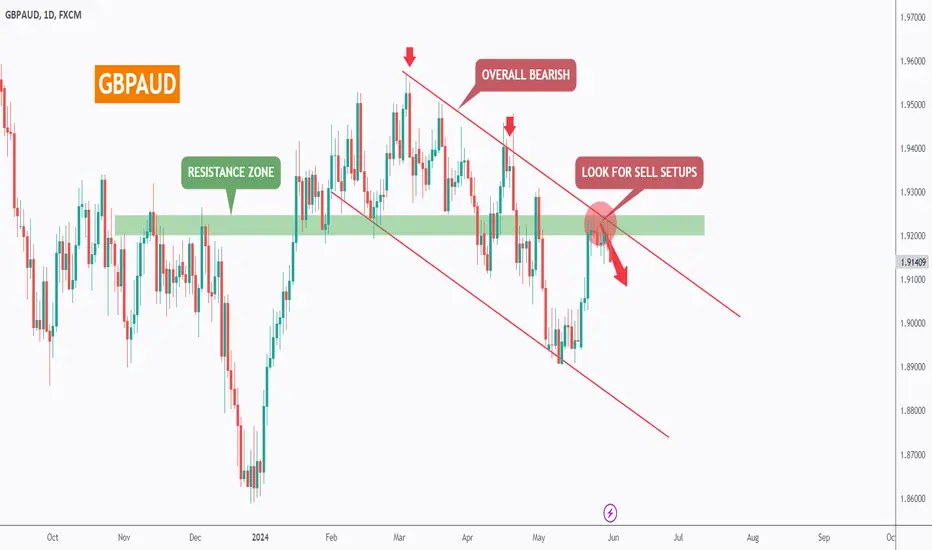
GBPAUD - Follow The Trend!Hello TradingView Family / Fellow Traders. This is Richard, also known as theSignalyst.
📈 GBPAUD has been overall bearish , trading within the falling channel in red.
At present, GBPAUD is approaching the upper bound of the channel acting as a non-horizontal resistance.
Moreover, it is retesting a strong resistance marked in green.
🏹 Thus, the highlighted red circle is a strong area to look for sell setups as it is the intersection of the green resistance and upper red trendline.
📚 As per my trading style:
As #GBPAUD approaches the circle zone, I will be looking for bearish reversal setups (like a double top pattern, trendline break , and so on...)
📚 Always follow your trading plan regarding entry, risk management, and trade management.
Good luck!
All Strategies Are Good; If Managed Properly!
~Rich
CADCHF - Ready For The Next Impulse 📉Hello TradingView Family / Fellow Traders. This is Richard, also known as theSignalyst.
📈 CADCHF has been overall bearish, trading within the falling channel in red.
At present, CADCHF is hovering around the upper bound of the channel acting as a non-horizontal resistance.
Moreover, it is retesting the upper bound of the short-term symmetrical triangle marked in orange.
🏹 Thus, the highlighted red circle is a strong area to look for sell setups as it is the intersection of the upper orange and red trendlines.
📚 As per my trading style:
As #CADCHF is around the circle zone, I will be looking for bearish reversal setups (like a double top pattern, trendline break , and so on...)
📚 Always follow your trading plan regarding entry, risk management, and trade management.
Good luck!
All Strategies Are Good; If Managed Properly!
~Rich

DJ30 FORECASTThe forecast for the Dow Jones 30 is now leaning towards a bearish trend. Prices are expected to fluctuate between 40050 and 39564. However, if the 4h candle closes below the pivot line at 39,564, the bearish pressure is likely to continue, potentially driving prices down to 39400 and 38825.
Key Levels:
Bullish Line: 39825, 40050, 40285, 40500
Pivot Line: 39564
Bearish Line: 39400, 39075, 38825, 38445

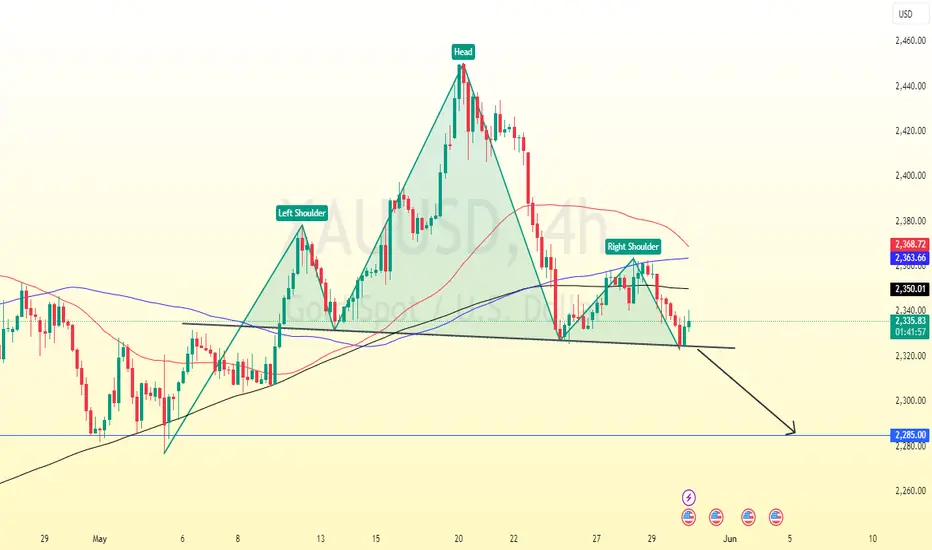
Gold ( XAUUSD ) analysis tradingview.sweetlogin.com
On the 4-hour chart, XAUUSD has developed a head and shoulders pattern, indicative of a classic reversal trend. The price is currently hovering around a pivotal support level, with the moving averages suggesting a potential for further downward movement.
A selling opportunity for XAUUSD may arise if the price breaks below the support at 2330, potentially leading to a further drop towards 2285.
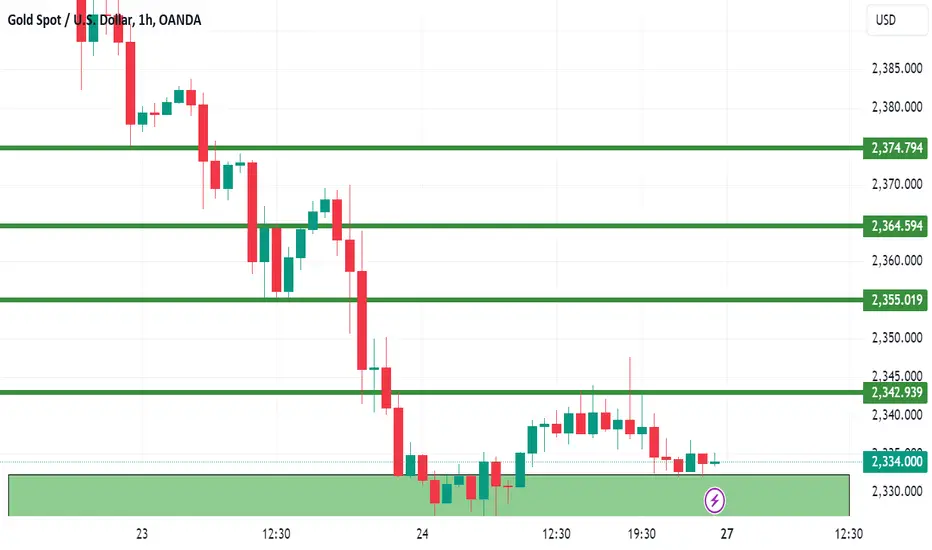
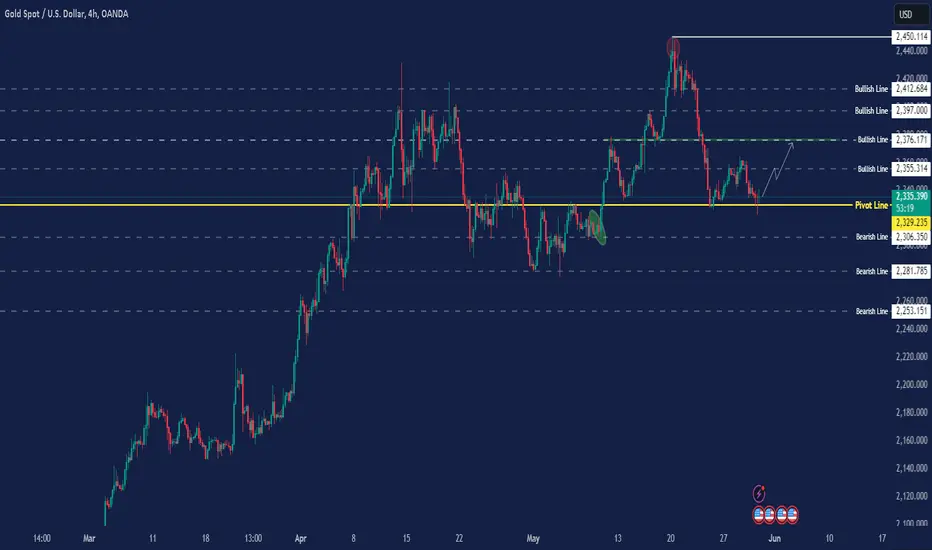
GOLD FORECASTThe current analysis indicates a Bullish trend for OANDA:XAUUSD , provided it stays above the PIVOT LINE at 2329, and it's possible to touch 2355 as well then it'll start the bullish trend. The prevailing Bullish pressure suggests that if trading remains above 2329, the trend will continue a strong upward till 2376. otherwise stabilizing below 2329 will try to reach 2306.
Key Levels:
Bullish Line: 2355, 2376, 2397, 2412
Pivot Line: 2329
Bearish Line: 2306, 2281, 2306
DJ30 FORECASTThe forecast for the OANDA:US30USD indicates a potential bearish trend. However, there may be a retest of resistance levels between 38445 and 38600 before the downtrend begins. The bearish movement is expected to target support levels at 37721 and 37499.
Key Levels:
Bullish Line: 38445, 38825, 39075, 39400
Pivot Line: 38000
Bearish Line: 37721, 37499, 37130, 36665

XAUUSD recent updatexauusd is moving so deep down after various FED talks
Gold slumps amid strong US Dollar, high US Treasury yields
Gold prices slump on Wednesday amid rising US Treasury yields, boosting demand for the Greenback due to hawkish comments by a Federal Reserve (Fed) official.
our recent analysis founds 2330-2328 is a strong support area and 2344 act as major pivot due to simple moving average passing through the point and mayor retracement from that area many times yesterday.
above 2344 its a buy
like share subscribe

SPY Fibonacci Price Theory And BreakOut BarsThis instructional video teaches you the basics of Fibonacci Price Theory in conjunction with Breakout Bars and how price is the ultimate indicator.
Throughout this video, I try to provide instruction on key elements related to the Fibonacci Price Theory (Unique & Standout Highs/Lows). Additionally, I've also included Breakout Bars and Fibonacci Price Retracement concepts.
What I really hope you learn from this video is to see price as the true ultimate indicator for your trading decisions. Using technical analysis techniques is fine, but use price as the key element when trying to confirm or reject your trading ideas.
I hope this helps you understand that price, action, and reaction through trends, peaks, and troughs are the most important components of the chart. Everything else is peripheral.

FOXY NEW INCREASE TREND ATHThe main market is stable, and there are low effect on long.
This update is for FOXYUSDT
Depending on the study trend this coin shows possibilities for new increase.
FOXY seems to be at an important key level, where it has a high chance of breaking in the coming time.
We will follow this coin with the possibility of the trend increasing and breaking.
This can be interesting for day trading and long term, it depends on the coming time market view.
Remember, there are no guarantees in the market. Always follow a consistent system based on your own strategies and analysis that are at long-term profitable.
The reason for expecting this coin can increase
Activation of a new trend with the possibility of starting a new cycle.
Good times, everyone.
This update is not trading or financial advice.

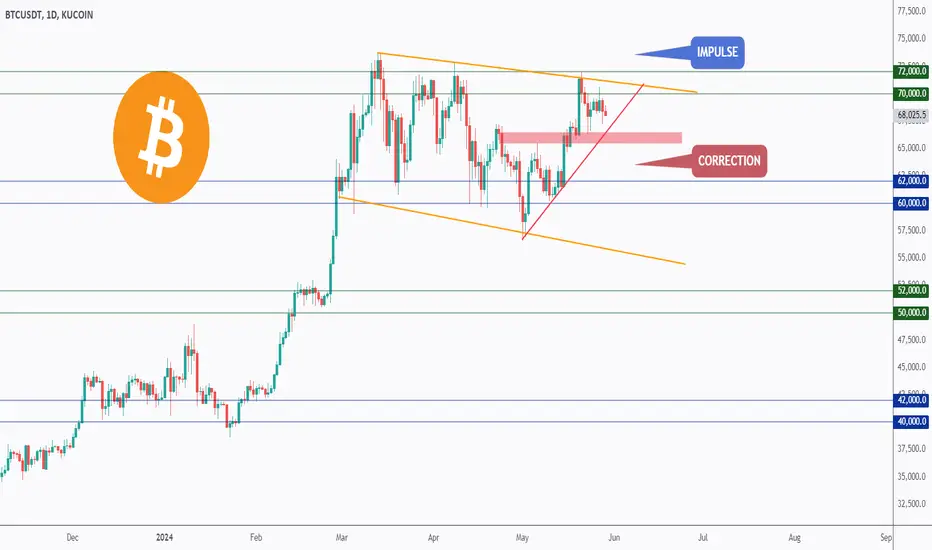
BTC - Ready For Some Action?Hello TradingView Family / Fellow Traders,
As per my last analysis, BTC rejected the $60,000 support and traded higher.
What's next?
Scenarios:
1️⃣ Bullish - Continuation
For the bulls to maintain control, a break above the $72,000 resistance is needed.
In this case, a movement towards the $80,000 resistance would be expected.
2️⃣ Bearish - Correction
In parallel, if the last low marked in red is broken downward, we expect the bearish correction to start leading to a movement towards $60,000.
Which scenario is more likely to happen first? and why?
📚 Always follow your trading plan regarding entry, risk management, and trade management.
Good luck!
All Strategies Are Good; If Managed Properly!
~Richard Nasr
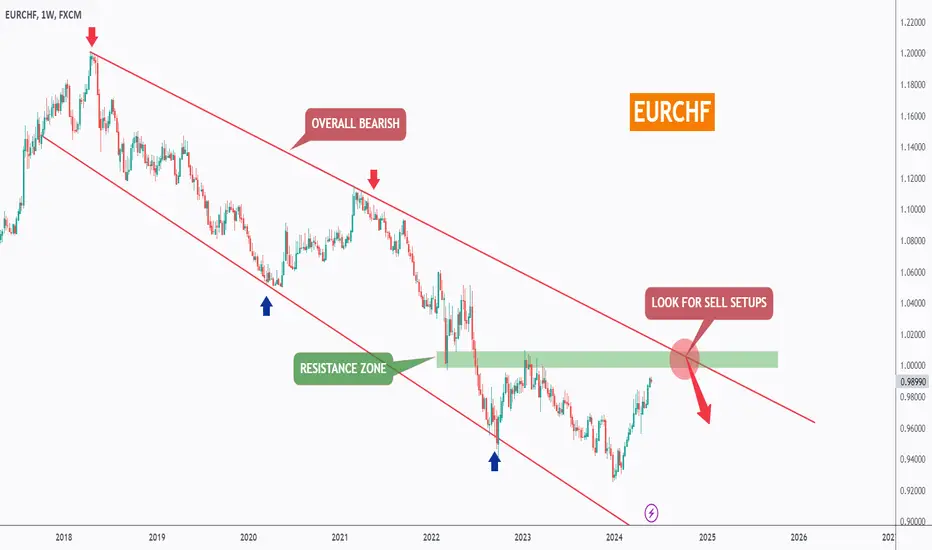
EURCHF - Follow The Trend!Hello TradingView Family / Fellow Traders. This is Richard, also known as theSignalyst.
📈 EURCHF has been overall bearish, trading within the falling wedge in red.
At present, EURCHF is approaching the upper bound of the channel acting as a non-horizontal resistance.
Moreover, it is retesting a strong resistance marked in green.
🏹 Thus, the highlighted red circle is a strong area to look for sell setups as it is the intersection of the green resistance and upper red trendline.
📚 As per my trading style:
As #EURCHF approaches the circle zone, I will be looking for bearish reversal setups (like a double top pattern, trendline break , and so on...)
📚 Always follow your trading plan regarding entry, risk management, and trade management.
Good luck!
All Strategies Are Good; If Managed Properly!
~Rich
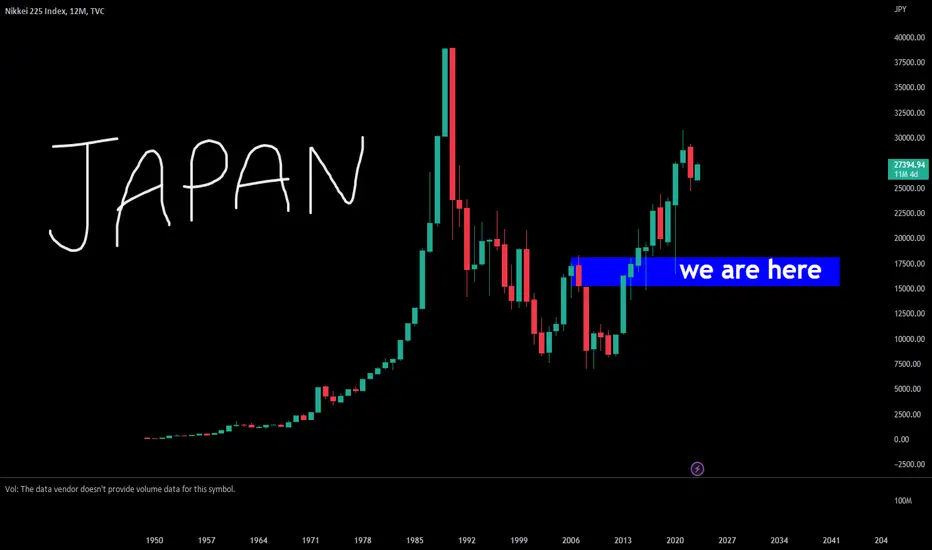
NiKKEi the Empire who saw Tomorrow 100 years ago
the OG in quantitative zero cost coupons and negative rates
with subways in the 1930s
touchscreens ai robotics in the 70s
and rise of gaming in the 80s
still is a decade ahead among developed countries
and 100 years++ ahead the rest of the emerging economies
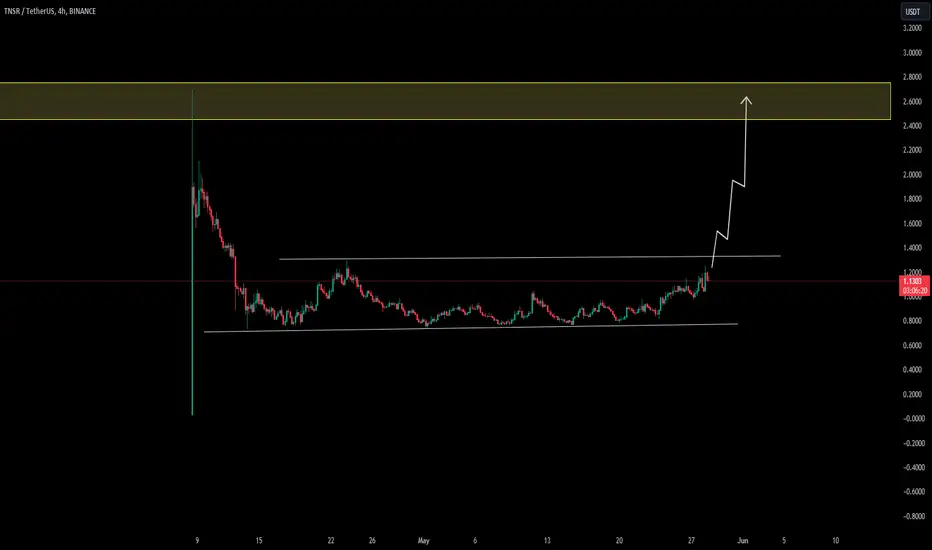
TNSR NEW BREAK POSSIBILITY
This update is for TNSRUSDT
Depending on the study trend this coin shows possibilities for new increase.
TNSR seems to be at an important key level, where it has a high chance of breaking in the coming time.
We will follow this coin with the possibility of the trend increasing and breaking.
This can be interesting for day trading and long term, it depends on the coming time market view.
Remember, there are no guarantees in the market. Always follow a consistent system based on your own strategies and analysis that are at long-term profitable.
The reason for expecting this coin can increase
Activation of a new trend with the possibility of starting a new cycle.
Good times, everyone.
This update is not trading or financial advice.
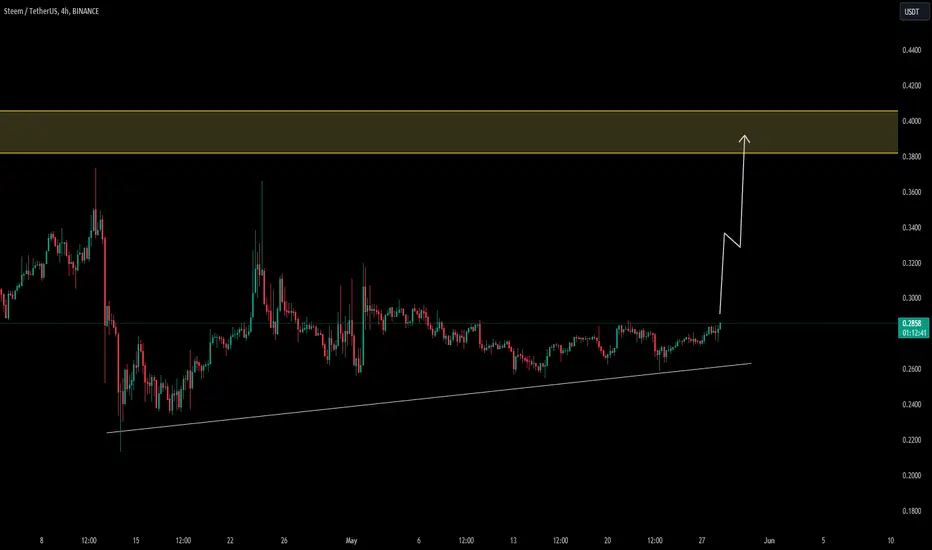
STEEM NEW INCREASE FLOWI hope you all are doing well and navigating the crypto market with the best strategies that are possible for you.
This update is for STEEMUSDT.
STEEMS seems on interesting zone which allows the possibility high for a new break.
STEEM seems to be at an important key level, where it has a high chance of breaking in the coming time.
We will follow this coin with the possibility of the trend increasing and breaking.
Remember, there are no guarantees in the market. Always follow a consistent system based on your own strategies and analysis that are long-term profitable.
The reason for expecting this coin can increase
Activation of a new trend with the possibility of starting a new cycle.
Good times, everyone.
This update is not trading or financial advice.
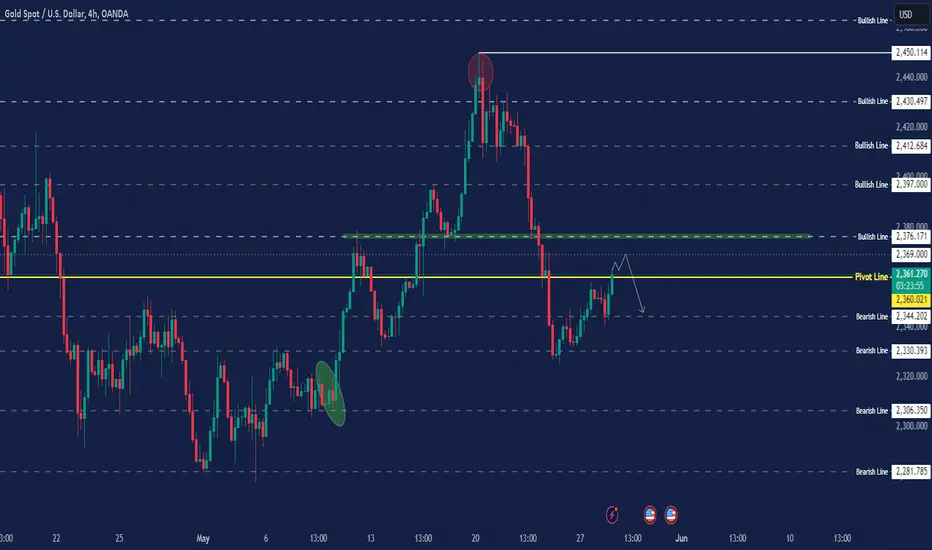
GOLD FORECASTThe current analysis indicates a Bearish trend for OANDA:XAUUSD , provided it stays above the PIVOT LINE at 2360, and it's possible to touch 2369 as well then it'll start the bullish trend. The prevailing Bearish pressure suggests that if trading remains below 2360, the trend will continue a strong downward till 2330.
Key Levels:
Bullish Line: 2376, 2397, 2412
Pivot Line: 2360
Bearish Line: 2344, 2330, 2306
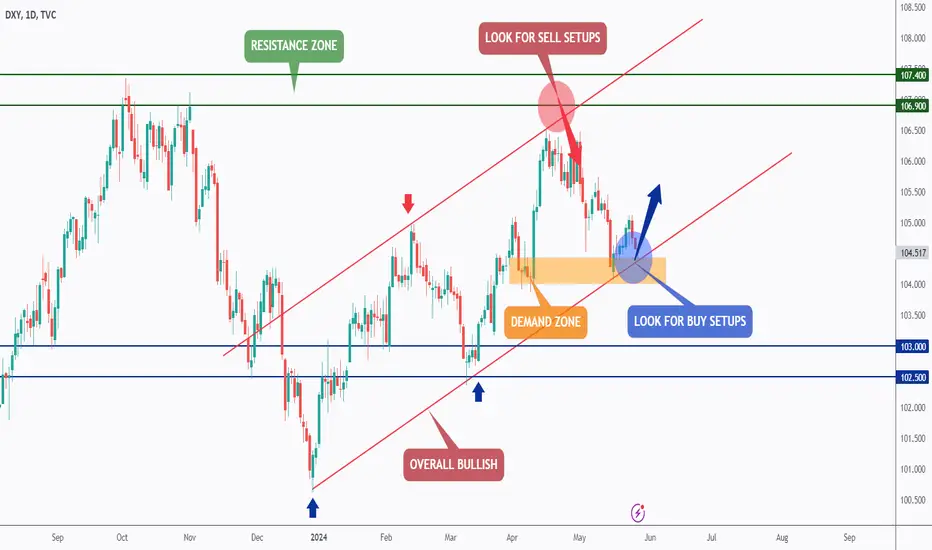
DXY - Are You Ready?📈Hello TradingView Family / Fellow Traders. This is Richard, also known as theSignalyst.
📉 DXY has been overall bullish trading within the rising channel marked in red.
Currently, it is undergoing a correction phase, and approaching the lower bound of the channel.
Moreover, it is retesting a strong demand zone highlighted in orange.
🏹 Thus, the highlighted blue circle is a strong area to look for buy setups as it is the intersection of the orange demand and lower red trendline.
📚 As per my trading style:
As #DXY is hovering around the blue circle zone, I will be looking for bullish reversal setups (like a double bottom pattern, trendline break , and so on...)
📚 Always follow your trading plan regarding entry, risk management, and trade management.
Good luck!
All Strategies Are Good; If Managed Properly!
~Rich
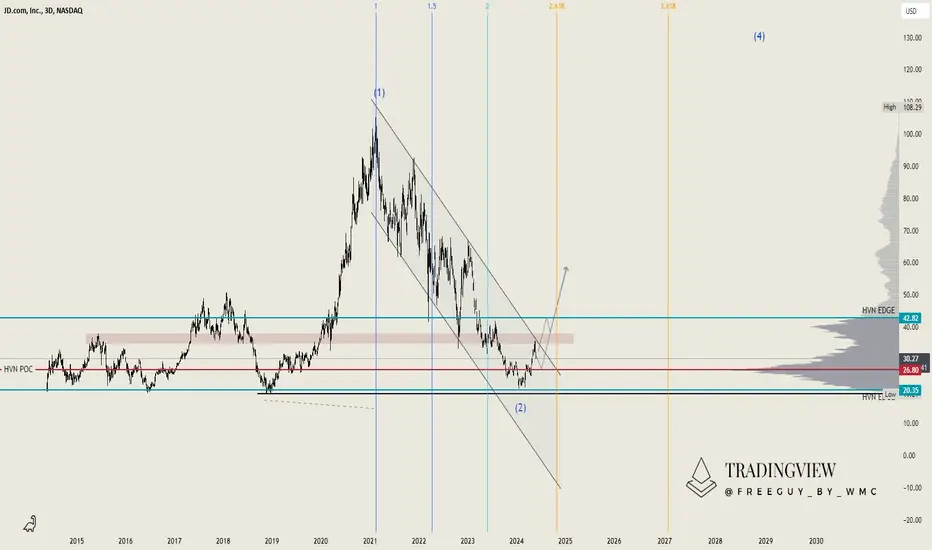
JD.com (JD): Key Levels to Watch Amid Potential BreakoutFor the Chinese stock JD.com listed on the Nasdaq, we observe a significant pattern. Initially, we had a prolonged sideways movement that concluded with an initial surge, establishing the current resistance zone. This zone held twice before the price fell through.
Starting from point X in our Elliott Wave count in November 2018, we saw a rapid increase of approximately 470% in a short period. However, this was followed by a steep sell-off, leading to the formation of Wave (2) within a trend channel.
The correction's time horizon places it in the perfect zone, typically between 2 and 2.618 on the higher time frame, which is a good indicator that this could indeed be Wave (2). To continue the upward movement, it is crucial for JD.com to flip this resistance zone.
The current question is whether the price will first return to the High-Volume Node Point of Control (POC) or break out upwards directly. Flipping the support-resistance zone will be key for any significant upward momentum.
We'll be closely monitoring these levels to determine the next move.
Zooming in on the 12-hour timeframe, we can observe the scenario at the end of the assumed Wave (2). This pattern is characteristic of what we like to see at the conclusion of Wave 2. Initially, we experienced an accumulation phase, which transitioned into a manipulation phase, followed by an expansion phase. This sequence is generally a positive sign.
Currently, we are witnessing a pullback after touching the resistance level. Despite this, we maintain our outlook that the price should continue to rise and not retest the $20 mark.
There's a breakout gap that partially filled but remains open near the bottom. This gap formed just before we entered the expansion phase, and it's a critical point to consider.
Given the ongoing volatility in the Chinese market and the uncertainty among investors, we remain cautious. We are closely watching how JD.com behaves within the $24.50 to $26.80 range. With a drop towards the gap close near $21, we will consider making significant buys.
If the price breaks out upwards, we will look for opportunities to enter positions.
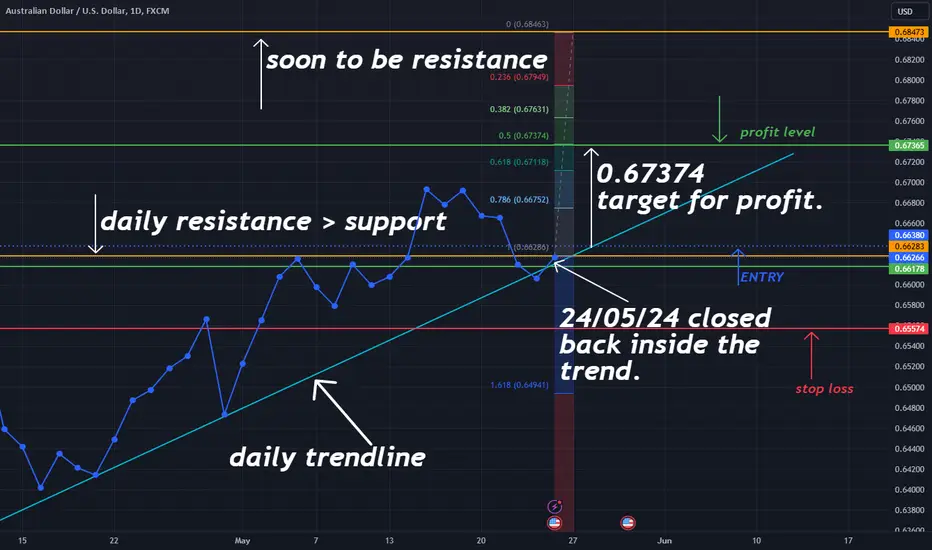
AUDUSD - The long roadevening traders, looking at this trend it seems, that after the daily candle on the 23/05/2024 closed on the outside of the trendline (due to the news) that on the 24/05/24 the pair regained the strength to then push back up and the daily candle has set stone back into the trend. is this a continuation? to me personally i feel this shall carry on. i have set a target for %50 on the fib level reaching to the next resistance level. do you agree? or perhaps think differently? either way, please share your thoughts! happy trading everybody! good luck! =).
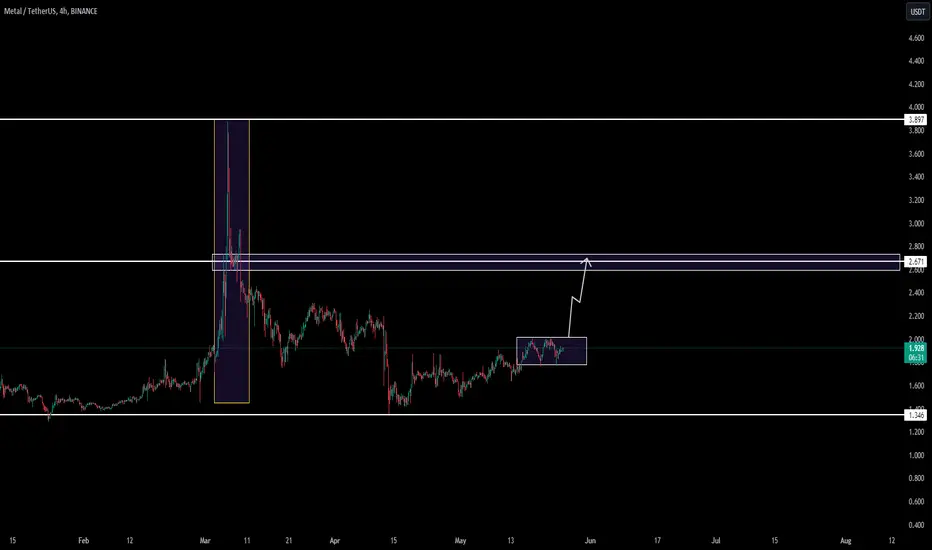
MTL TRENDING NEW LONGHi Traders,
I hope you all are doing well and navigating the crypto market with your best strategies.
This update is for MTLUSDT.
MTL is looking interesting over the next time frames and may show increased volume. That's why we're keeping an eye on this coin.
$2.00 is a key confirmation zone. If the coin breaks this level, there's a high chance it could reach $2.68
Remember, there are no guarantees in the market. Always follow a consistent system based on your own strategies and analysis.
Good times, everyone.
This update is not trading or financial advice.
xauusd analysis for the week 27/52024- 31/07/2024the last week we have witnessed the biggest fall in a week in last 5 months. what will be going to happen in the coming week is much anticipated thing for traders.
our viewpoint is there will be an upward correction in the trend and the retracement zone for the market is from 2327-2333 area and the growing geopolitical tension in the middle east will also be an add on factor for this correction.
if the market goes below 2321 area of support then we can see a downfall till 2275 extended up to 2253.
bullish targets:
2343
2355
2363
2376
like share and follow us
post your comments to enlighten us with your view points