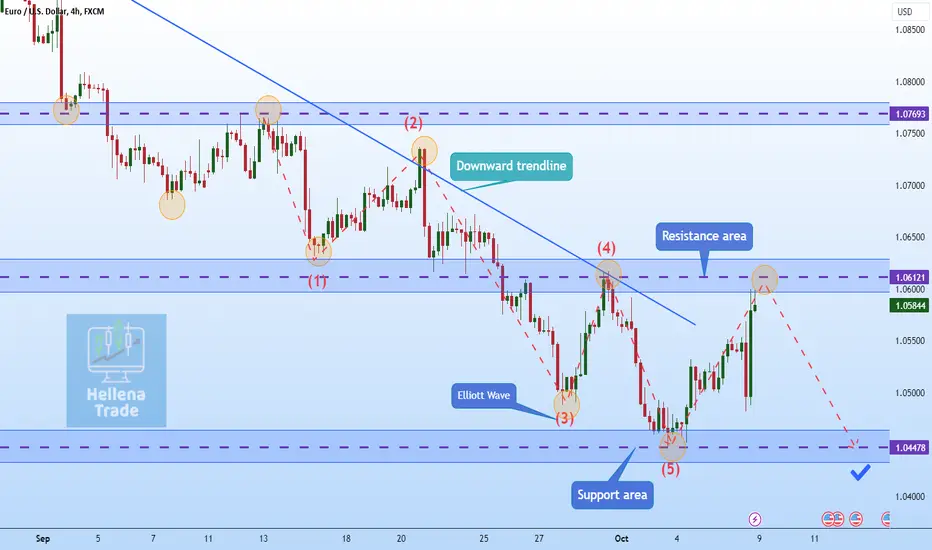
Hellena | EUR/USD (4H): Short to support area is 1.04000.I assume that the price will continue to move in a sideways movement. The resistance area is 1.06121, support area is 1.04000. I expect movement to the support area and consider only short positions.
Manage your capital correctly and competently! Only enter trades based on reliable patterns!
Trendanalyisis
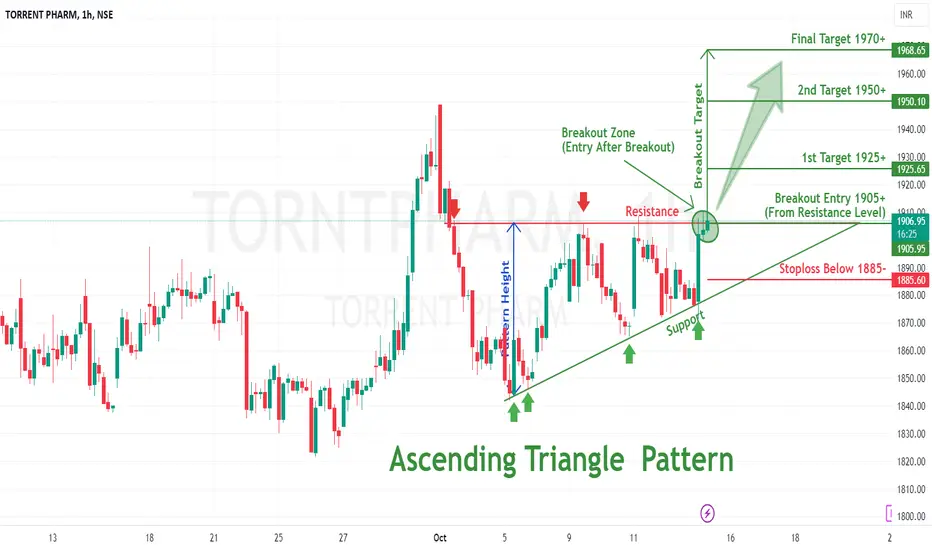
Ascending Triangle pattern breakout in TORNTPHARMTORRENT PHARMA LTD
Key highlights: 💡⚡
✅On 1Hour Time Frame Stock Showing Breakout of Ascending triangle Pattern.
✅Strong Bullish Candlestick Form on this timeframe.
✅It can give movement up to the Breakout target of 1970+.
✅Can Go Long in this stock by placing a stop loss below 1885-.
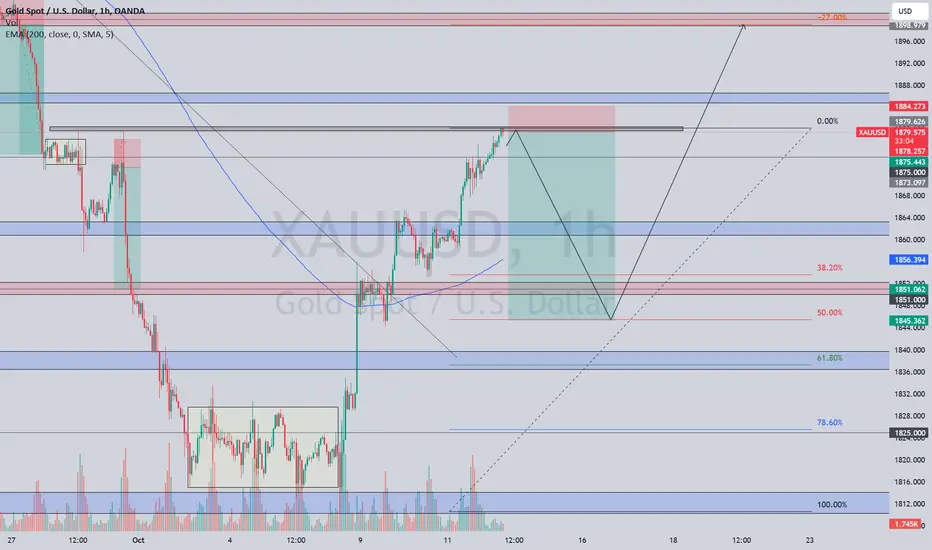
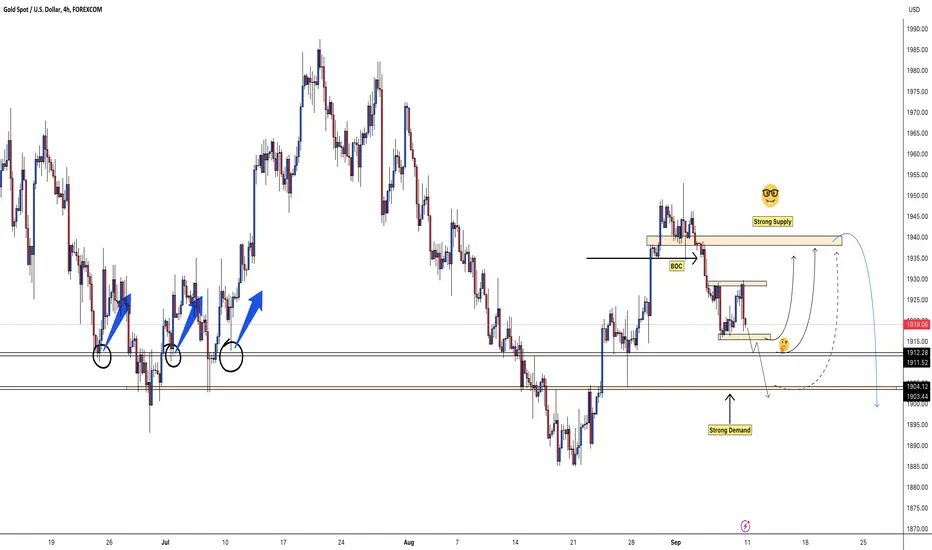
GOLD, ShortGold has been able to fill liquidity to 1879.800 and could correct to 1845 to fulfill Fibonacci retracement to 50% before a possible surge up to 1900 in the coming days.
The PPI News on Wednesday, 11th October was a positive news for the greenback (Dollar index) and the CPI and UoM Consumer Sentiment News is coming on Thursday and Friday, 12th/13th October.
Usually, the CPI news is negative for Gold so let's see how it could determine the direction of the gold market.
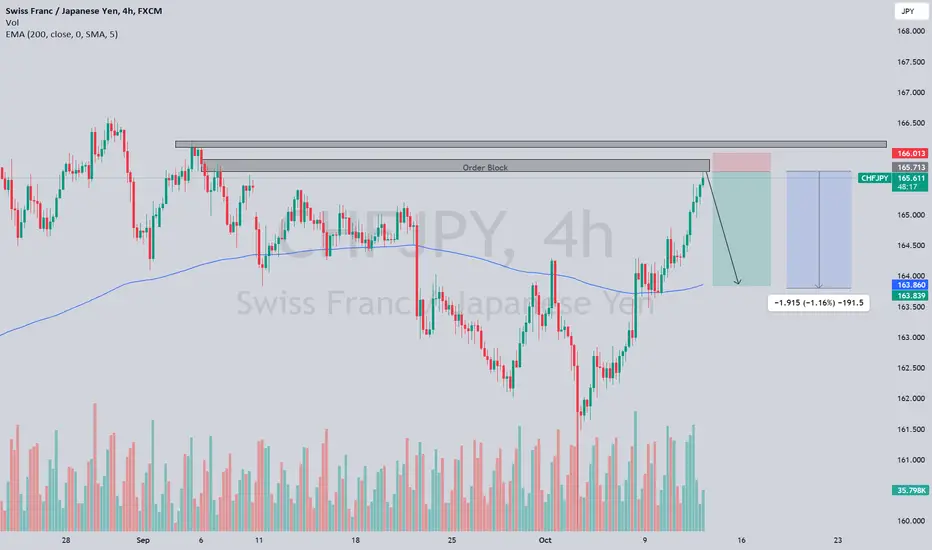
CHFJPY, ShortA supply order is ripe at165.719 where FVG is filled giving the structure a good balance to short more than 150 pips to retest the Daily EMA-20 or the 4Hr EMA-200.
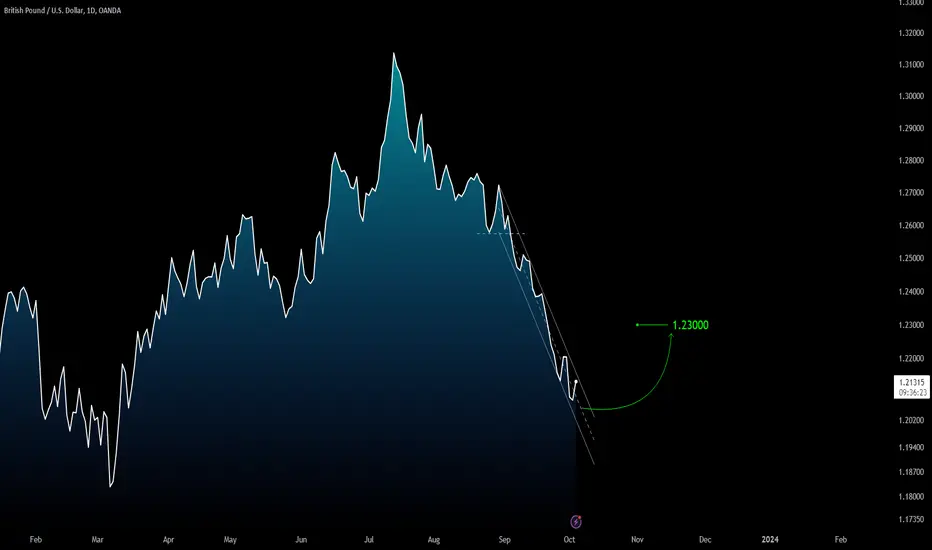
GBPUSD: Bullish reaction is coming?Although we cannot yet rule out a new bottom on daily chart, from a technical point of view, we are approaching an interesting support area, and this should trigger a bullish reaction on the pair. That said, our short-term view is bullish and we will follow the development in the next few hours on intraday chart (Reversal Pattern formation is necessary to trigger the rally).
Trade with care
Like | Share | Comment
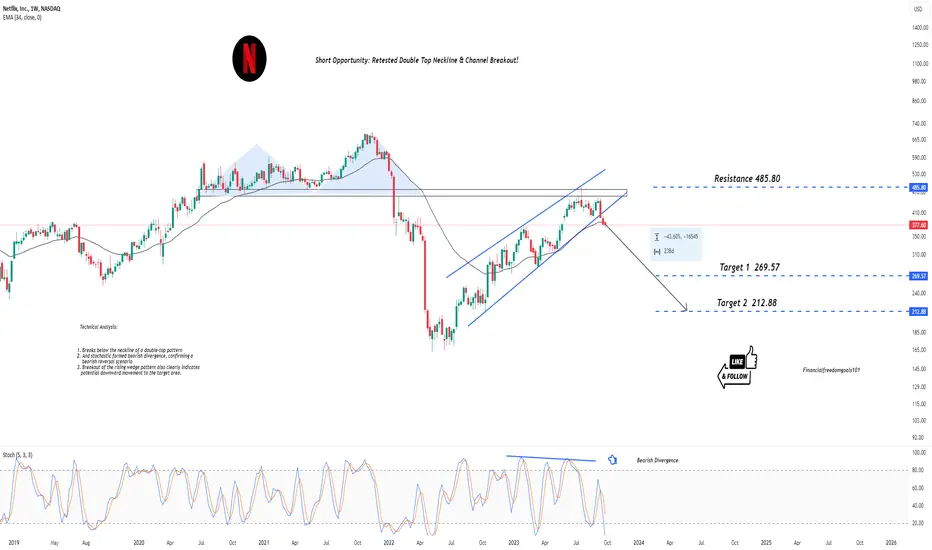
Netflix's Bullish Trend Ending: Traders, Prepare for Downtrend!Hi Realistic Traders. Here's my price action analysis on Netflix
In our close examination of NFLX, the streaming titan, a compelling narrative unfolds. Initially, a double-top pattern emerged between July 2020 and January 2022, followed by a significant breakout from the neckline. This breakout confirmed a bearish reversal, resulting in a remarkable 70% decline from its peak.
However, the plot deepens. NFLX recently revisited its double-top pattern's neckline while concurrently crafting a channel chart pattern. Adding to the intrigue, NFLX struggled to regain its former heights and descended below both the lower trendline and the dynamic support line, a classic sign of a sustained bearish trajectory.
Not to be overlooked, the Stochastic indicator chimed in with a bearish divergence, providing further validation for the impending downward movement.
Our target price? Set conservatively at under $300.
Traders, prepare for a captivating journey ahead!
It is essential to note that the analysis will no longer hold validity once the target/resistance area is reached.
Please support the channel by engaging with the content, using the rocket button, and sharing your opinions in the comments below!
Disclaimer:
"Please note that this analysis is solely for educational purposes and should not be considered a recommendation to take a long or short position on NASDAQ:NFLX ."
SP500: Consolidation in Short Term?Hi Traders!
Medium and Long-Term Trends are bullish, but in short term SP500 could remain bearish even after a pullback. If we look at daily chart, the Price Action is approaching an important support area around 4,305, if from here it triggers a bullish leg, it's possible a harmonic structure formation (for us, bearish). Having said that, we have a first Target Area around 4,275 and subsequently 4,220.
Trade with care
Like | Share | Comment

Broadening Wedge Pattern breakout in INDIGOINTERGLOBE AVIATION LTD
Key highlights: 💡⚡
✅On 1Hour Time Frame Stock Showing Breakout of Broadening Wedge Pattern.
✅ Strong Bullish Candlestick Form on this timeframe.
✅It can give movement up to the Breakout target of 2475+.
✅Can Go Long in this stock by placing a stop loss below 2380-.

Ascending Triangle breakdown in CANFINHOMECANFIN HOMES LTD
Key highlights: 💡⚡
✅On 1Hour Time Frame Stock Showing Breakdown of Ascending Triangle Pattern .
✅ Strong bearish Candlestick Form on this timeframe.
✅It can give movement up to the Breakdown target of 736-.
✅Can Go short in this stock by placing a stop loss above 770+.

Triangle Pattern Breakout in ONGC Elliott Wave Analysis.:-
View 1:-
Triangle pattern
In connecting wave triangle pattern seems to be given a breakout and a retracement was taken place. we can accumulate with 1938 as stop loss. .
there are some alternative views. will share in next chart.

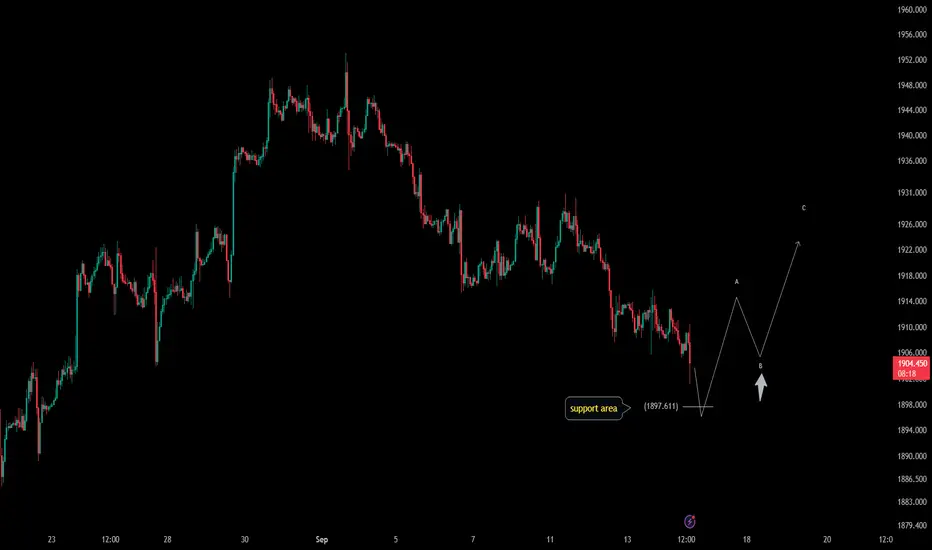
GOLD: rebound in short term?From a technical point of view, on intraday chart we have an interesting support area just below 1900. If a bullish reaction appears, wait for the clear signal (wave A) and try to take Long position on pullback (wave B).
Trade with care
Like | Share | Comment
PREVIOUS SETUP
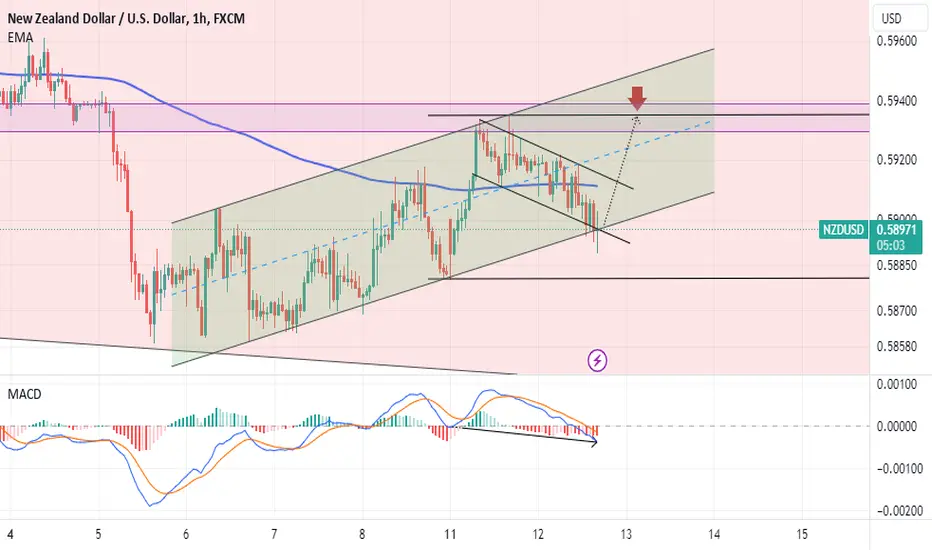
#NZDUSD short term buying opportunityprice bullish corrective move forming a bullish channel as you can see clearly in the chart and now price is testing this channel lower boundary which acting as a support. Moreover, price also testing its short term bearish channel line and currently testing its return line which add to possibility of bullish expected move.
Also in 30 minutes chart we can see price formed hammer #candle_stick formation and failed to close below its previous low.
And in 1H time frame we have reverse bullish divergence.
USDCAD: Rebound in short term?In the last few sessions we have seen an interesting consolidation on intraday chart. From a technical perspective, this bearish leg could also be a 12345 impulsive structure. That said, some corrective structure is possible in short term. In this specific case, the problem is not "if" we reach the Target, but "when" we will reach it and from where the technical rebound will begin. Target1 at 1.36 with long position accumulation strategy (Buy the Dip).
Trade with care
Like | Share | Comment

Correction in Banknifty. Zig Zag, flat, triangle, Elliott Wave Analysis:-
A wave seems to be a Zig-Zag A wave .
B wave to be a connecting wave .
C wave to be extended wave of Zig-Zag C wave
If it didn't break 46369, if broken the 46369 then the flat takes place and zig zag leave the place.
.
View 1:-
Regular flat
If it did not break B wave and breaks the low of A wave then the flat is regular flat and it may be considered as a C wave of previous zig zag wave ..
View 2:-
Triangle pattern
Either the B wave high has crossed or not it the C wave didn't break the low of A wave and it consolidates between A and B wave's .This would lead to Triangle pattern .
I'm not a SEBI registered advisor.
Kindly before taking a trade do your research/ consult your financial advisor.

xauusdgold is in the range of 1929 up side to 1916 belowbut as we see the chart that break of struture gold has to pull back and continiue fall as technical analysis. but its trading anything could happend lets stay with trend and set our goal. happy weekend to you all if you have any qustions please write in the comment below.
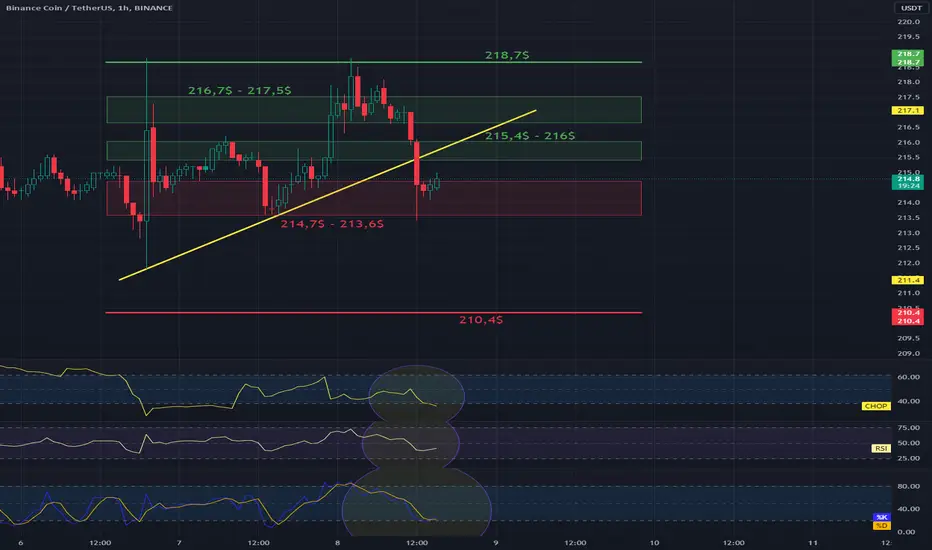
BNB/USDDT 1HInterval Review ChartHello everyone, let's take a look at the BNB to USDT chart on a one hour time frame. As you can see, the price dynamically moved lower from the local upward trend line.
When we unfold the trend based fib extension grid, we see that the price remains at the upper limit of the support zone from $214.7 to $213.6, but we can see a decline towards the support level at $210.4.
Looking the other way, we have the first resistance zone from $215.4 to $216, then the second zone from $216.7 to $217.5, and then strong resistance at $218.7.
Looking at the CHOP indicator, we see that most of the energy has been used, the RSI shows a strong recovery with room for further decline, but the STOCH indicator has exhausted the energy, which may indicate a moment of recovery.
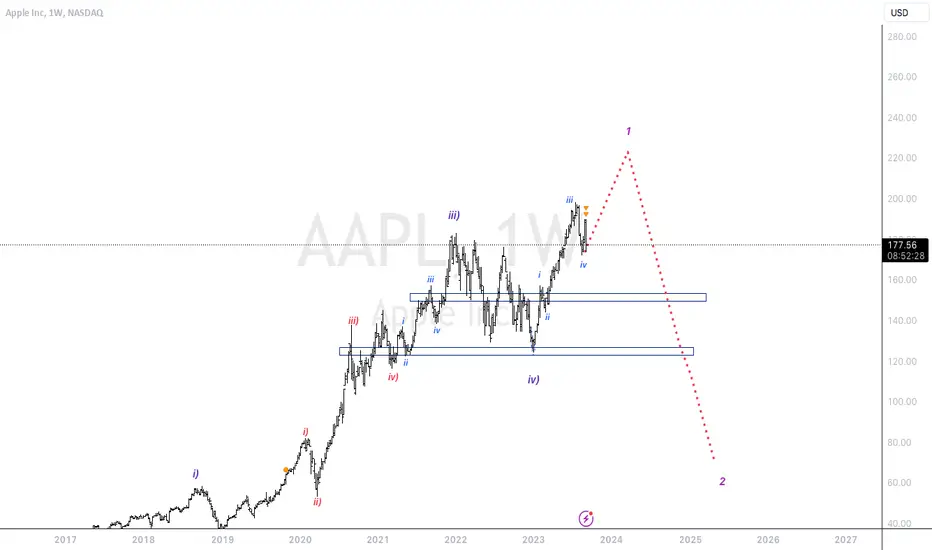
impulse wave of APPLE. alternative view.Elliott Wave Analysis:-
Everything was explained in the previous chart. Link was attached below.
this is an alternative view for previous chart.
final impulse was a doubt.
I'm not a SEBI registered advisor.
Before taking a trade do your own analysis or consult a financial advisor.
Potential Bullish move continuationAs it is clear in the chart price has tested 1H Clean Break area acting as Support for the second time in the form of #double_bottom formation and also formed a bullish standard divergence which add to possibility of bullish move.
Also in 4H time frame price only took out liquidity from the previous low and failed to close below as you can see the arrow line and price failure to close below.

The bearish div that no one is talking about...yetbtc is primed to make new lows this year, all the ETF talk is about to catch a lot of traders and hodlers off-guard...stay safe frens

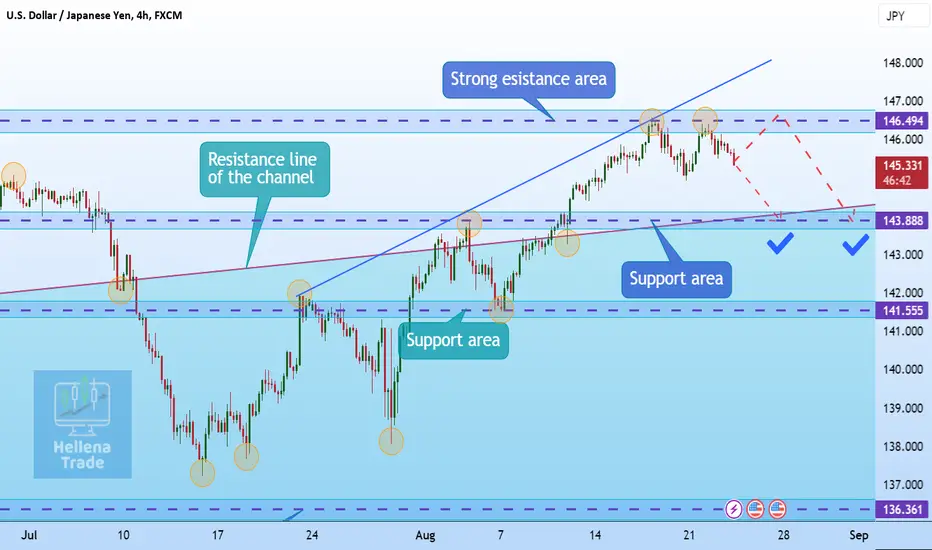
Hellena | USD/JPY (4H): Short to support area 143.888.Dear colleagues, I assume that the price will reach the support area of 143.888. Before that, the price may update the high.
Manage your capital correctly and competently! Only enter trades based on reliable patterns!
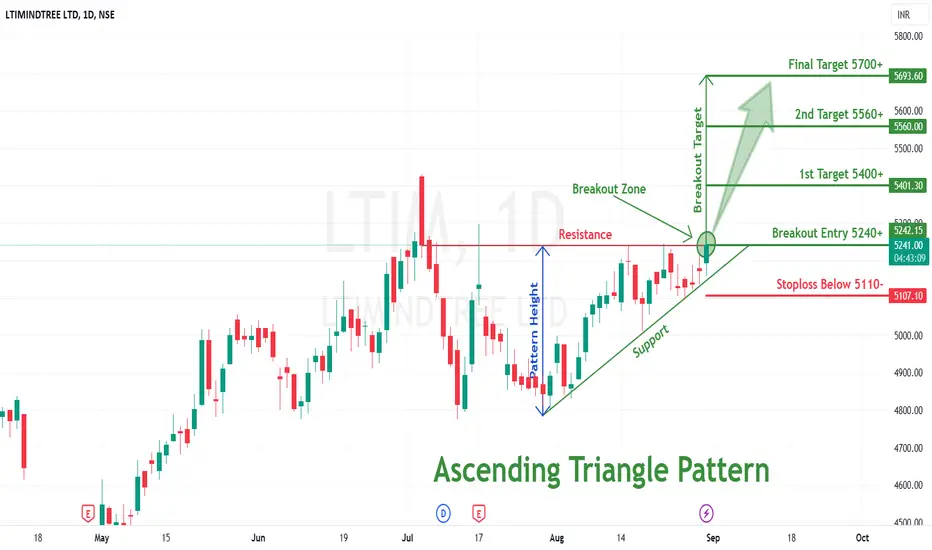
Ascending Triangle pattern breakout in LITIMINDTREELITIMINDTREE LTD
Key highlights: 💡⚡
✅On 1Day Time Frame Stock Showing Breakout of Ascending triangle Pattern .
✅Strong Bullish Candlestick Form on this timeframe.
✅It can give movement up to the Breakout target of 5700+.
✅Can Go short in this stock by placing a stop loss below 5110-.
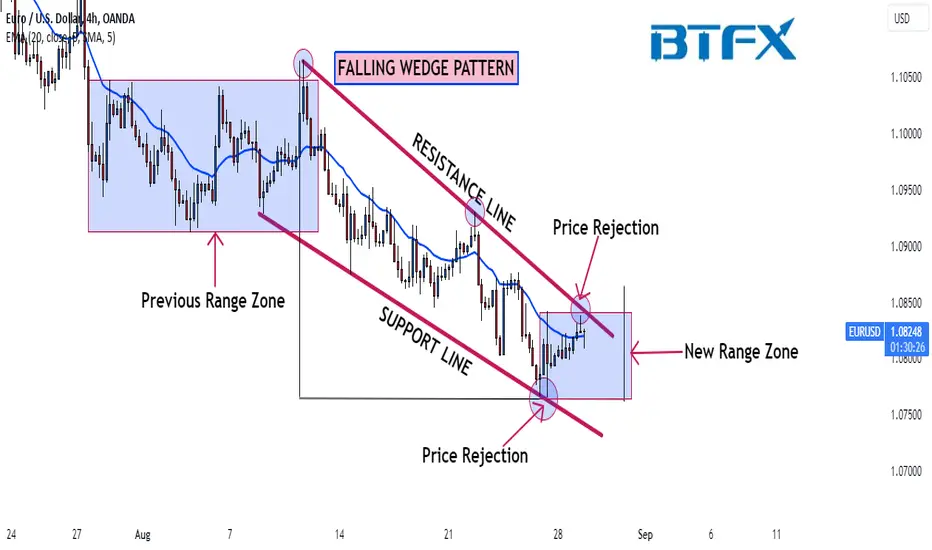
BluetonaFX - EURUSD Falling Wedge Looking For Potential BreakHi Traders!
EURUSD is currently in a falling wedge and is awaiting a break of the new range zone.
There have been price rejections to both the upside and downside, which we have highlighted on the chart. Falling wedge patterns are commonly known as reversal patterns; however, there is a lack of bullish momentum here, and the failure to continue above our EMA confirms this.
The levels to watch out for are 1.07658 on the downside, as this is where we had the price rejection to the downside. If we get a break at this level, continuation towards 1.07000 looks likely.
To the upside, the level to watch out for is 1.08384; this is the high of the price rejection candle and the resistance line of the wedge. However, we need bullish momentum if there is to be a possible move to the upside.
We would love to hear your thoughts on this in the comments section. Please also do not forget to press the like button and follow for more updates.
Thank you for your support.
BluetonaFX
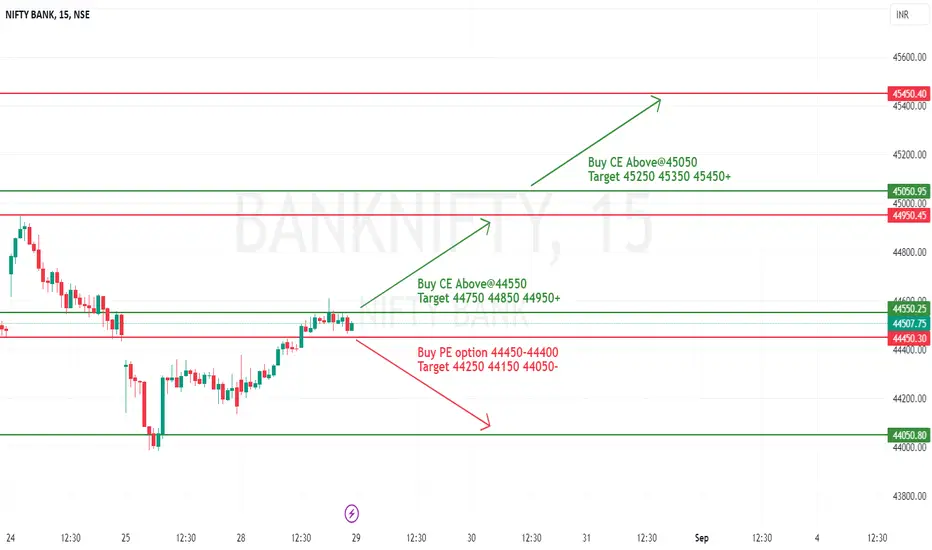
[INTRADAY] #BANKNIFTY PE & CE Levels(29/08/2023) Today will be gap up opening in BANKNIFTY . After opening if banknifty sustain above 44550 level then possible upside rally of 400-500 points upto 44950 Level. And this rally can extend for another 400 points if it gives breakout of 45050 level. Any Major downside only expected in case banknifty starts trading below 44450 level.