Crypto market review: Bitcoin, ETH, and Altcoins Setting Up for Prepared a new in-depth crypto market video update covering BTC, Ethereum, and key altcoins. Here’s a quick summary of the current landscape and what I’m tracking in the charts:
We’ll begin with Bitcoin. After the Fed’s decision, BTC showed a constructive shakeout and has been consolidating tightly around the same range for three weeks. I previously anticipated resistance near the 1.23 area and expected a sideways phase within the 1.15–1.13 support zone. That’s exactly what we’re seeing—shakeouts and quick recoveries. As long as we stay above 1.13 structurally, and especially above yesterday’s highs short-term, I expect BTC to push higher toward the 1.26–1.30 resistance zone.
Institutional buying during the post-Fed dip has been significant. Volume on Coinbase and Binance indicates strong participation, and Bitcoin treasuries have been accumulating. This bolsters confidence in the underlying trend structure.
I wrote in mid-July about BTC’s broader macro structure—this resistance region may trigger a prolonged consolidation, but ideally without breaking June lows. Short-term bias remains bullish.
Ethereum remains the strongest large-cap altcoin. It has respected the 8EMA on pullbacks and shows strength to target 4300–5100 in the coming weeks. It continues to lead risk-on sentiment.
XRP has been deep in consolidation, but we may be seeing a higher low forming. Any rally in BTC and ETH could lift XRP toward 3.30–4.60 levels, possibly even 5.00.
Solana showed strong action through late July, pulling back into mid-term support. As long as this structure holds, I expect upside toward 220–230 and potentially reclaiming ATH zones.
Hyperliquid has been a laggard but held its key macro support. If yesterday marked a bottom, I’ll be watching for higher lows and a move toward 55–60.
Other notable setups:
Brett: Both showing impulsive structures from April lows. Brett in particular looks poised for 74–77, potentially retesting May highs around 95.
ONDO: Recovering key zones and shaping a potential bottoming pattern.
SUI: Leading structure from July lows. After a likely wave-one completion, it could extend toward 5.15–7.70 before topping.
RENDER: Looks to have finished its correction. Potential long-term upside beyond May highs; the macro uptrend might already be underway.
SUPER: Since July breakout, forming a strong trend structure. If it holds the higher low, could reach 1.20–1.46 in coming weeks.
TON: Slow mover, but the macro pattern suggests a bottom with potential toward 4.60 short-term.
LINK: Hasn’t finished its move. Watching for 21–22 as a next target.
FET / Fetch.AI: Macro structure looks great. Watching for recovery from June lows with potential for strong continuation if structure holds.
Trump Coin: In a diagonal pattern post-failed impulsive breakout. If higher lows hold, watch for rally toward 13–14.
LTC: Linear and clean structure. Looks ready to push toward 130–145 before potential base-building.
UNI: Targeting 14–18+ in wave continuation if structure holds.
Let me know in the comments if there’s a specific coin you’d like me to go over. I’ll include it in future updates or make a quick standalone video.
Thanks for watching, and I wish you a successful trading week ahead. Let’s see how far this rally can go through the rest of the summer!
Trend Analysis

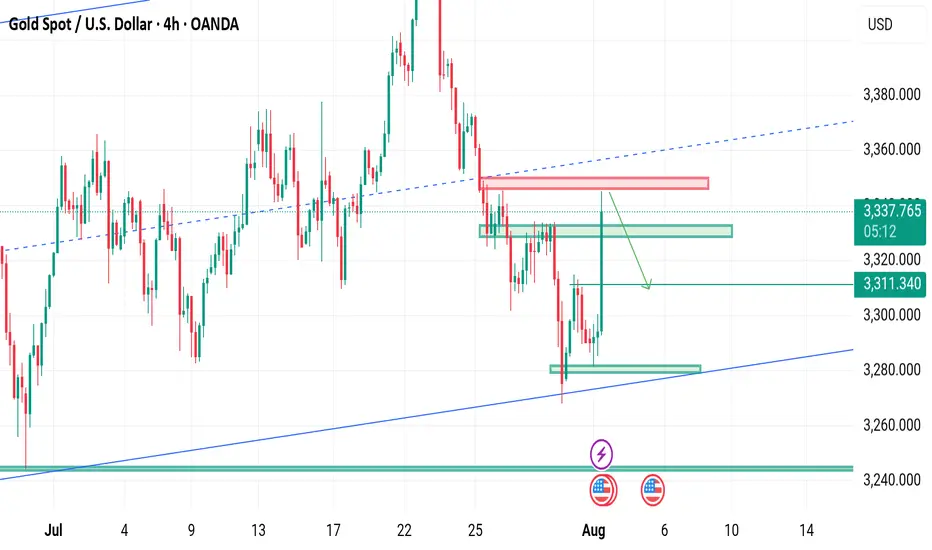
Selling activated ▪️I'm expecting selling at 3345-3348 from my zones although I took a small risk of sell at 3342
And my Targets will be 3333-3324
▪️Secondly if H4 candle closing below 3250 I will not sell till next stability
This trade is based on liquidity sweeps
#XAUUSD
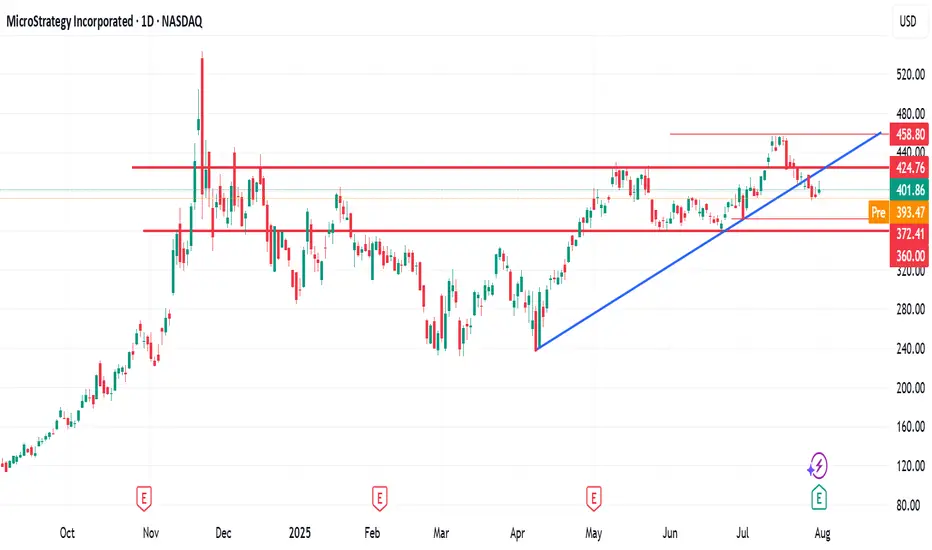
$372 - $360 is imminent$372 - $360 is imminent.
Following a break below the highlighted key support TL, MSTR fall to as low as $370 to $360
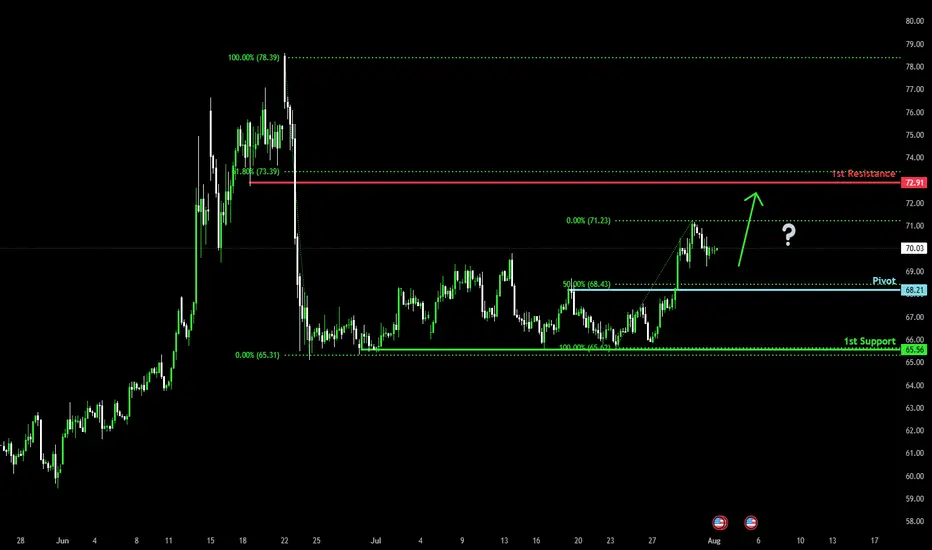
Falling towards 50% Fibonacci support?WTI Oil (XTI/USD) is falling towards the pivot, which has been identified as a pullback support and could bounce to the 1st resistance.
Pivot: 68.21
1st Support: 65.56
1st Resistance: 72.91
Risk Warning:
Trading Forex and CFDs carries a high level of risk to your capital and you should only trade with money you can afford to lose. Trading Forex and CFDs may not be suitable for all investors, so please ensure that you fully understand the risks involved and seek independent advice if necessary.
Disclaimer:
The above opinions given constitute general market commentary, and do not constitute the opinion or advice of IC Markets or any form of personal or investment advice.
Any opinions, news, research, analyses, prices, other information, or links to third-party sites contained on this website are provided on an "as-is" basis, are intended only to be informative, is not an advice nor a recommendation, nor research, or a record of our trading prices, or an offer of, or solicitation for a transaction in any financial instrument and thus should not be treated as such. The information provided does not involve any specific investment objectives, financial situation and needs of any specific person who may receive it. Please be aware, that past performance is not a reliable indicator of future performance and/or results. Past Performance or Forward-looking scenarios based upon the reasonable beliefs of the third-party provider are not a guarantee of future performance. Actual results may differ materially from those anticipated in forward-looking or past performance statements. IC Markets makes no representation or warranty and assumes no liability as to the accuracy or completeness of the information provided, nor any loss arising from any investment based on a recommendation, forecast or any information supplied by any third-party.
Pullback and then down!I would like to see this daily candle as a pullback to the trendline. So I expect the price to fall.

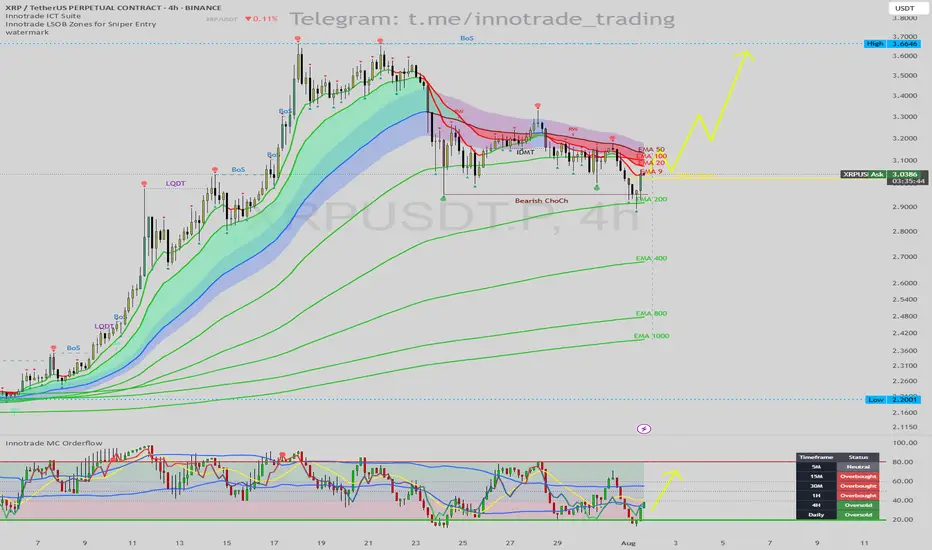
XRP/USDT: Bullish Reversal Setup at EMA 200 & Daily OversoldHello traders,
I'm seeing a compelling long setup forming on the XRP/USDT 4H chart. While the immediate trend has been bearish, multiple key indicators are now signaling that a significant bounce or reversal is highly probable.
1. Trend & Context (The "Why")
After a strong uptrend, the price has experienced a pullback, confirmed by a Bearish Change of Character (ChoCh). However, the price has now reached a critical support level where we can look for long opportunities.
Key Price Action Support: The price is currently finding support directly on the EMA 200. This is a major long-term moving average that frequently acts as a strong floor for price during a pullback.
Momentum Exhaustion Signal: The Innotrade MC Orderflow oscillator is giving a powerful confirmation for a potential bottom:
The oscillator is deep in the OVERSOLD zone (below 20), indicating that selling pressure is exhausted.
CRITICAL MTF CONFLUENCE: The Multi-Timeframe Cycle Table is the key to this trade. It shows that both the 4H and Daily timeframes are "Oversold". When higher timeframes like the Daily show exhaustion, it significantly increases the probability of a strong reversal on lower timeframes.
2. Entry, Stop Loss, and Targets (The "How")
This setup provides a clear, high-probability trade plan with a good risk-to-reward ratio.
Entry: An entry around the current price ($3.03 - $3.05) is viable as we are at the EMA 200 support. For a more conservative entry, wait for the MC Orderflow oscillator to cross back above its yellow MA.
Stop Loss (SL): $2.89. This places the stop loss safely below the recent swing low and the EMA 200. A break below this level would invalidate the bullish thesis.
Take Profit (TP) Targets:
TP1: $3.25 (Targeting the cluster of short-term EMAs and the recent swing highs).
TP2: $3.40 (The next logical area of resistance from the previous price structure).
TP3: $3.66 (The major swing high, a longer-term target if the bullish trend resumes).
Conclusion
This trade idea presents a strong case for a long position. The combination of a major technical support level (EMA 200) with a confirmed multi-timeframe momentum exhaustion signal (Daily Oversold) creates a high-probability environment for a bullish reversal.
Disclaimer: This is not financial advice. This analysis is for educational purposes only. Always conduct your own research and manage your risk appropriately.
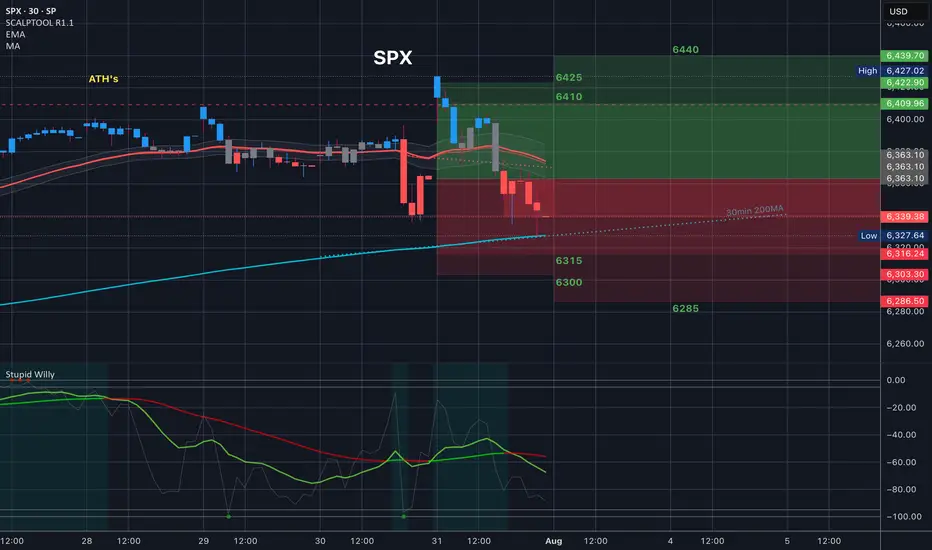
$SPX Analysis, Key Levels & TargetsThis is how last night’s members chart played out and it was amazing. We opened at the top of the implied move and all of the spreads at the top paid as we dropped back to the 30in 200MA
The spreads I took at 6420/6435 but every spread shown here would have done well.
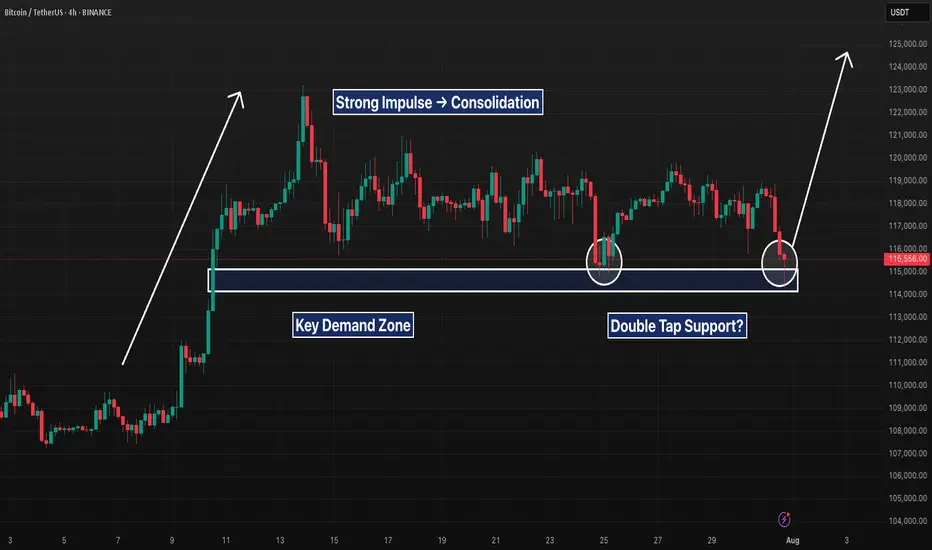
BTC 4H – Support Tapped 2x After Breakout, Will Bulls Step In?Bitcoin is retesting a major demand zone that launched the last breakout. After a sharp impulse move, price has ranged tightly and just tapped this support area for the second time.
A clear double bottom attempt is forming, but failure to hold $115K could open the door to deeper downside. Bulls want to see a quick reclaim of $117K to confirm structure still holds.
Clean levels. Clear reaction zones. Let’s see who takes control.
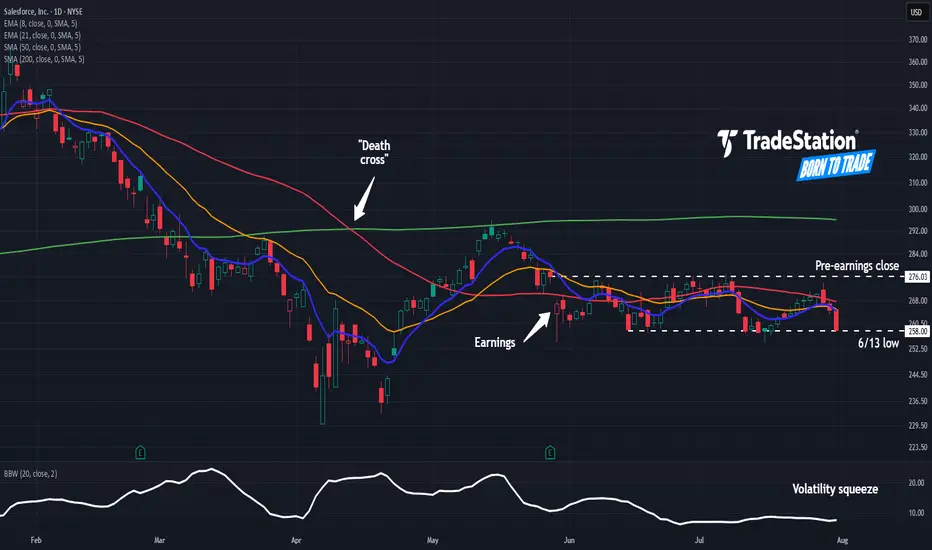
Salesforce May Face DistributionSalesforce has limped as other tech stocks hit new highs, and some traders may think it’s going into distribution.
The first pattern on today’s chart is the bearish price gap on May 29 despite better-than-expected quarterly results. That may reflect waning enthusiasm about the software company’s fundamentals.
Second is the pre-earnings closing price of $276.03. CRM has remained trapped below that level, which may suggest it’s become resistance.
Third is the June 13 low of $258. The stock bounced there in mid-July but may now be at risk of breaking it.
Next, Bollinger Bandwidth has narrowed as the stock formed a tight range between the two levels. Could price movement expand following that period of compression?
Last, the 50-day simple moving average (SMA) had a “death cross” below the 200-day SMA in April. The 8-day exponential moving average (EMA) is also below the 21-day EMA. Those patterns may be consistent with bearishness in the long and short terms.
TradeStation has, for decades, advanced the trading industry, providing access to stocks, options and futures. If you're born to trade, we could be for you. See our Overview for more.
Past performance, whether actual or indicated by historical tests of strategies, is no guarantee of future performance or success. There is a possibility that you may sustain a loss equal to or greater than your entire investment regardless of which asset class you trade (equities, options or futures); therefore, you should not invest or risk money that you cannot afford to lose. Online trading is not suitable for all investors. View the document titled Characteristics and Risks of Standardized Options at www.TradeStation.com . Before trading any asset class, customers must read the relevant risk disclosure statements on www.TradeStation.com . System access and trade placement and execution may be delayed or fail due to market volatility and volume, quote delays, system and software errors, Internet traffic, outages and other factors.
Securities and futures trading is offered to self-directed customers by TradeStation Securities, Inc., a broker-dealer registered with the Securities and Exchange Commission and a futures commission merchant licensed with the Commodity Futures Trading Commission). TradeStation Securities is a member of the Financial Industry Regulatory Authority, the National Futures Association, and a number of exchanges.
TradeStation Securities, Inc. and TradeStation Technologies, Inc. are each wholly owned subsidiaries of TradeStation Group, Inc., both operating, and providing products and services, under the TradeStation brand and trademark. When applying for, or purchasing, accounts, subscriptions, products and services, it is important that you know which company you will be dealing with. Visit www.TradeStation.com for further important information explaining what this means.
Gold Price Outlook: Bearish Trend DevelopingGold has broken below key top resistance, indicating potential for continued downside movement.
The US Dollar's recent rise has slowed amid renewed concerns about the US-China trade truce and profit-taking ahead of this week’s key employment data, following already strong GDP and ADP reports. While the dollar remains supported overall, uncertainty is capping its momentum, indirectly adding short-term volatility to gold.
The price action suggests a bearish breakout from key resistance zones. Momentum is building toward the downside, indicating the market could continue lower unless strong support levels hold. A potential bearish flag or breakdown structure is forming, and if confirmed, we may see a decline toward next support zones.
📍 Key Levels to Watch:
Resistance: 3310 / 3320
Support: 3269 / 3240
If gold remains below the broken resistance and fails to reclaim 3320, the bearish pressure is likely to continue. Watch upcoming employment data as it could add volatility and confirm the direction.
You may find more details in the chart.
Ps: Support with like and comments for better analysis Thanks.

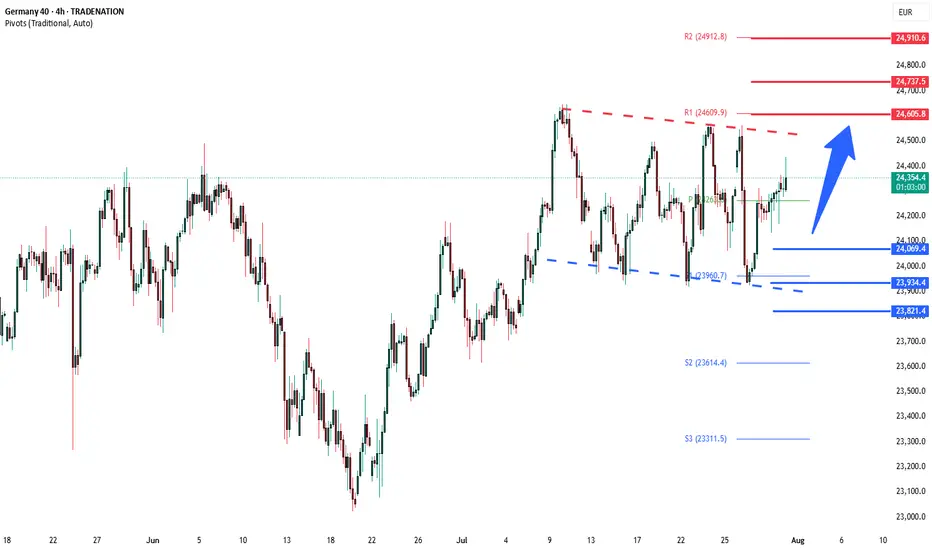
DAX sideways consolidation support at 24070The DAX remains in a bullish trend, with recent price action showing signs of a corrective pullback within the broader uptrend.
Support Zone: 24070 – a key level from previous consolidation. Price is currently testing or approaching this level.
A bullish rebound from 24070 would confirm ongoing upside momentum, with potential targets at:
24605 – initial resistance
24740 – psychological and structural level
24910 – extended resistance on the longer-term chart
Bearish Scenario:
A confirmed break and daily close below 24070 would weaken the bullish outlook and suggest deeper downside risk toward:
23935 – minor support
23820 – stronger support and potential demand zone
Outlook:
Bullish bias remains intact while the DAX holds above 23925. A sustained break below this level could shift momentum to the downside in the short term.
This communication is for informational purposes only and should not be viewed as any form of recommendation as to a particular course of action or as investment advice. It is not intended as an offer or solicitation for the purchase or sale of any financial instrument or as an official confirmation of any transaction. Opinions, estimates and assumptions expressed herein are made as of the date of this communication and are subject to change without notice. This communication has been prepared based upon information, including market prices, data and other information, believed to be reliable; however, Trade Nation does not warrant its completeness or accuracy. All market prices and market data contained in or attached to this communication are indicative and subject to change without notice.
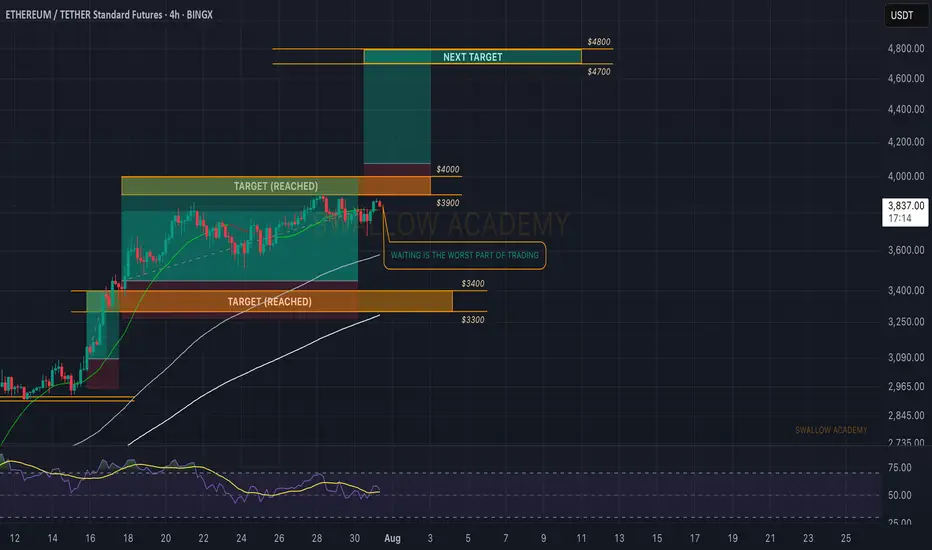
Ethereum (ETH): Waiting Is The Worst Part Of Trading | $4800ETH still looks good; we hit the target lately and now we are looking for the breakout to happen, which will give us another opportunity for a long position towards the $4800 zone.
Swallow Academy
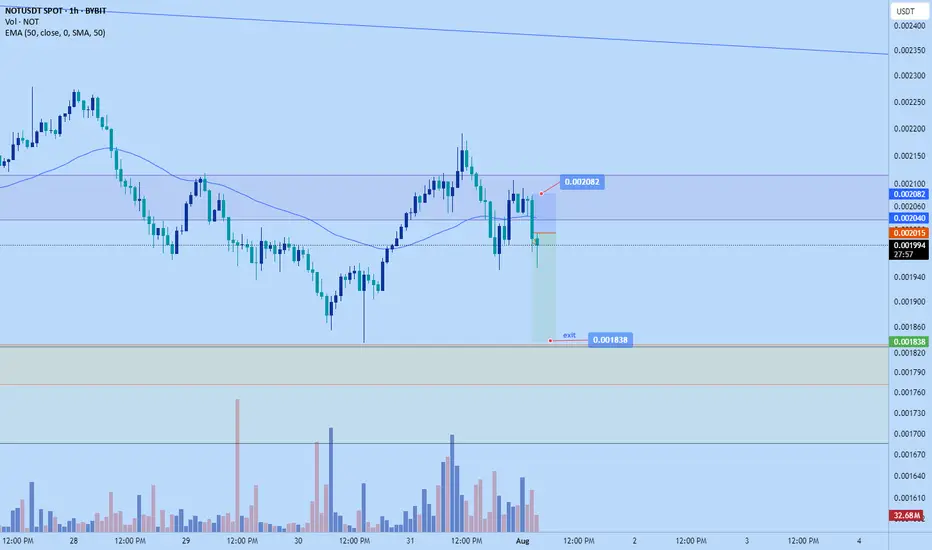
Notcoin short to $0.001838Just now opened up a short position on notcoin. Aiming for $0.001838
roughly 2.64 RR
DTT strategy, learn more on X
Sl: $0.001838
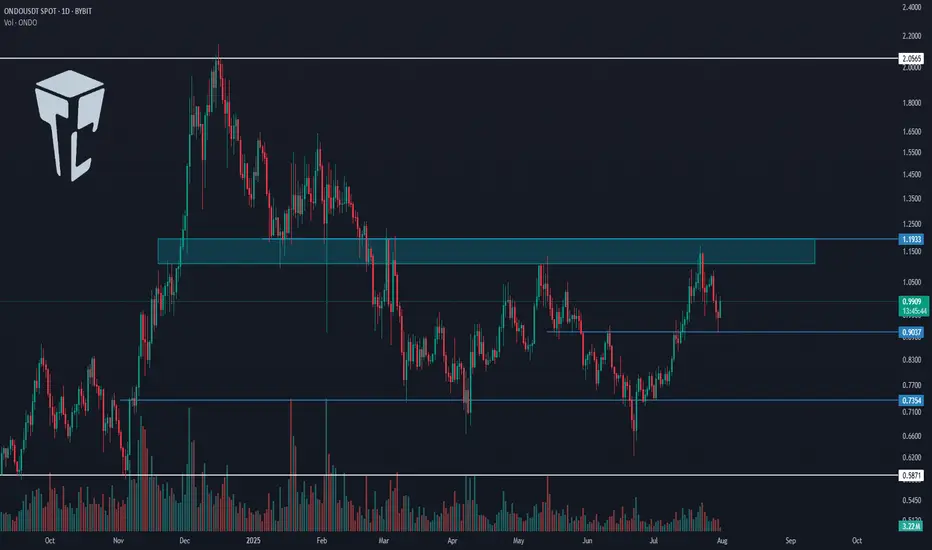
TradeCityPro | ONDO Builds Strength Beneath Key Supply Barrier👋 Welcome to TradeCity Pro!
In this analysis, I want to review the ONDO coin for you — one of the RWA projects, currently ranked 37th on CoinMarketCap with a market cap of $2.93 billion.
📅 Daily Timeframe
In the daily timeframe, as you can see, this coin has formed a range box between the levels of 0.7354 and 1.1933, and the price is currently sitting in the upper half of this box.
✔️ At the moment, the price is hovering around 0.9037, and it’s forming a higher low above 0.7354. If this low gets confirmed, the probability of breaking above 1.1933 increases.
⭐ The 1.1933 zone is a very significant supply level that was previously acting as support in late 2024, and after being broken, has since acted multiple times as resistance.
📊 If this area breaks, we can open a long position, or even buy this coin in spot. Personally, if this trigger is broken, I’ll open a long-term long position.
✨ The target for this position is 2.0565, and once the price reaches this level, we can take profits and consider a spot buy.
📝 Final Thoughts
This analysis reflects our opinions and is not financial advice.
Share your thoughts in the comments, and don’t forget to share this analysis with your friends! ❤️
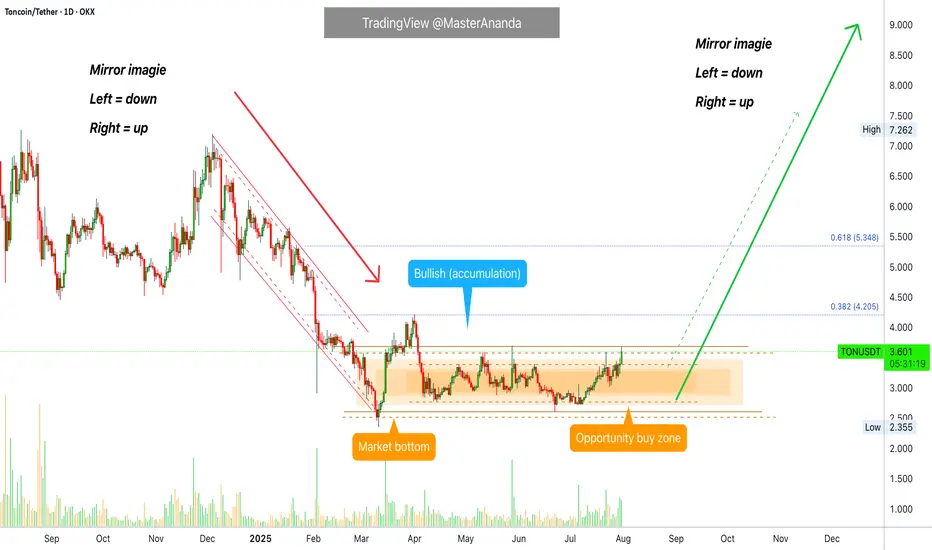
Toncoin Goes Bullish · 4X Leverage · Bottom Prices · OpportunityToncoin is breaking the sideways consolidation pattern. Today we have the highest price since late May, already two months ago, and rising volume. When you see how flat the action at the bottom is, you can tell how strong the bullish breakout that follows will me.
This is a friendly reminder because Toncoin will be huge in this altcoins market bullish cycle. I want you want you to be in, I want you to collect big projects, 1,000%+. That is why I am reminding you now. This trade setup can be approached both with leverage and spot, both options will do great.
After years of bearish action and months of consolidation, Toncoin is ready and the recovery is happening slowly but surely. Prices are rising slowly, no new lows. Prices are moving sideways but knowing the bottom is in the only logical conclusion is a break up. It is on the chart. It is inevitable, it is confirmed; profits and success.
Timing is really essential when trading. If you can get the right entry timing, a great price, trading becomes easy long-term. Once the bullish move shows up, you will be happy sitting in a strong position that only grows. That is because you bought the bottom. We are still looking at bottom prices, the last chance at the "opportunity buy zone."
We are doing 4X but we have positions with higher leverage from where prices were lower. You need to decide your own risk tolerance. If in doubt, zero leverage please. Only when you are 100% certain and you accept the full risk. The full risk is the liquidation of your position, all money gone. Are you ready to lose everything? If you are, better start trading spot. The chances of losing are very low. If prices drop, you get to pick a small paper loss and nothing more. Your number of altcoins stay the same. When the market starts to move, your money grows and the paper loss turns into a gain. You can't lose if you don't sell when prices are down. Buy when prices are low. Hold strong through the bullish wave. The time to buy is now. Buy and hold. You will be happy with the results.
Namaste.
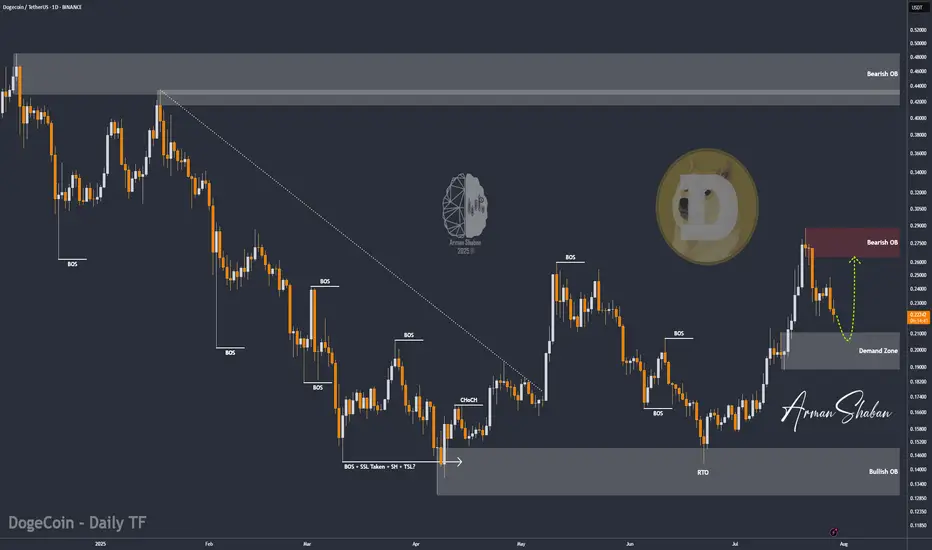
DOGE/USDT | Eyes Bounce from Key Support – Next Targets Ahead!By analyzing the Dogecoin chart on the daily timeframe, we can see that after reaching the $0.29 area, the price entered a correction and is now trading around $0.22. If DOGE dips into the key support zone between $0.19–$0.21, we could expect a strong bullish reaction. The next potential targets are $0.287, $0.32, $0.41, and $0.70.
Please support me with your likes and comments to motivate me to share more analysis with you and share your opinion about the possible trend of this chart with me !
Best Regards , Arman Shaban
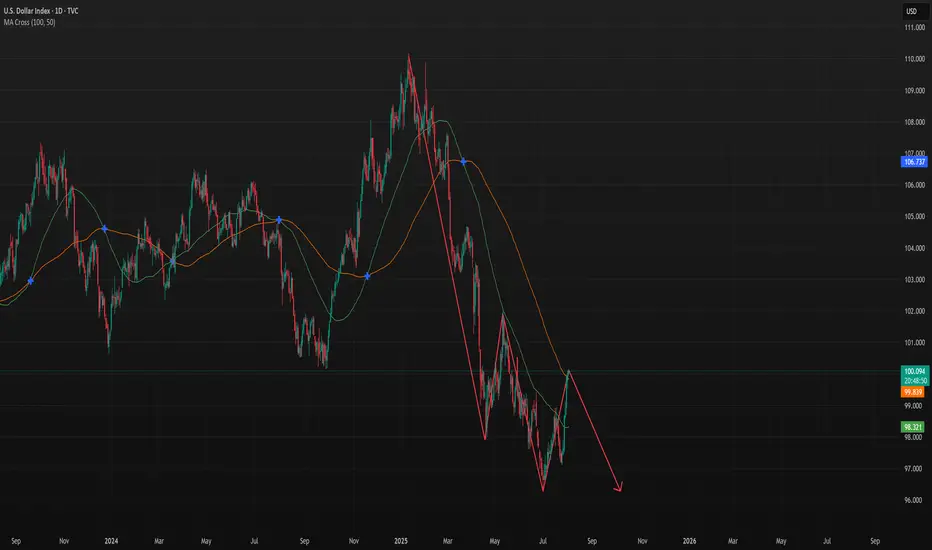
DXY - Possible Down Swing to continue furtherTVC:DXY
CMCMARKETS:USDCAD
OANDA:NZDUSD
CMCMARKETS:EURUSD
We may have a further down swing pattern forming let's continue to see if it passes the resistance area.
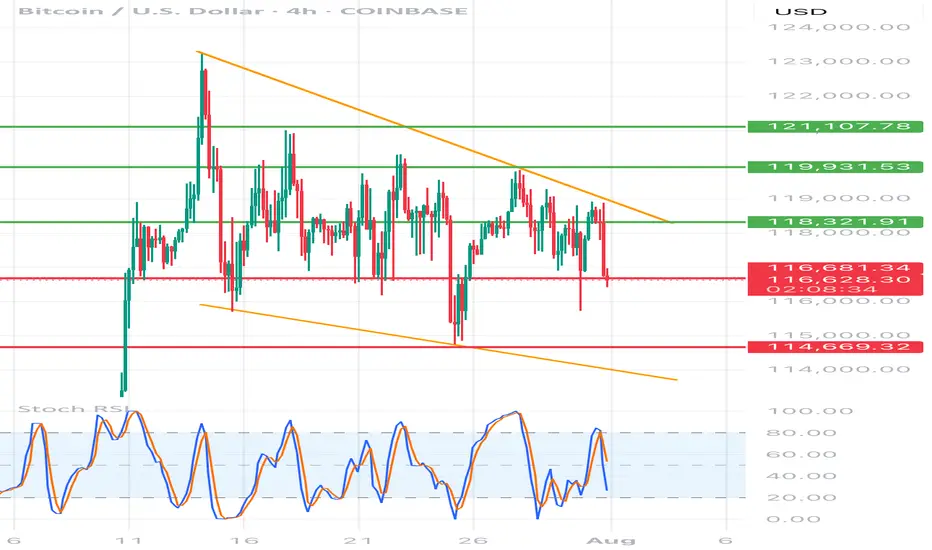
BTC/USD 4h chart🔸 Formation: Triangle descending (descending)
• Upper trend line (orange) - inheritance, connects lower and lower peaks.
• Lower support line (red) - approx. 116,700 USD - key support, tested many times.
🔻 Support
USD 116,700
Tested several times, currently threatened
🔻 Another support
USD 114,669
Target level when struck with a triangle
🔼 Resistance
USD 118,321
The nearest resistance - the former level of support
🔼 Resistance
USD 119,931
Local peak
🔼 Strong resistance
USD 121,107
Upper level of structure
📉 STOCHASTIC RSI (lower indicator)
• Line cutting and a decrease in the purchase area (> 80) towards the center.
• No extreme sales signal, but the trend begins to be negative.
⸻
📌 Applications and possible scenarios:
🔻 Bearish script (more technically likely):
• If BTC breaks below USD 116,700 with a 4H candle closure, possible:
• a decrease around USD 114,669 (lower limit of the triangle)
• Even lower - around 113,500-112,000 USD with an increased volume
🔼 Bullly script (less likely but possible):
• needed quick breaking above USD 118,300 and maintaining above this level
• Then the goal will be USD 119,931, and then possible traffic up to USD 121.107
⸻
📍 Summary:
• We see classic triangle descending-pro-draft formation.
• Support 116,700 USD very close to breaking - if it falls, down movement can be dynamic.
• Stochastic RSI coincides with the deterioration of the moment.
• The inheritance scenario seems dominant, unless there is a strong demand and over 118,300 USD.
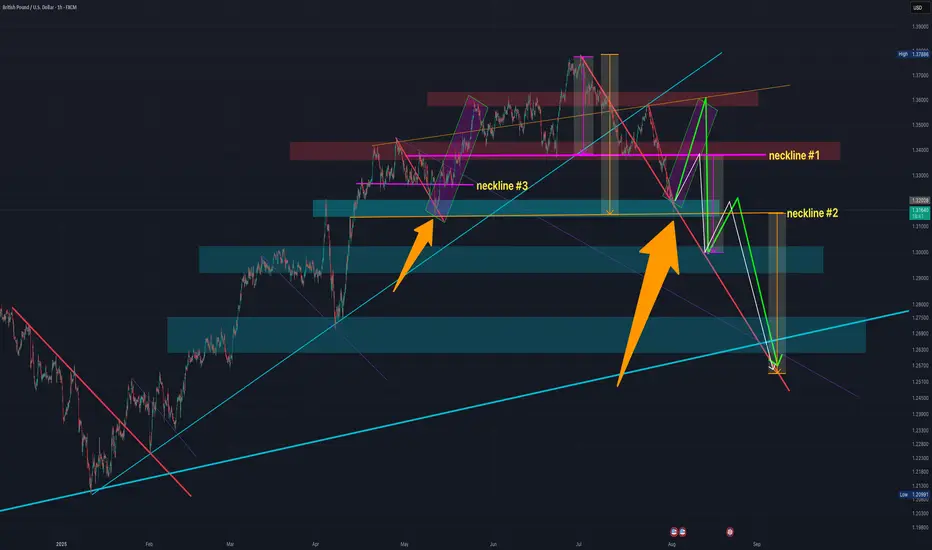
Hear me out... I've not been posting much (welcome to adhd/autistic life), but if anyone ever drops me a message, I'm always still trading, so feel free to ask me any questions ever :)
So while much of the tariff movement was priced in with the recent drop from the top (1.38 range), we could (and have seen) an expected fall out, with today being the official tariff announcement/last day from Trump.
This afternoon we have NFP, unemployment rate and PMI.
Based on where we are from a TA standpoint, I imagine these to be positive for GBPUSD (least not much more downfall anytime soon/ much lower than where we bottomed out today).
I'm going to update this idea with further notes, but you can see what we're currently working with and get an idea based on the chart what I'm thinking.
We've got the small H&S pattern at work (neckline #1), and a potentially bigger one at play (neckline #2), and then a previous one which I will discuss in the notes (neckline #3).
You can see across the chart a number of downward resistance lines (red).
I've shown them to express that we can see that every time we cross over the line, while it might bounce off it and then keep dipping further, it never crosses back under.
The only time it does cross back over is usually quite briefly (as per the orange arrows), but it's always short lived.
Case and point, we're not only very close to the current resistance-turned-support red line, but we're also hitting major support area.
This paired with such a big drop out (i.e. we could do with at least some short/mid term reversal) and the possibility of a retest of neckline #1, we've got plenty to work with.
You can see I've posted 2 arrows - one GREEN, the other WHITE.
I'll explain my thesis on that at some point and why I think it could easily cross back over the neckline before continuing to the downside.
We've also got the thin purple lines, which as you can see previously act as a resistance to where the reversal will happen at the lower end of the chart (which lines up with the major support line on the weekly chart, which I'll add to the notes at some point too.
Let me your thoughts.
I have a position open from today's drop to neckline #2, so let's see where it takes us :)
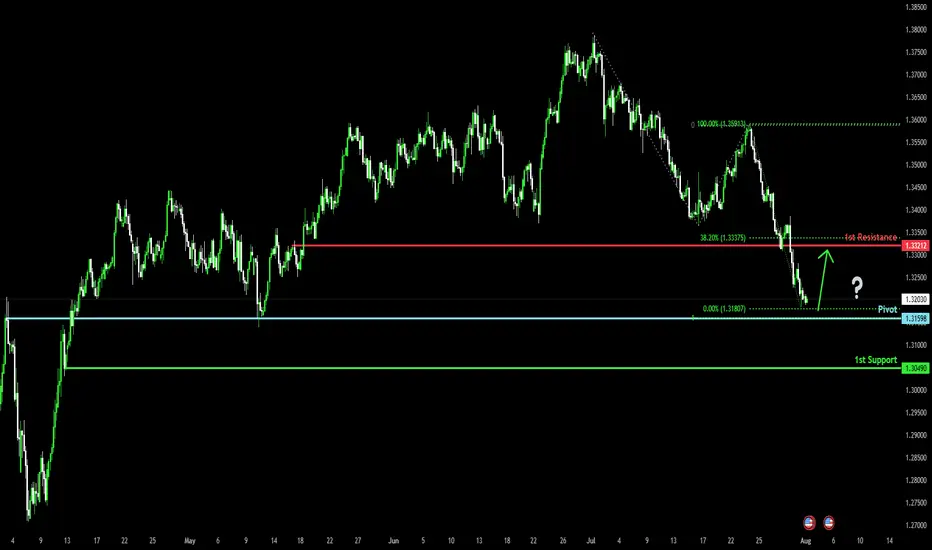
Bullish reversal off overlap support?The Cable (GBP/USD) is falling towards the pivot and could bounce to the 1st resistance, which is a pullback resistance that is slightly below the 38.2% Fibonacci retracement.
Pivot: 1.3159
1st Support: 1.3049
1st Resistance: 1.3321
Risk Warning:
Trading Forex and CFDs carries a high level of risk to your capital and you should only trade with money you can afford to lose. Trading Forex and CFDs may not be suitable for all investors, so please ensure that you fully understand the risks involved and seek independent advice if necessary.
Disclaimer:
The above opinions given constitute general market commentary, and do not constitute the opinion or advice of IC Markets or any form of personal or investment advice.
Any opinions, news, research, analyses, prices, other information, or links to third-party sites contained on this website are provided on an "as-is" basis, are intended only to be informative, is not an advice nor a recommendation, nor research, or a record of our trading prices, or an offer of, or solicitation for a transaction in any financial instrument and thus should not be treated as such. The information provided does not involve any specific investment objectives, financial situation and needs of any specific person who may receive it. Please be aware, that past performance is not a reliable indicator of future performance and/or results. Past Performance or Forward-looking scenarios based upon the reasonable beliefs of the third-party provider are not a guarantee of future performance. Actual results may differ materially from those anticipated in forward-looking or past performance statements. IC Markets makes no representation or warranty and assumes no liability as to the accuracy or completeness of the information provided, nor any loss arising from any investment based on a recommendation, forecast or any information supplied by any third-party.
XRP Critical Levels to Play This MonthHello I am the Cafe Trader.
This weekend we are shifting focus into the crypto market for a quick overview. If you read my last XRP article, we nailed the bottom for longs, and the sellers for a great positional play. This time we are going to analyze the current failed breakout.
Are Bulls Trapped? Does this still have room to leg up?
Point 1
We can start with the trend break. Massive buyers pushed this move higher, giving XRP a relatively quick All time high, But July 23rd shorts were able to shove this back inside of the previous high.
This signifies that there are bulls trapped, but the interesting thing to note is that the volume has reduced significantly since the last two ATH's. So this also would indicate a lack of buying interest at the highs.
Buyers are just not willing to to get involved with the same conviction as before (yet). No buyers, no continuation (even if there is not many sellers/profit takers).
Point 2
Strong buyers proved their interest with a "hot" reaction at $2.95.
With no "real" seller coming into this market yet, there is nothing stopping this continuation from legging up (so far).
Therefore I stand bullish, and am looking for a move up to $4.64 as a Target.
Point 3
Buying into this can feel tricky, your first entry for a classic two bar trend break would've been at the top of demand. I do think we will get another opportunity here, I definitely would not chase this, because it could play this range for a while before another leg up.
Setup
Trend break continuation.
Entry 3.13
Stop 2.65
Exit TP 4.64
Risk to Reward 3.1
If there is a close below these strong buyers, this could com all the way back down to 2.15-2.3 at least.
The reason for the wider stop here is because we don't want to get swept and then ran. A more conservative stop could be $2.85 which would be a 6R trade. Take your pick
Long Term
If you are late to the party on XRP (I know many are) here are some entries according to your sentiment:
Almost FOMO = 3.13
Aggressive = 2.95
Good price = 2.15-2.3
Steal = 1.60 - 1.93
That's all for XRP. We are going to be looking at Ethereum ETH Next.
Thanks for reading and happy trading!
@thecafetrader

Lingrid | TONUSDT Potential Long From the KEY ZoneThe price perfectly fulfilled my last idea . OKX:TONUSDT is pulling back from a fake breakout above 3.590 but holding within the boundaries of an upward channel. The price is approaching strong confluence support near 3.250, where both the trendline and horizontal zone align. A rebound from this level could launch a new bullish leg toward the resistance zone. Buyers will look for confirmation at the bounce area to aim for 3.590 and beyond.
📌 Key Levels
Buy zone: 3.250 – 3.300
Sell trigger: Break below 3.250
Target: 3.590 – 3.700
Buy trigger: Bullish engulfing or breakout from local consolidation near 3.300
💡 Risks
Loss of support at 3.250 trendline
Bearish pressure from broader market sentiment
Another fakeout or choppy move around 3.300–3.400 zone
If this idea resonates with you or you have your own opinion, traders, hit the comments. I’m excited to read your thoughts!

S&P Correction Window is official - VOLATILITY AHEADIt's that time of year where the pre-summer push wraps and the summer lull and potential
pause gets underway.
July 31 finished on a bit of a sour note with over 67% of stocks declining today and US indexes finishing RED despite the big gaps and bullish pops on MSFT and META post earnings.f
SPX Key Levels
-watch the 21 day moving average
-watch the 50 day moving average
-more dynamic support in the 100/144/200 moving average cluster
I'll be taking bites at the 5/10/15% correction levels with options and looking for this dip
to be bought by retail and institutions.
Will August 1 US Tariff Deadline matter? After Japan and Eurozone came in and said a deal is being done, I was thinking this would be a dud. BUT, Dr. Copper says "maybe" on the global
tariff deadline with the largest single day move in history (bearish). Being the perfect time of year for a correction (the other being Feb-Apr), and the technicals looking so clean for an
orderly pullback, VIX may float higher and make things more interesting in the next 30-60 days.
Strategies matter, I'll be trading risk defined, but there are great opportunities ahead. A pullback is sure better than literally watching all-time highs every single day.
Thanks for watching!!!
