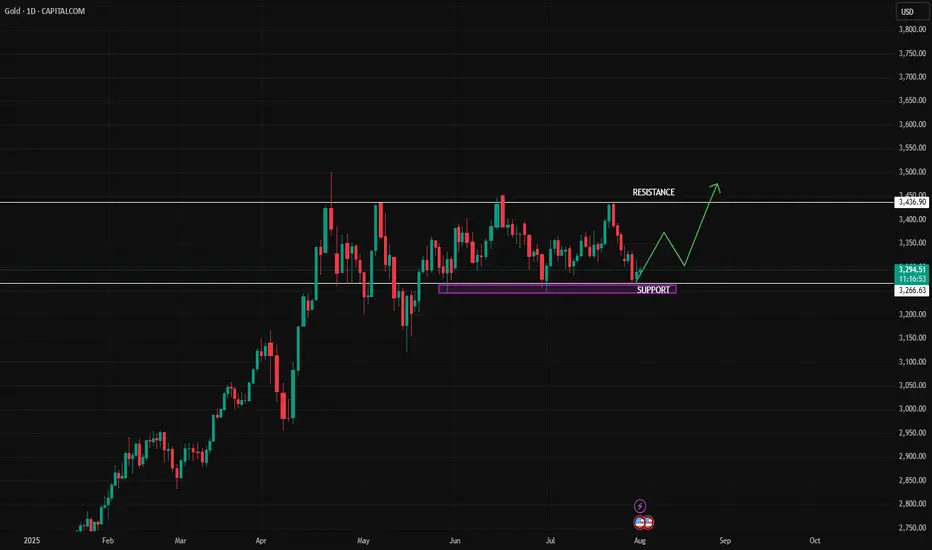
**"Gold Price Rebounding from Support:Potential Move Toward 3436This chart shows the **price movement of Gold (XAU/USD)** on a **daily timeframe**.
### Key Points:
* **Support Zone** : Around **\$3,266**, this is the area where price has bounced up multiple times, meaning buyers step in here.
* **Resistance Line**: Around **\$3,436**, this is the level where price has been rejected before, meaning sellers are strong here.
* **Current Price**: Around **\$3,293**.
### What the Chart Suggests:
* Price is near the **support** zone again.
* If the support holds, the green arrow shows a possible move **upward**.
* Price may first move up slightly, pull back, and then try to **break above resistance** at \$3,436.
Gold is in a sideways range. It's near a strong support level and might go up from here toward the resistance level, as shown by the green line.
Trend Analysis
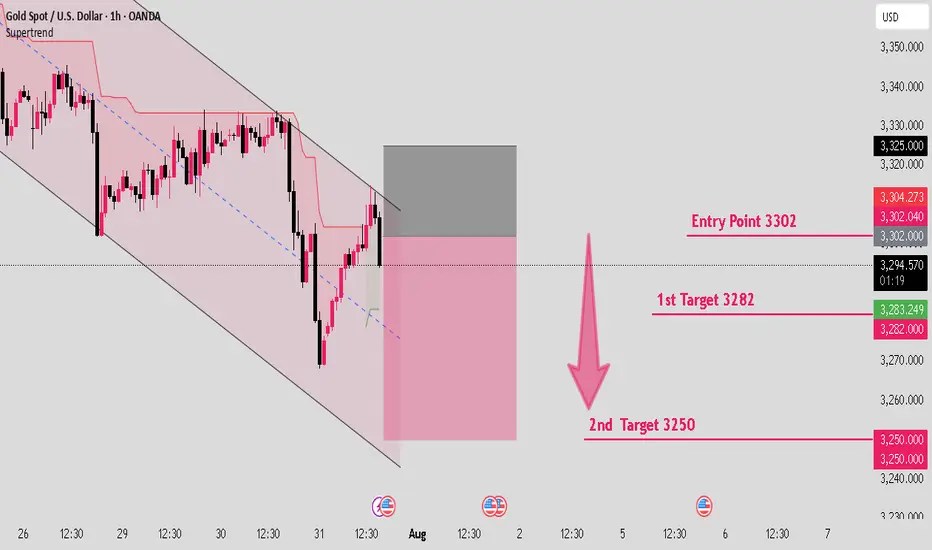
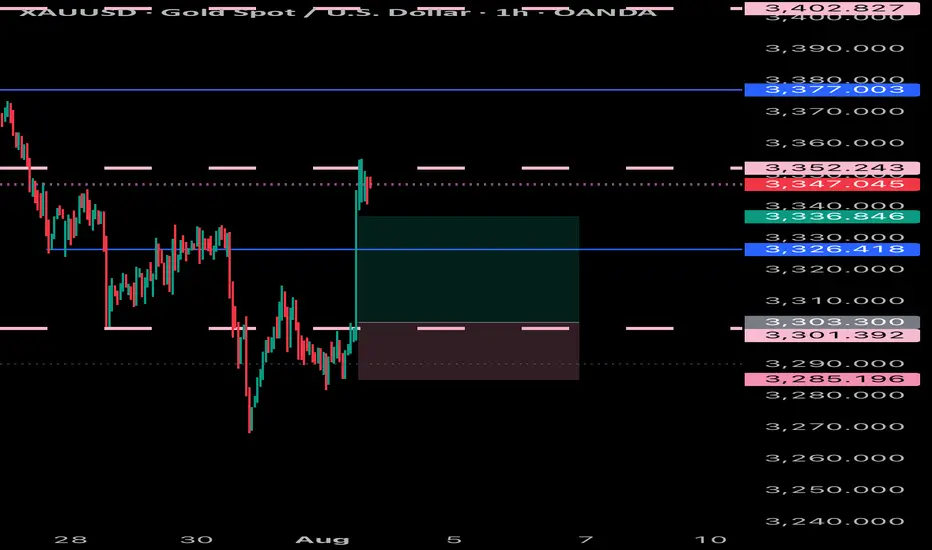
Gold is creating a downward structure in parallel channel.Hello IGT FOLLOWERS
Here is my gold overview, According to me gold will fall because it is continously working in a downward parallel channel.. Bearish momentum visible on lower timeframes (1H-4H) • Price Structure: Recently rejected from $3,320-$3,325 resistance zone Forming lower highs and lower lows- suggesting short-term downtrend continuation..
Key points :
Entry point : 3302
1st Target : 3282
2nd Target : 3250
Follow me for more latest updates and signals
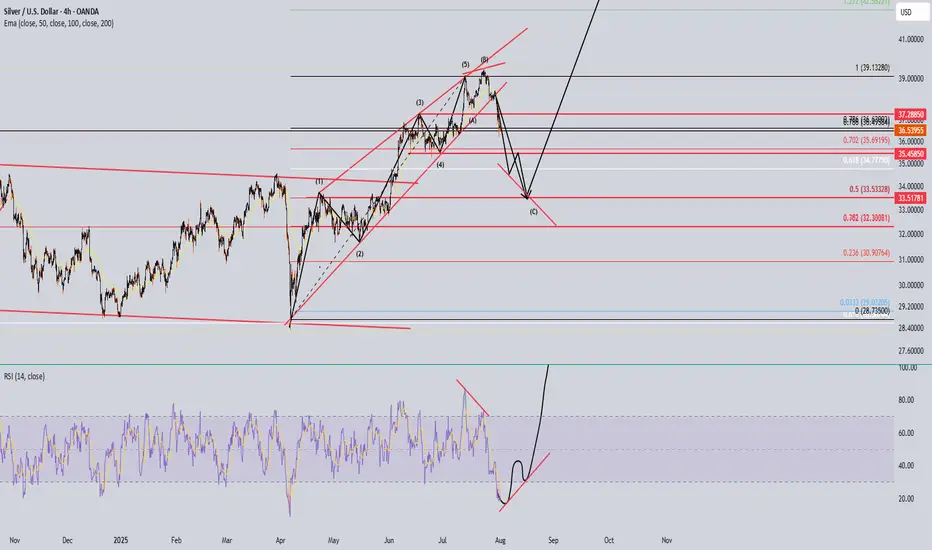
Wait SIlverLook at the RSI to form something like this in combine with the last 2 waves down. Then hopefully that power move to the 600?? Macro on the monthly its forming a cup and handle. If plays out silver will be super pricy
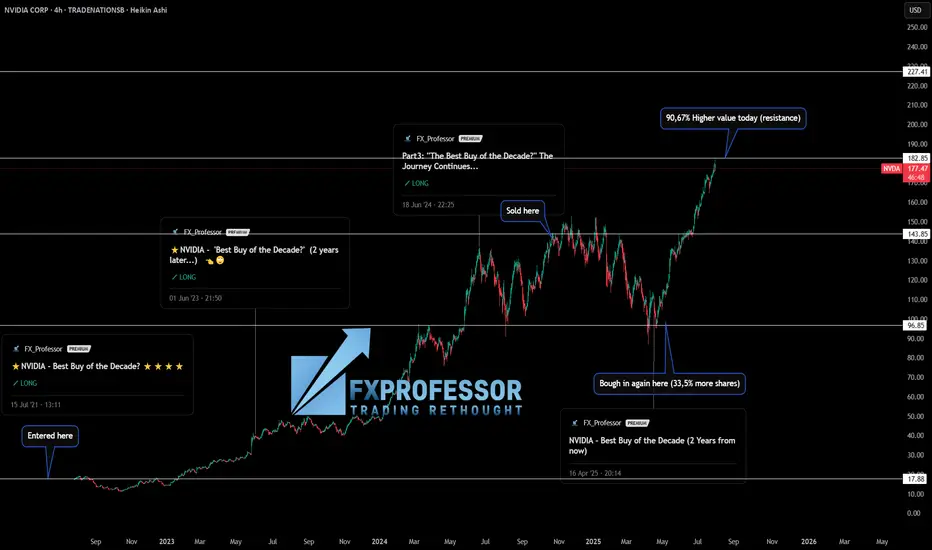
NVIDIA – From Thesis to Profits: How Fundamentals & Technicals 📚💡 NVIDIA – From Thesis to Profits: How Fundamentals & Technicals Aligned 🚀🧠
This isn’t just a trade —it’s a lesson in how conviction, timing, and structure come together when you truly understand what you're investing in.
I’ve been publicly calling NASDAQ:NVDA the “Best Buy of the Decade” since July 2021 when the price was around $18. Why? Because I’m a gamer, I understand chips, and I knew exactly what NVIDIA was building long before AI became a buzzword. From graphics cards to data centers and AI compute, the fundamentals were solid.
But let me be clear: I’m not a holder forever. I use technical analysis to manage entries and exits. And that’s where the real edge comes in. 🎯
Here’s how the trade evolved:
✅ Initial entry: $17.88 (2021)
✅ First target hit: $143.85 → Took profits
✅ Re-entry: $96.85 → Got 33.5% more shares for the same money
✅ Today’s value (July 31st): Up +90.67% in just 100 days
📅 That’s from April 23rd to today.
(and it was ALL publicly posted here, for You!)
This is what happens when macro conviction meets micro execution.
🧠 The key takeaways:
Fundamentals gave me the why.
Technicals gave me the when.
And risk management gave me more shares for free.
That’s not luck —it’s structure, patience, and doing the work. If you’re just “HODLing” and hoping, consider learning how to work the chart instead of letting the chart work you.
Let me know in the comments—did you catch this move? Are you in, or waiting for the next entry?
One Love,
The FX PROFESSOR 💙
ps. in this case i did not sell many shares today i hedged with a short on SP500. Nvidia might correct a bit
Disclosure: I am happy to be part of the Trade Nation's Influencer program and receive a monthly fee for using their TradingView charts in my analysis. Awesome broker, where the trader really comes first! 🌟🤝📈
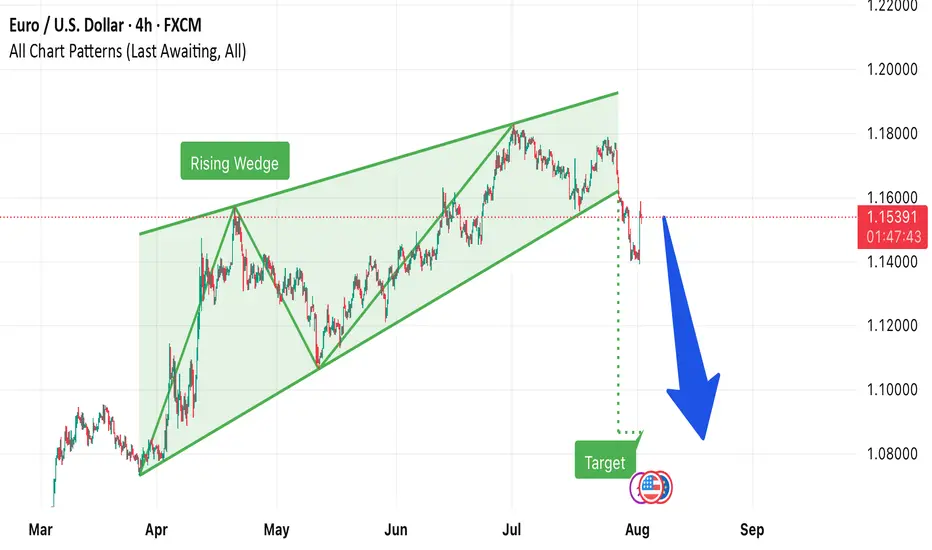
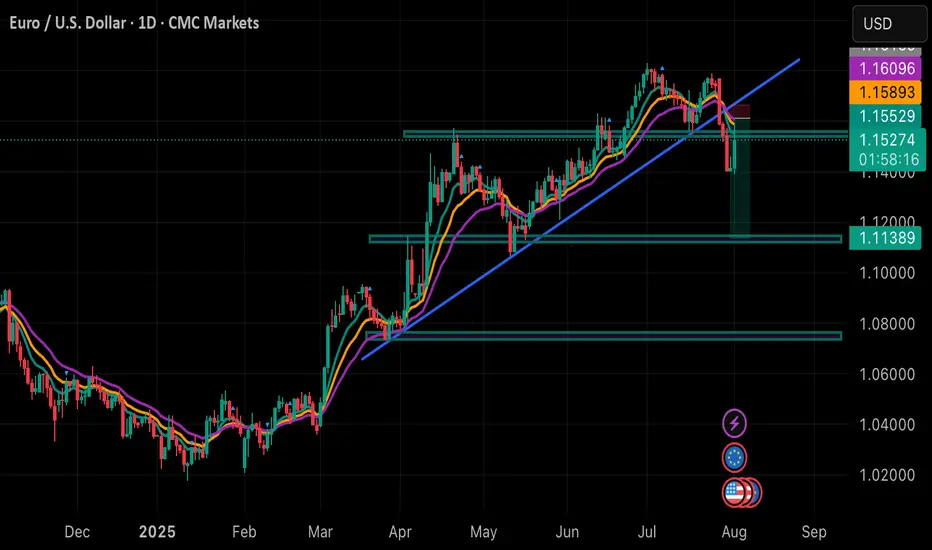
4h chart out lookEUR/USD has broken down from a Rising Wedge pattern on the 4H chart, signaling a potential bearish move. As long as price stays below 1.1600, downside targets near 1.0900–1.0850 remain in play
SUPER BUY GOLD XAUUSD Gold has ripped all levels of take profit and has gone up and gave us a small amount of drawdown with huge gains in return, simple trading price action and (M&Ws)
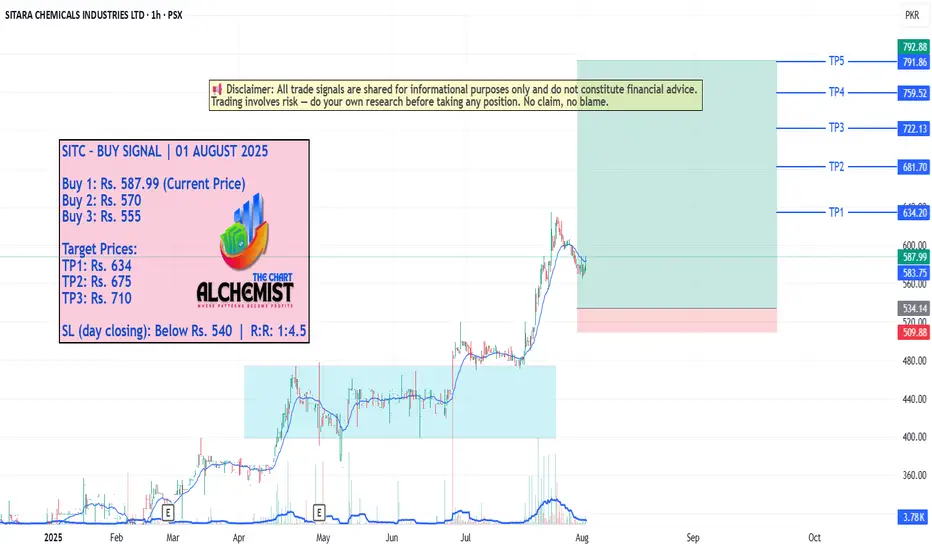
SITC – BUY SIGNAL | 01 AUGUST 2025 SITC – BUY SIGNAL | 01 AUGUST 2025
The stock previously broke out of a trading range (marked light blue channel) and marked a high of Rs. 634. After a shallow pullback to Rs. 478, it spiked upwards again, creating multiple bullish structures. Recently, it rebounded from a key bullish structure and is now entering a new upward leg with good momentum. Quantified displacement targets lie ahead.
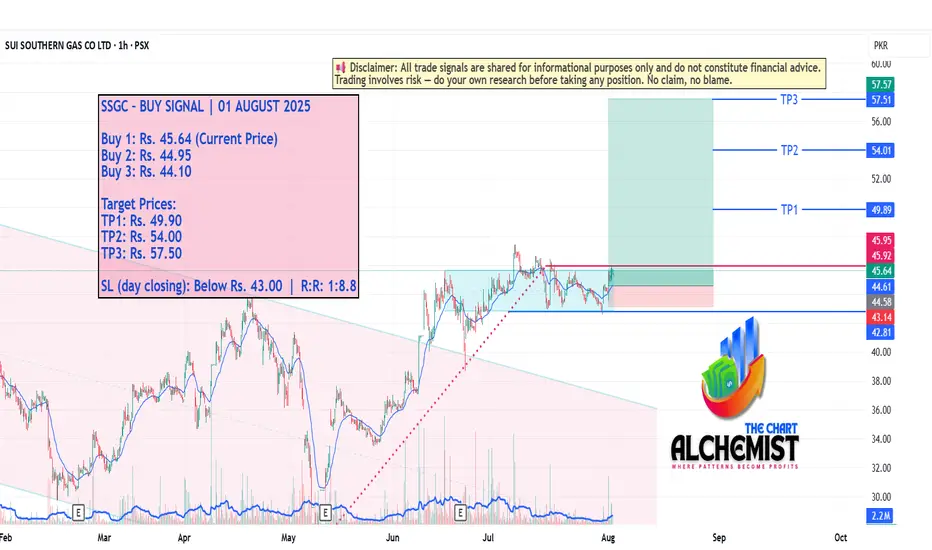
SSGC – BUY SIGNAL | 01 AUGUST 2025SSGC – BUY SIGNAL | 01 AUGUST 2025
The stock recently broke out of a bearish channel (marked light pink) and made a high of Rs. 47.41. Since the breakout, it has been undergoing a lateral pullback, which now appears to be complete based on the volumetric profile and recent price action. With momentum shifting back in favor of buyers, SSGC is poised for the next leg upward.
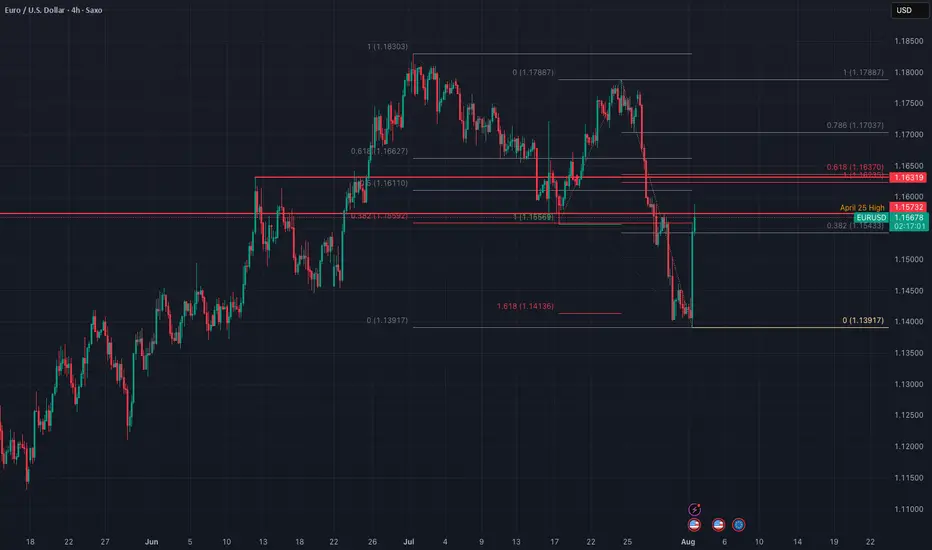
EURUSD - correction ahead of timeWell, well - EUR used the NFP data to start the correction ahead of time. It used the FR 161.8 of the recent correction as support. And it did it in a impressive time...
Now we are heading into Resistance cluster created by the April High and July Low (as wee and FR 38.8 of the whole movement form the July High. Yet the upper level of the cluster is created by the FR 61.8 of the recent impulse, and 1:1 with the recent correction and June High. The second one seems to me as stronger and more probably. However, price may be in hurry again and complete the correction ahead of time... Again.
Just my humble opinion...
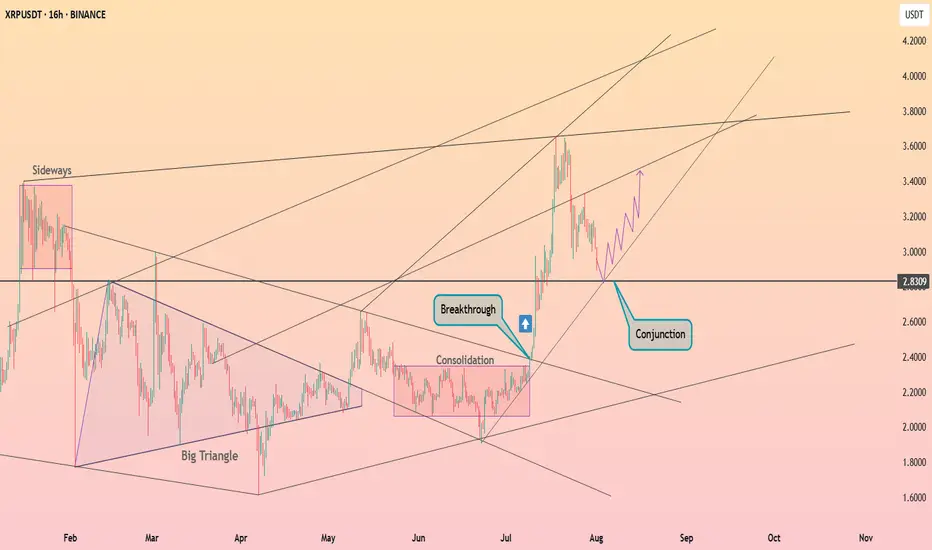
XRP continues to pullback ┆ HolderStatBINANCE:XRPUSDT surged above $2.83 after consolidating in a tight range. Price is now retesting the breakout zone at a key structural conjunction. If the level holds, a renewed move toward $3.40 may follow as bulls reclaim control.
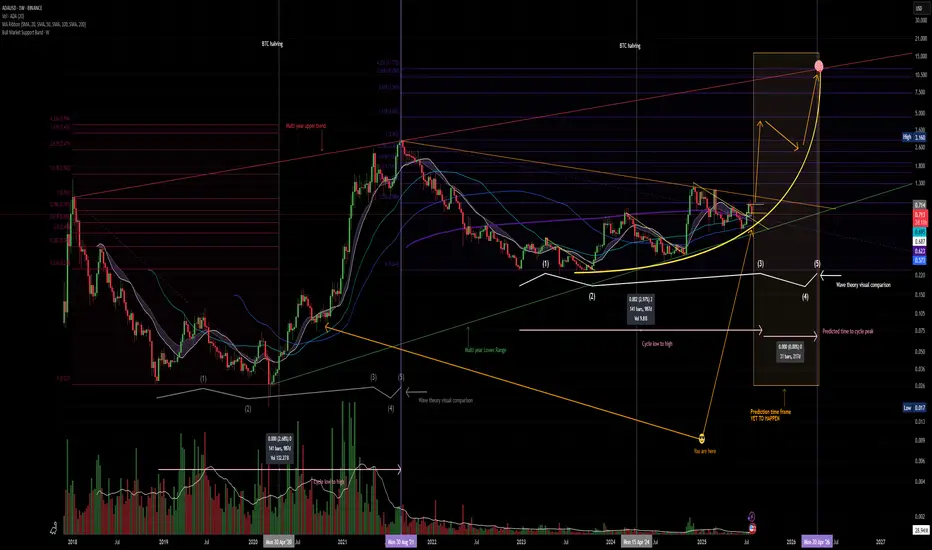
Panic sets in. but its all goodThe crypto market has experienced a strong panic driven correction as the FED refuses to cut rates and inflation is on the rise while wages are slowly in decline.
CRYPTOCAP:ADA continues to provide thrills and chills
Is it time to dump? and cry into your empty wallet?
IMO NO, CRYPTOCAP:BTC has recently taken out liquidity below the $117,000.00 price point which is a normal move, if you are over leveraged it can feel horrible but I assess as a normal correction.
CRYPTOCAP:ADA price remains in the range in which it has formed .93 - .71 the possibility that CRYPTOCAP:ADA can dip deeper to .65 is possible but unlikely. This correction provides a cooling off of MACD and RSI on higher timeframes and the chart still remains BULLISH.
Remember be greedy when others are fearful.
A man who says he never had a chance never took a chance!
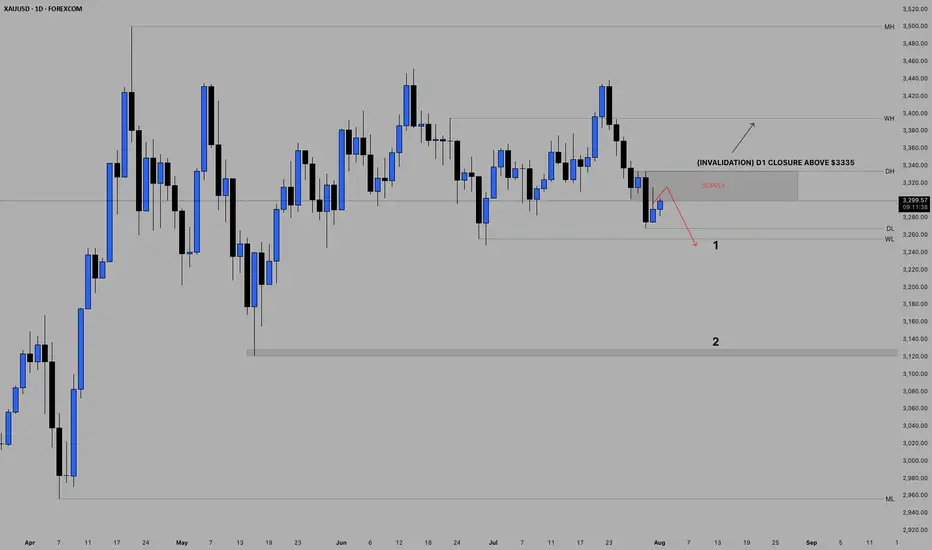
POSSIBLE BEARISH CONTINUATION ON GOLDBased on price action, Gold presents a very bearish sentiment from the daily point of view.
The indicated supply region may be the area of interest for the build up of the sells if indeed Gold is bound for the monthly lows.
Confirmation is needed for an entry.
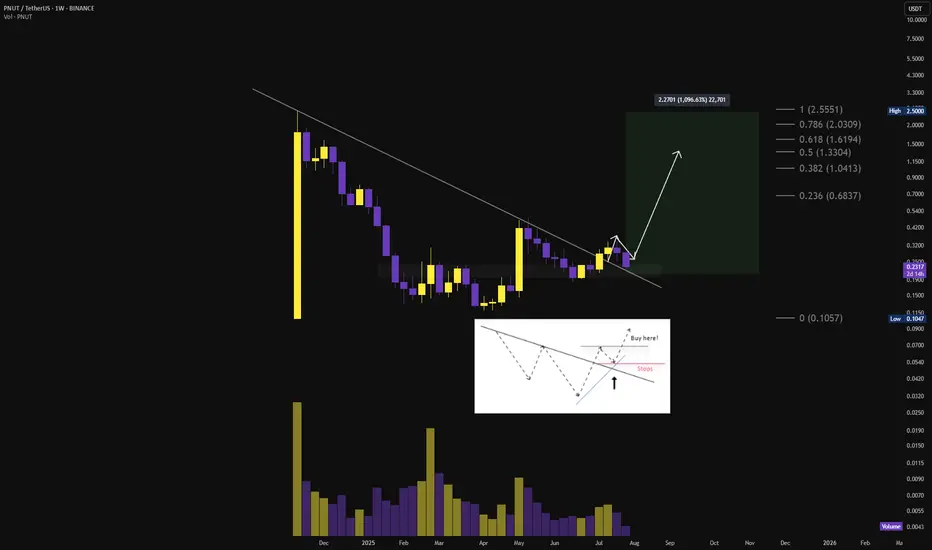
$PNUT TO 2.5$ THIS RALLY?🚨 $PNUT breakout from falling wedge confirmed ❗
Target at $0.34 is done for a 70% move off the breakout✅
Now retesting the breakout zone: $0.21–$0.23
Breakout remains intact. Consolidation expected before the next explosive leg. 📈
Local breakout above $0.33 → reopens pathway to:
→ $0.50 → $0.68 → $1.00 → $1.33 → $2.00 → $2.50
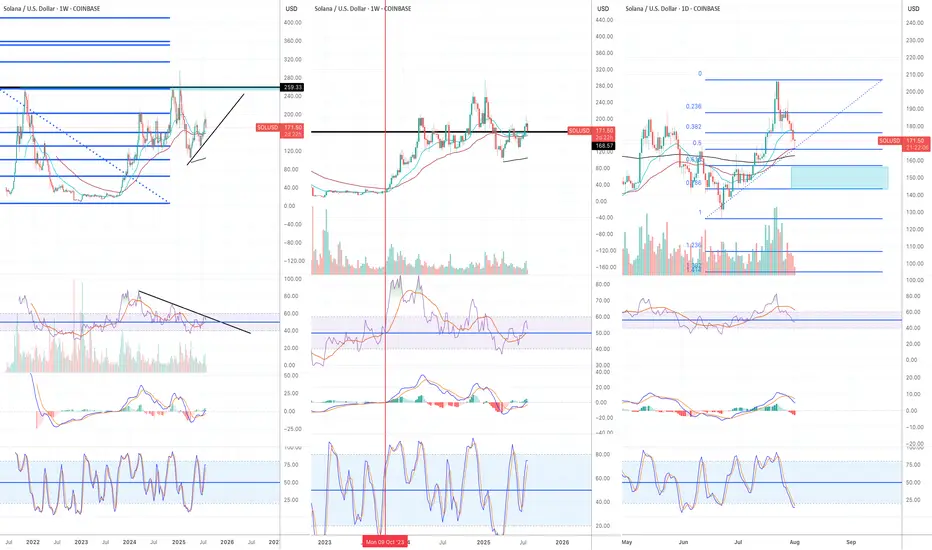
Still bullish in the higher time frames Solana has been struggling to break and stay above $170-200 zone this cycle.
It has been a very difficult asset to trade, however, I can see more bullish setups than bearish setups in higher timeframe charts.
Monthly:
1) July monthly candle closed above Fib 0.618 and formed higher high higher low.
2) RSI and MACD are still in the bull zone.
3) Stochastic are in the bear zone, but they are pointing to the upside.
Weekly:
1) EMA21 is still above EMA55.
2) The current weekly candle is forming bearing engulfing candle, however, there are two more days before it closes. It is still above EMA 21.
3) RSI orange line (RSI based moving average) is moving upwards and entering the bull zone.
4) MACD is about to enter the bull zone.
5) Stochastic hasn't reached overbought territory yet.
6) The set up of these three momentum indicators is very similar to the set up in Oct 23 before Solana started a massive bull trend. (see red vertical line)
Daily:
1) EMA21>EMA55>EMA200
2) As I said in the previous articles, EMA 55 and 200 don't cross easily. But when they do, the price often pulls back significantly before it starts to move in the direction of the trend.
3) Daily candle broke below EMA21, however, the price is reacting strongly to EMA55.
4) The price is still higher high higher low.
I will wait and see if the price is going to bounce off from $143 -157 region. (see blue rectangular block).
Eurusd sell pending order set already. Hopefully on mondayBased on my technical analysis, I strongly speculate EURUSD fall on Monday.
XAUUSD ANNASIS OUTLOOK BULLISH 1/8/2025 XAUUSD – Trade in Progress
Long from $3,295 – targetting $3,355 / $3,365
+600+ pips potential on extended breakout
Bulls gaining strength above $3,300
Holding with confidence – structure supports it
#XAUUSD #GoldTrade #LiveSetup #TargetPending

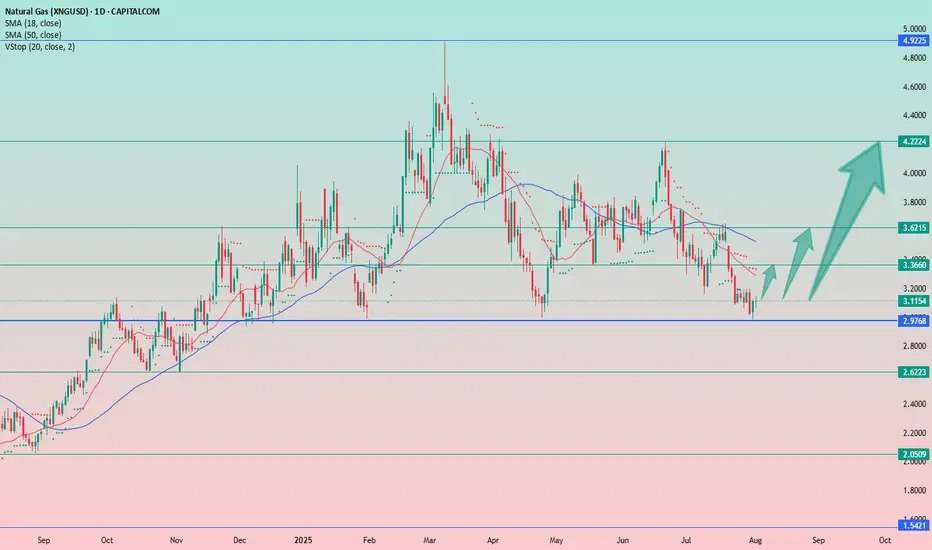
Natural Gas Rebounds from Key SupportNatural gas has bounced off its strong support level and is showing signs of upward movement, particularly evident on the hourly chart. Dips are being bought up, with the price quickly returning to previous levels.
Downsides: The downtrend is still in place (though it may potentially be broken), and there's a relatively long stop-loss below yesterday’s candle low at 2.98.
📝Trading Plan
Entry: buying gold at the current level
Stop Loss: 2.98
Target: 3.36, 3.62, and 4.20.
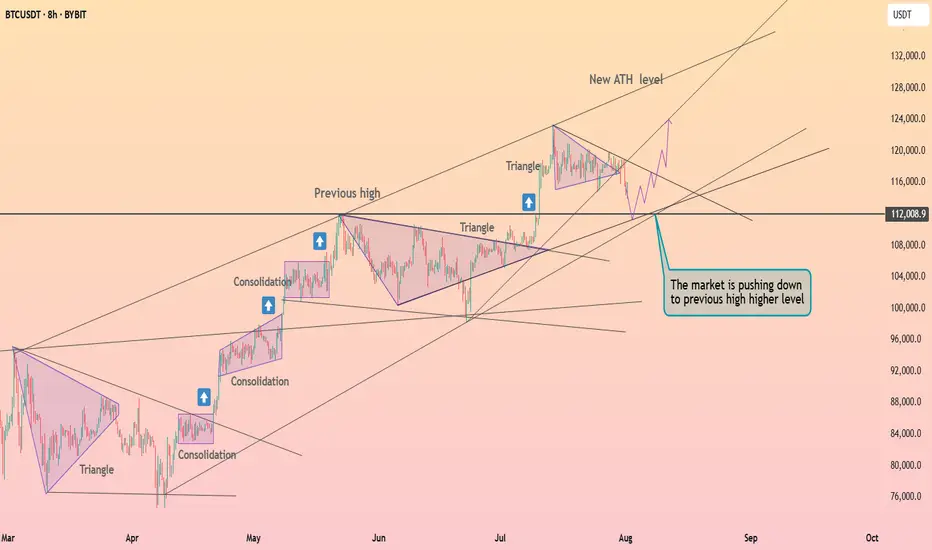
Bitcoin exited from the triangle ┆ HolderStatBINANCE:BTCUSDT is dipping to retest $112,000, the last breakout level. The price remains inside a large ascending triangle and may soon resume its uptrend. If this support holds, targets above $125,000 come back into play.
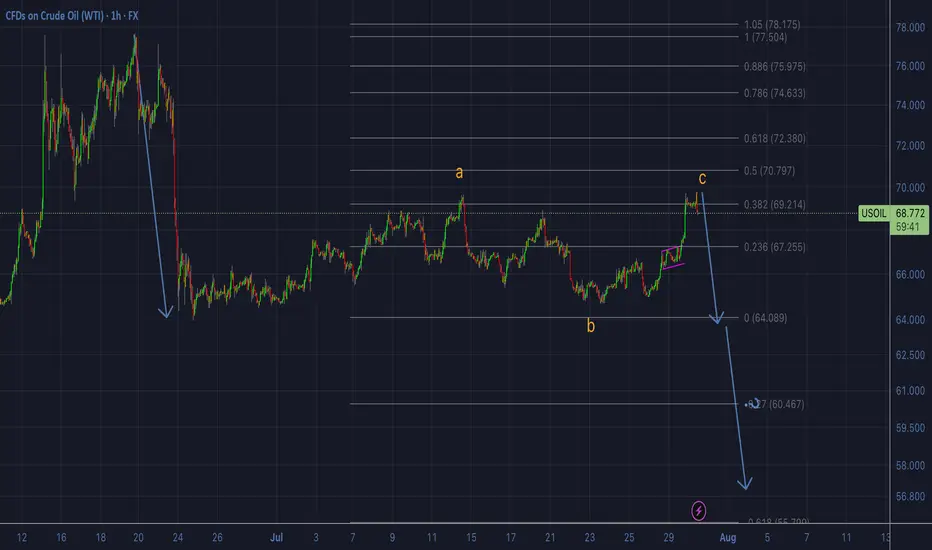
OIL - shortFollowing our previous forecasted up-move, from now on we will switch to looking for sell setups only. We would normally expect the C wave of the corrective pattern retrace all the way to the 0.618 fib of the downward impulse, as the A wave had already retraced to the 0.382. But that isn't necessarily always the case. As long as the C retracement has broken the top of the A retracement, the pattern formally speaking can be complete. We will not be looking for further buys, therefore, from now on. Even if it does continue to the 0.618, we will skip the eventual buy and focus on the sells. At the same time, because the eventuality of more up exists, we will wait for a proper sell setup before we enter any short position. Updates will follow.
BLACKBERRY BBBREAKOUT OF DESCENDING TRENDLINE COULD SEE 22$-24$
BlackBerry today is a Canadian technology company specializing in cybersecurity software and Internet of Things (IoT) services for enterprises and governments worldwide. Formerly renowned as a mobile device manufacturer, BlackBerry Limited (formerly Research In Motion, RIM) exited the smartphone business in 2016 and now focuses on secure communications, endpoint management, and embedded systems, especially for industries like automotive, healthcare, and government.
Company Profile & Business
Headquarters: Waterloo, Ontario, Canada
Core products: Cybersecurity solutions, BlackBerry Unified Endpoint Management (UEM), QNX operating systems, secure messaging (BlackBerry Messenger Enterprise, BBMe), and automotive software platforms.
Global presence: Products and services are sold worldwide across the Americas, Europe, Middle East, Africa, and Asia-Pacific.
Recent Financials & Stock
Stock ticker: NYSE/TSX: BB
Recent price: As of July 30, 2025, BlackBerry closed at $3.74 per share, reflecting a decline from earlier in the month. Price targets for the company now range from $2.71 to $4.75, with analysts citing positive revenue growth and the company's first positive cash flow in three years after its recent quarterly results.
Business momentum: The company recently posted about 10% higher revenue compared to forecasts for the third quarter fiscal year 2025, with a shift to positive earnings and cash flow—highlighting improvements in its cybersecurity and IoT software businesses.
Notable News & Developments
End of smartphones: BlackBerry-branded mobile devices are officially discontinued. The company fully exited the hardware business by 2018 and stopped supporting BlackBerry 10 in 2022.
Nostalgia revival: In 2025, a separate company (Zinwa Technologies) is reviving classic BlackBerry devices (like the BlackBerry Classic and Passport) by retrofitting them with modern Android internals. These are not officially affiliated with BlackBerry Limited, but appeal to enthusiasts for the classic design and QWERTY keyboard, albeit with privacy caveats due to non-BlackBerry software.
Enterprise focus: BlackBerry remains a leader in secure software for businesses, including automotive OS (QNX), endpoint security, and secure messaging. Major clients include automotive OEMs, financial corporations, and government agencies.
Quick Facts Table
Aspect Details
Industry Cybersecurity, IoT software, enterprise services
Founded 1984 (as Research In Motion, Canada)
Consumer Phones Discontinued; brand revived unofficially by others
Current Stock Price $3.74 (July 30, 2025)
Latest Product Focus Automotive software, secure endpoint management
BlackBerry is no longer a phone maker, but remains a significant player in secure enterprise and automotive software, with stock prices and business outlook reflecting its transition into these fields.
Zinwa Technologies is a Chinese technology company that has gained attention in 2025 for its project to revive classic BlackBerry smartphones, specifically the BlackBerry Classic (also known as the Q20), under its own branding. Unlike BlackBerry Limited (which no longer makes hardware), Zinwa has purchased batches of old BlackBerry Q20 devices—both new-old-stock and used units from supply chains in Hong Kong—and is refurbishing them with entirely new internal components while retaining the iconic design features such as the physical QWERTY keyboard and 720x720 touchscreen.
Key Details on Zinwa Technologies’ BlackBerry Revival:
Project Name/Models: The updated phone is called the Zinwa Q25 (2025 is referenced in the model name). Zinwa is also planning to modernize other BlackBerry devices, including the KEYone (“K25”) and the Passport (“P25” or “P26”).
What’s Modernized?: The original shell, keyboard, notification LED, and display remain, but Zinwa installs a new motherboard with a MediaTek Helio G99 processor, 12GB RAM, 256GB storage (expandable), a 50MP rear camera, 8MP front camera, a new 3,000mAh battery, and global 4G LTE support. There is a USB-C port, headphone jack, microSD support, and the phone runs Android 13 (with no confirmed plans for updates to later Android versions).
How It’s Sold: Two options are offered—a fully assembled Zinwa Q25 smartphone for $400, or a $300 conversion kit for those who already own a BlackBerry Classic and want to upgrade themselves. Both are expected to ship in August 2025.
Nostalgia Meets Modern Tech: The initiative targets fans of physical keyboards and retro gadgets as well as a new wave of Gen Z users seeking “digital detox” devices. The device is positioned as a niche product for enthusiasts rather than a mass-market flagship.
No Connection to BlackBerry Limited: Zinwa Technologies has not acquired the BlackBerry brand or company; its project is independent and relies on recycling and upgrading old BlackBerry hardware.
Future Plans: Zinwa has stated it may refresh additional BlackBerry models based on demand and feedback, following the Q25 release.
In sum, Zinwa Technologies is bringing back the BlackBerry Classic as a refreshed, Android-powered device for technology enthusiasts and nostalgia seekers, reflecting a trendy intersection of retro design and modern smartphone capabilities in 2025.
#BB

GOOGL Slips into Bearish Gamma Territory. 8/1GOOGL Slips into Bearish Gamma Territory — Eyes on $190 Defense or Slide to $187.50
🔍 GEX & Options Flow Insight (1st Image Analysis)
GOOGL has broken down from its recent consolidation and is now testing the $190–$192 gamma support band. The GEX profile shows heavy negative gamma just below current price, increasing the risk of accelerated selling if $190 fails.
* Call Walls & Resistance:
* 📍 $194.91–$196.53 → First resistance zone
* 📍 $197.85 → Highest positive NET GEX / Gamma Wall
* 📍 $202.50+ → Out of immediate range unless a strong reversal occurs
* Put Walls & Support Zones:
* 🛡️ $190.50 → Current gamma pivot
* 🚨 $187.50 → 2nd Put Wall / Hard gamma floor
* 📉 Below $187.50 opens the door to $185–$182
* Volatility Insight:
* IVR 18.9, IVx Avg 32.5 → Slightly elevated IV
* Call flow 11.2% → Bearish leaning
* GEX sentiment: 🔴🔴🔴 = Negative gamma environment → more volatility to downside
✅ Option Trading Suggestion:
Bias: Bearish unless reclaiming $194+
Strategy: Bear put spread
* Entry Idea: Buy 190P / Sell 185P for Aug 2 or Aug 9 expiry
* Invalidation: Close above $194.91
* Target: $187.50 → $185
Why this works: Dealers in negative gamma hedge by selling into weakness, which can accelerate moves lower. Losing $190 likely brings $187.50 quickly into play.
🧠 Technical Analysis (1H Chart) (2nd Image Analysis)
Market Structure & SMC:
* 🟥 CHoCH confirmed after rejection from $197.85 supply
* ❌ Price broke BOS support from $194.91 area
* Trading in a descending structure toward $190 support
Trendline Dynamics:
* Broke short-term uptrend
* Now respecting a lower parallel channel toward $187.50
SMC Zones:
* 🟩 Demand Zone: $190.50–$187.50 → First defense zone
* 🟥 Supply Zone (Purple Box): $194.91–$197.85 → Immediate resistance
🔄 Price Action & Key Levels
* Support:
* ✅ $190.50 → Current hold line
* ✅ $187.50 → Gamma floor
* 🚨 Below $187.50 → $185 → $182
* Resistance:
* 🚩 $194.91 → First reclaim level for relief rally
* 🚩 $196.53–$197.85 → Supply + Gamma Wall
🧭 Scalping / Intraday Trade Setup
🟥 Bearish Setup (Preferred):
* Entry: Failed bounce at $194–$195
* Target 1: $190.50
* Target 2: $187.50
* Stop: Above $196
🟩 Bullish Reversal Setup:
* Entry: Strong reclaim of $196.50 with volume
* Target 1: $197.85
* Target 2: $200+
* Stop: Back under $194
🔁 Summary Thoughts
* GOOGL has shifted from neutral to negative gamma, favoring continued downside pressure.
* $190.50 is the short-term line in the sand — losing it risks a swift trip to $187.50.
* Any bounce into $194–$196 is likely to face selling pressure unless backed by volume and a gamma flip.
🚨 Disclaimer:
This analysis is for educational purposes only and does not constitute financial advice. Always do your own research and manage your risk accordingly.

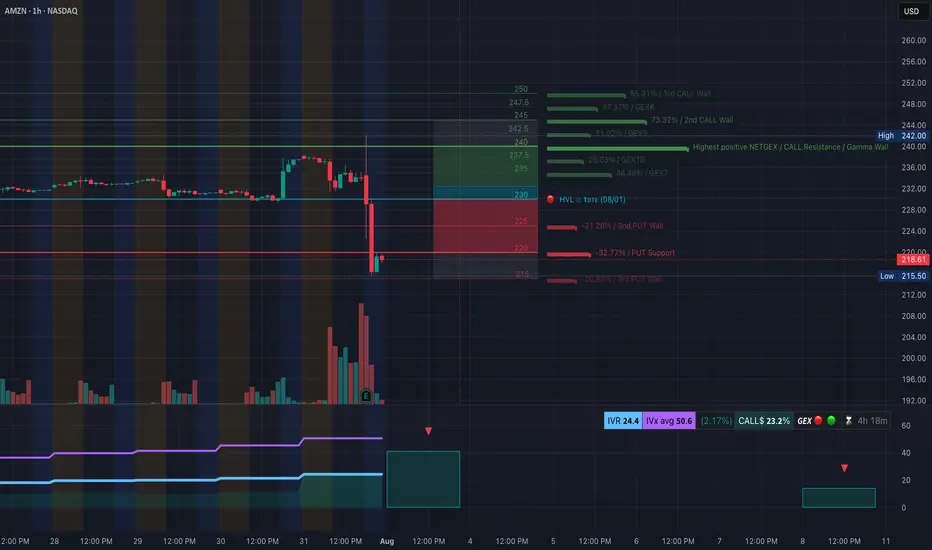
AMZN Earnings Flush — Gamma Flip to the Downside. 8/1AMZN Earnings Flush — Gamma Flip to the Downside, Eyes on $215 Support!
🔍 GEX & Options Flow Insight (1st Image Analysis)
AMZN collapsed post-earnings, breaking through major gamma support levels and flipping into a negative gamma environment. Price is now pressing against a critical $215–218 demand zone, with GEX showing heavy put concentration.
* Call Walls & Resistance:
* 📍 $230.00–$234.00 → Former gamma pivot now acting as strong resistance
* 📍 $237.50 → Prior support zone; now a sell wall
* 📍 $244.00 → Highest Positive NET GEX / Gamma Wall (too far for immediate recovery unless momentum shifts)
* Put Walls & Support Zones:
* 🛡️ $222.18 → 2nd Put Wall resistance-turned-support
* 🚨 $218.00 → Current price — key defense line
* 📉 $215.50 → Hard put wall support — losing this could accelerate selloff toward $210
* Volatility Insight:
* IVR 24.4, IVx Avg 50.6 → Elevated IV post-earnings
* Call flow 23.2% → Bearish options flow bias
* GEX sentiment: 🔴🟡🔴 = Negative gamma = higher volatility risk to downside
✅ Option Trading Suggestion:
Bias: Bearish unless AMZN reclaims $224+
Strategy: Bear put spread
* Entry Idea: Buy 220P / Sell 215P for Aug 2 or Aug 9 expiry
* Invalidation: Strong daily close above $224
* Target: $215 → $210
Why this works: Negative gamma positioning means market makers hedge by selling into weakness, accelerating downside moves. The inability to reclaim $224 confirms the bearish structure.
🧠 Technical Analysis (1H Chart) (2nd Image Analysis)
Market Structure & SMC:
* 🟥 CHoCH confirmed after earnings drop
* ❌ Lost all recent BOS levels in one sharp flush
* Price trapped under former OB resistance at $224–230
Trendline Dynamics:
* Broke out of prior bullish channel to the downside
* New descending channel forming with lower highs
SMC Zones:
* 🟩 Demand Zone: $215.50–$218.00 → Immediate defense
* 🟥 Supply Zone (Purple Box): $224–$230 → Sell wall
🔄 Price Action & Key Levels
* Support:
* ✅ $218.00 → Current defense
* ✅ $215.50 → Last line of gamma support
* 🚨 Below $215.50 → Sell momentum can accelerate to $210
* Resistance:
* 🚩 $224.00 → First reclaim needed for relief rally
* 🚩 $230.00–$234.00 → Heavy resistance
🧭 Scalping / Intraday Trade Setup
🟥 Bearish Setup (Preferred):
* Entry: Failed reclaim of $224
* Target 1: $218.00
* Target 2: $215.50
* Stop: Above $224
🟩 Bullish Reversal Setup:
* Entry: Strong reclaim of $224 with volume
* Target 1: $230.00
* Target 2: $234.00
* Stop: Back under $222
🔁 Summary Thoughts
* AMZN flipped from bullish gamma to negative gamma — puts are now driving price action.
* As long as price stays under $224, rallies are sell opportunities.
* Losing $215.50 risks an accelerated drop to $210 or lower.
* Bears remain in control unless buyers step in aggressively at support.
🚨 Disclaimer:
This analysis is for educational purposes only and does not constitute financial advice. Always do your own research and manage your risk accordingly.
#BTCUSD Short term buying LevelsBINANCE:BTCUSD Short term looks bullish and heading towards 132000$, Any panic is a buy at equal legs
