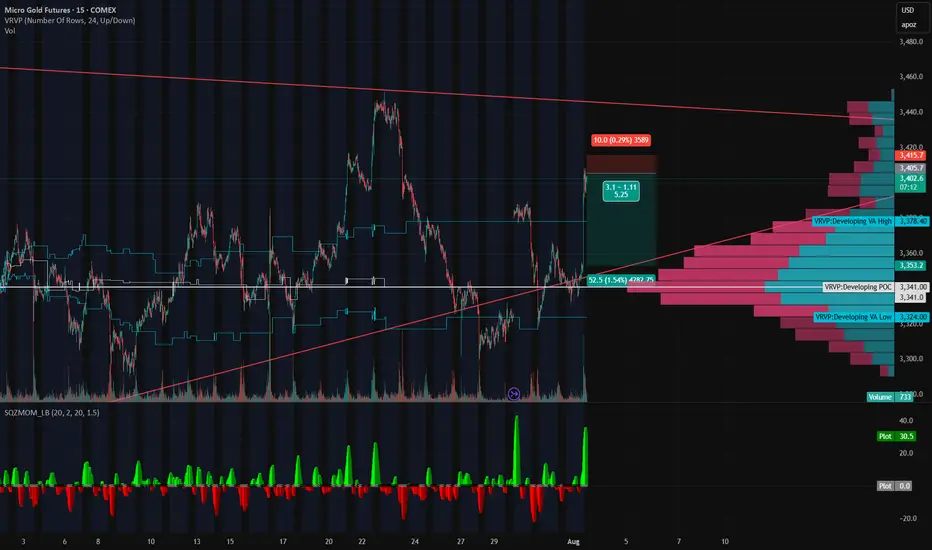
Gold’s on a Roller Coaster — and We’re Riding It Down🎢 Gold’s on a Roller Coaster — and We’re Riding It Down 🎢
Gold just snapped up like it saw Trump tweet “TARIFFS ARE BACK” — but the move smells like a knee-jerk algo pump, not real conviction. We just rejected right into a thin-volume imbalance zone and tagged the underside of a long-standing trendline.
📉 Short Setup Locked In:
💥 Entry: 3405
🛑 Stop: 3415
🎯 Target: 3353
💰 R:R ≈ 5:1
🔍 Why I'm In This Trade:
That rip? Total headline panic, not structural strength.
Low volume shelf above, with a massive POC magnet below at 3353.
We tapped the Developing VAH (3414) and got rejected — classic trap setup.
SQZMOM showing the energy is already fizzling. Green flash, no follow-through.
🧠 The Narrative:
Gold’s trying to price in volatility from every angle — Trump talk, tariffs, macro chaos — but under the hood, this pop looks unsustainable. If this is just a liquidity grab, we could see a flush back into the meat of value fast.
Grab your helmets — this roller coaster might just be heading downhill 🎢📉
Trend Analysis
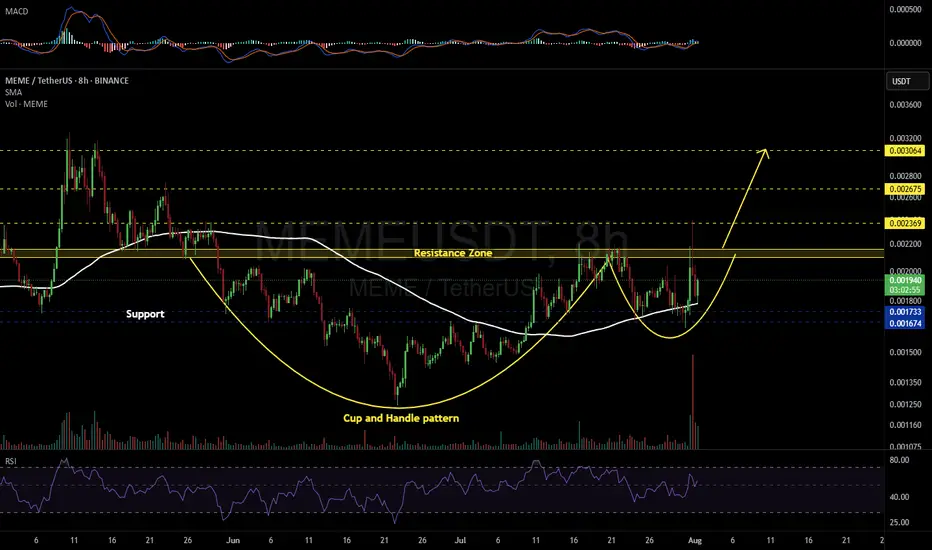
MEMEUSDT 8H#MEME has formed a Cup and Handle pattern on the 8H timeframe. It has bounced nicely off the SMA100, and volume is showing signs of strong accumulation.
📌 Consider entering this coin only after a solid breakout above the resistance zone.
If the breakout occurs, the potential targets are:
🎯 $0.002369
🎯 $0.002675
🎯 $0.003064
⚠️ As always, use a tight stop-loss and apply proper risk management.
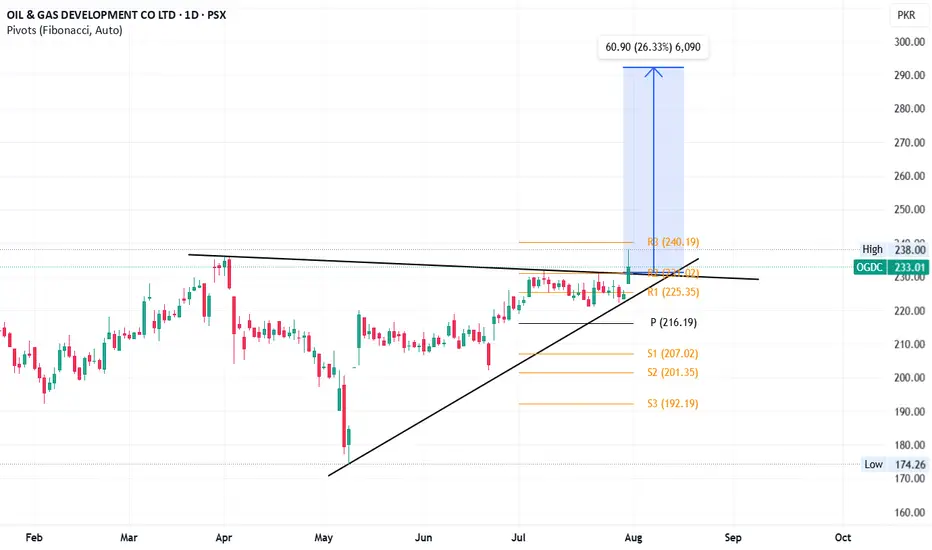
OGDC Breakout?On a daily timeframe, OGDC has given breakout of a triangle pattern. This will open up doors for it to move towards its all-time high i.e. ~290 region.
This is my personal opinion, not a buy / sell call.
All other indicators e.g. RSI, Stoch and MACD are bullish as well.
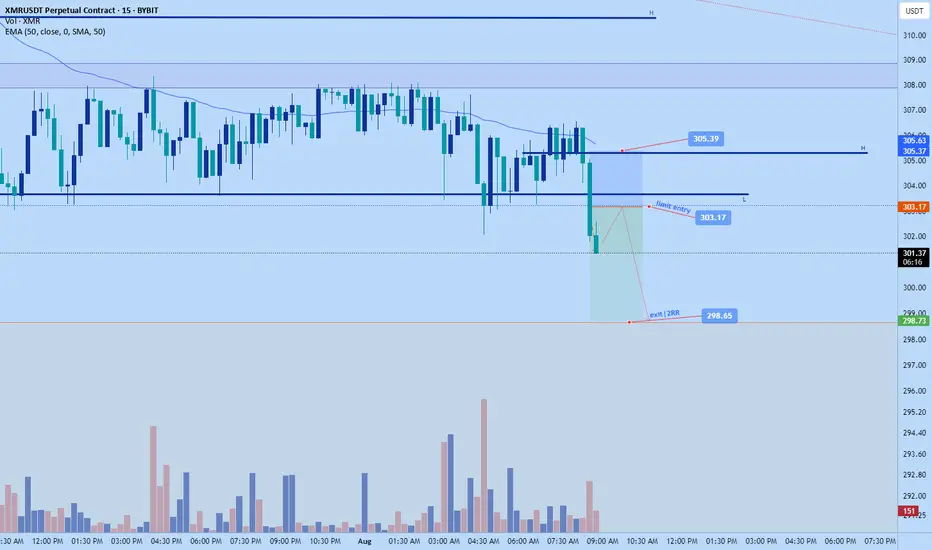
Monero dump now back to $298.65Monero limit order short. Checked it late but might still be able to get in.
Sl: $305.39
Limit entry: 303.17 (bybit)
Tp: $298.65
Risk to reward: 1:2
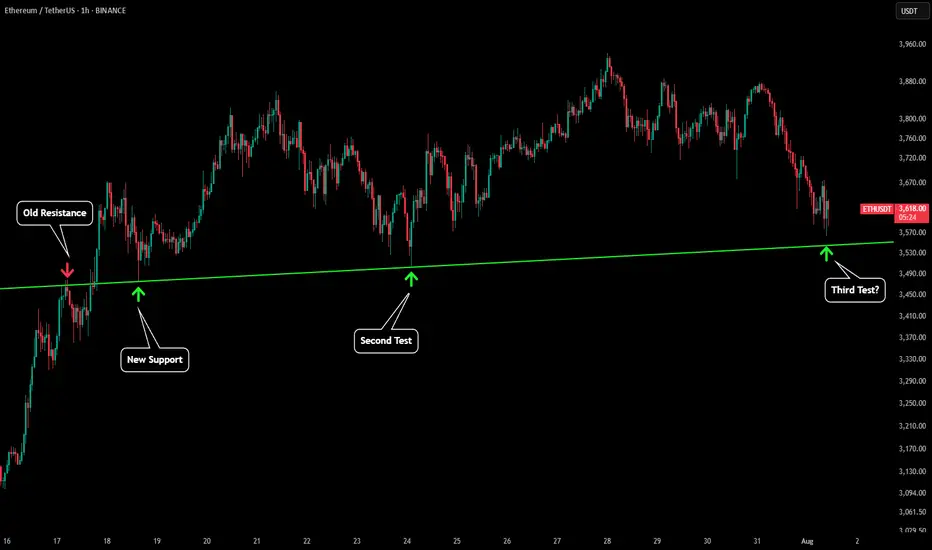
ETH - Still Respecting Important LinesPlease refer to our previous post:
Eth looks to be going for a third test of our green trendline. This would price around $3,550 which is also the 1D 21 MA. Therefore continuing to close daily candles above that price level will keep the uptrend in tact.
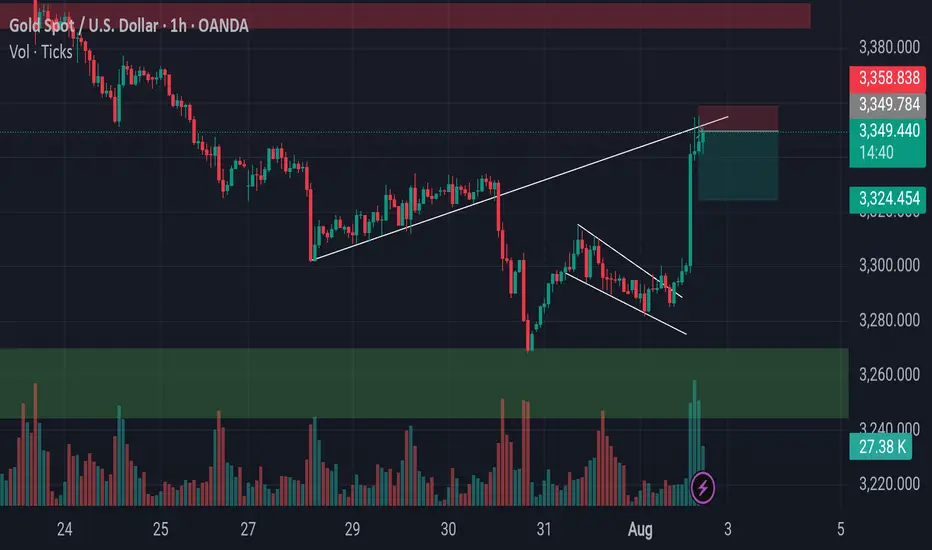
Gold Approaches Key Reversal Zone After Liquidity Sweep.Gold has recently broken out of a parallel channel during the New York session, followed by a strong upward move triggered by the NFP (Non-Farm Payroll) news event. Currently, the market is trading near a key trendline resistance zone. In this area, the price has also swept the liquidity residing above recent highs, indicating that potential buy-side liquidity has been taken out.
This level now becomes critical for observation. If the market forms a Market Structure Shift (MSS) or provides any valid bearish confirmation — such as a strong rejection candle, bearish engulfing, or a break of lower timeframe support — then there is a high probability that a downward move may follow from this zone.
As always, conduct your own research (DYOR) and wait for price action to confirm the bias before executing any trades. Acting on confirmation rather than assumptions protects both capital and strategy.
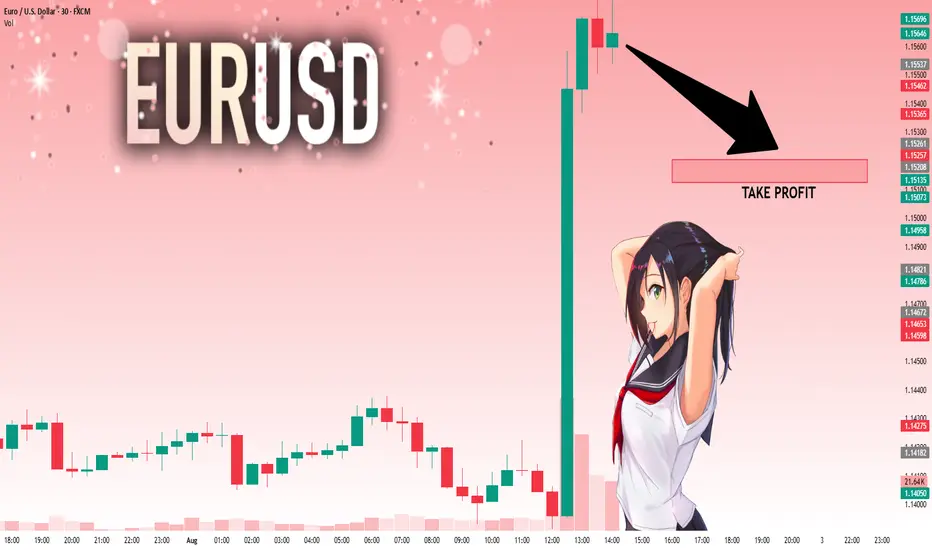
EURUSD: Move Down Expected! Short!
My dear friends,
Today we will analyse EURUSD together☺️
The price is near a wide key level
and the pair is approaching a significant decision level of 1.15337 Therefore, a strong bullish reaction here could determine the next move up.We will watch for a confirmation candle, and then target the next key level of 1.15208.Recommend Stop-loss is beyond the current level.
❤️Sending you lots of Love and Hugs❤️
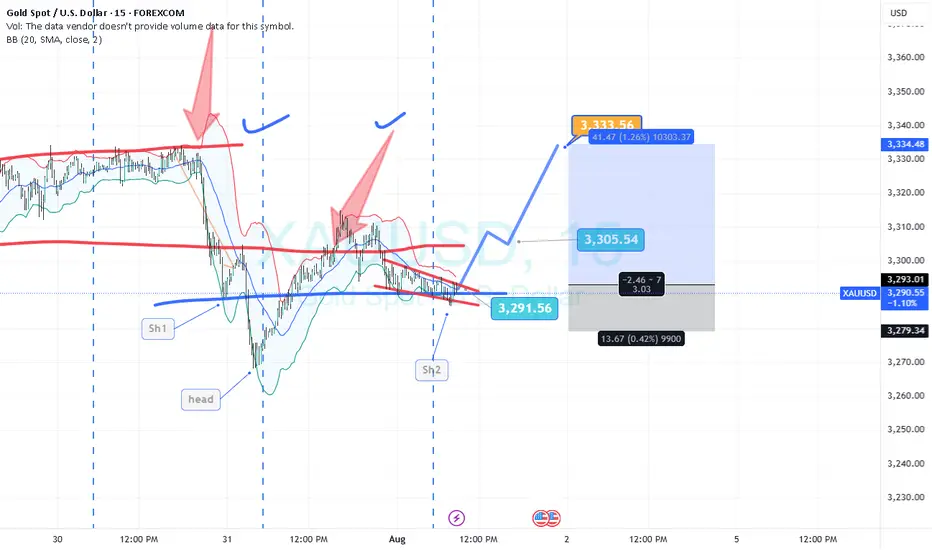
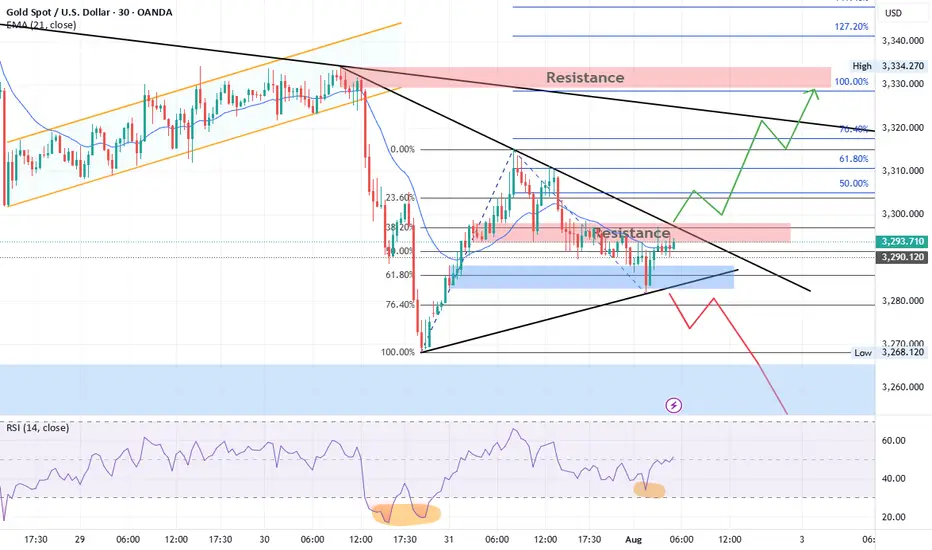
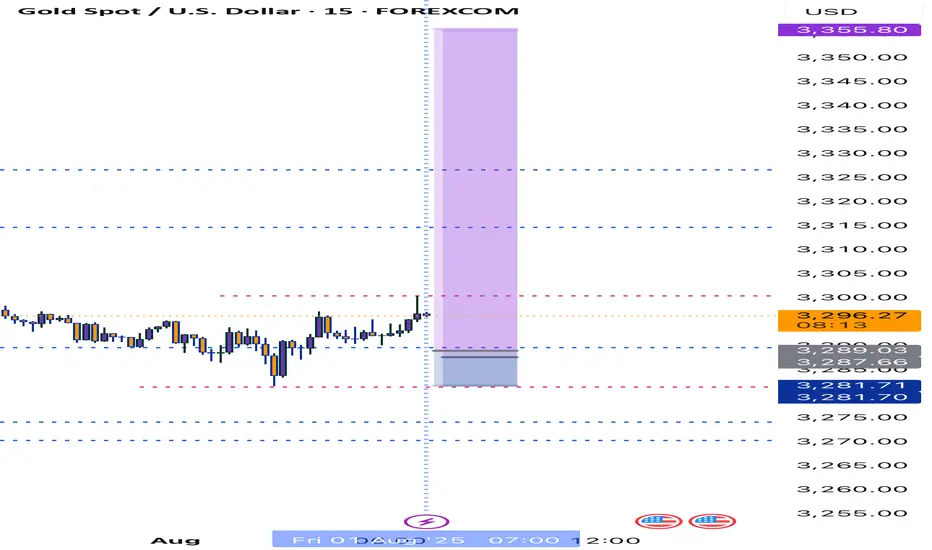
Gold Technical Outlook
Gold is currently consolidating inside a triangle pattern. After a recent bullish rally, price retraced between the 61.8% – 76.4% Fibonacci levels, finding support and bouncing upward. At present, gold is facing resistance at both the falling trendline and the 3298–3300 zone.
Bullish Scenario:
A breakout above the resistance trendline and the 3298–3300 zone could trigger a strong bullish move toward 3311, 3322, and 3333. A sustained break above 3333 would confirm a short-term bullish trend, opening the way for higher targets at 3360 and 3400.
Bearish Scenario:
If price faces rejection from the 3300 resistance and the falling trendline, gold is expected to move lower, retesting 3270. A decisive break below 3270 may extend the decline toward 3250. If 3250 is broken, gold could enter strong bearish momentum, potentially shifting the long-term trend to the downside with targets at 3000 and 2850.
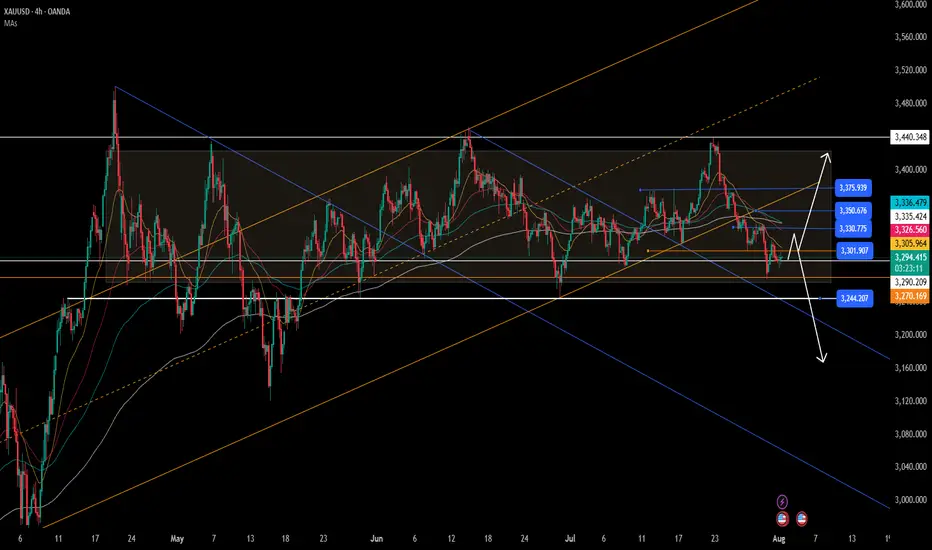
OANDA:XAUUSD Gold Technical Outlook
Gold continues to go long in the 3280-3300 range.Gold continues to go long in the 3280-3300 range.
Today, we remain firmly bullish on a bottom in the 3280-3300 range.
On August 1st, the Federal Reserve, while keeping interest rates unchanged, acknowledged slowing economic growth, triggering a repricing of expectations for a rate cut.
This led to a rebound in gold prices, but of course, this was just a pretext for the price increase.
Recently, gold prices experienced a four-day decline (July 23-28), falling from $3431 to $3268, as progress in trade negotiations and a rebound in the US dollar dampened safe-haven demand.
Non-farm Payrolls
Here are the key takeaways:
Today's US July non-farm payrolls data (expected to increase by 110,000, compared to 147,000 previously) will determine expectations for a September rate cut by the Federal Reserve.
A weak reading (e.g., below 100,000) could push gold prices back towards $3,400;
A strong reading (above 150,000) would remain bearish for gold. Gold prices continue to decline, and we are long in the 3280-3300 range.
Today, we remain firmly bullish on gold bottoming in the 3280-3300 range.
On August 1st, the Federal Reserve, while keeping interest rates unchanged, acknowledged slowing economic growth, triggering a repricing of rate cut expectations in the market.
This led to a rebound in gold prices, but of course, this was just a pretext for the price increase.
Recently, gold prices experienced a four-day decline (July 23-28), falling from $3431 to $3268, as progress in trade negotiations and a rebound in the US dollar dampened safe-haven demand.
Non-farm Payroll Data
Here are the key takeaways:
Today's US July non-farm payroll data (expected to increase by 110,000, compared to 147,000 previously) will determine expectations for a September rate cut by the Federal Reserve. A weak reading (e.g., below $100,000) could push gold back to $3,400.
A strong reading (above $150,000) would continue to be bearish for gold.
Technical Analysis and Trading Recommendations
Key Levels:
Support:
$3,270 (100-day moving average)
$3,248 (June low);
Resistance:
$3,300 psychological level
$3,340 (21-day/50-day moving average crossover).
Trading Strategy:
Short-term:
1: If the price holds above $3,300, initiate a long position with a target of $3,330-3,350.
2: If the price falls below $3,270, a drop to $3,248 is possible.
3: Focus on the key watershed at $3,300
4: Key Point:
As long as the gold price is above $3,300, I believe it's a good time to buy the dip. Following the upward trend in gold prices is a very wise choice.
As shown in Figure 4h:
The potential for gold prices to rebound is becoming increasingly clear.
The lower edge of the wide fluctuation range is slowly stabilizing.
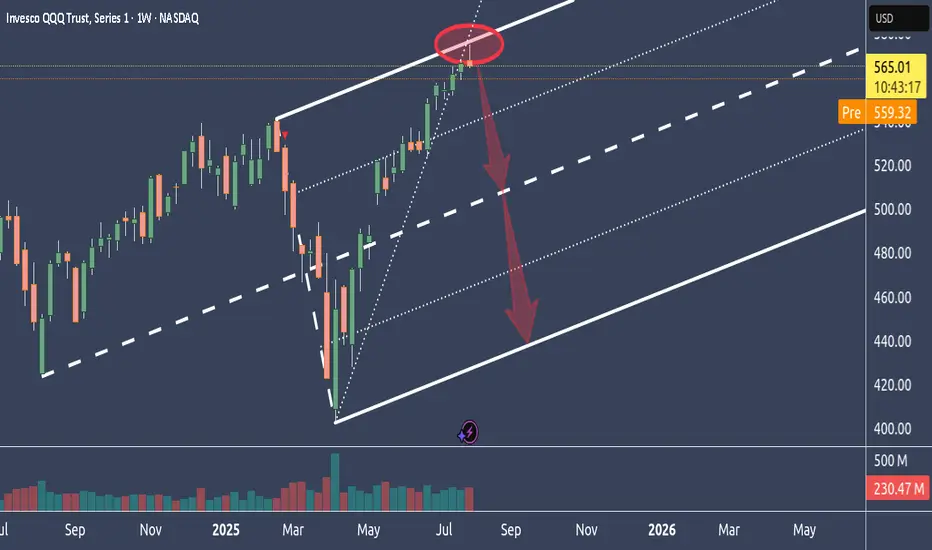
Why NQ is probably tanking big timeIn this weekly chart, we see QQQ, which represents the Nasdaq.
As we can see, it had a hell of a run up.
Too far too fast IMO, and it reached the stretch level at the Upper Medianline Parallel.
The natural move is now to let go, take a breath and trade down to center again, which is the Centerline.
After all the most major and most important earnings results are over, and Funds have pumped up their gains through manipulative Options plays, it's time to reap what they have planted and book the gains.
It's all in line with, all moves are at the point, and everything is showing in a simple chart.
Unless price is opening and closing outside of the U-MLH, it's time to load the Boat and sail to the South.
BuyLondon Session
Daily Volume
Untapped Zone
Market Structure
NT:: Limit order must be tapped before the breach of the red line
$SPY: Mapping Scenarios🏛️ Research Notes
Fractal Corridors
Shows recursive formations which indicates a full fractal cycle.
The angles of decline are parallel which is important for potential buildup.
To map a cycle we'd need to apply fib channel to the opposite direction In a way this should be sufficient to cover the scenarios of nearest future if we were to use bar patterns to validate a structure.
These are examples of historic progressions with similar growth patterns (composite sub-cycles):
This explains most elements present in interactive chart.
#eth idea of short im already in it dyoreth/usd idea of short im already in it DYOR
wht im seeing eth give potentially much gains in this quarter
so its time to fill the remaining below and fullfill them
well im not financial advisor but here u can see to other dimention of digital silver
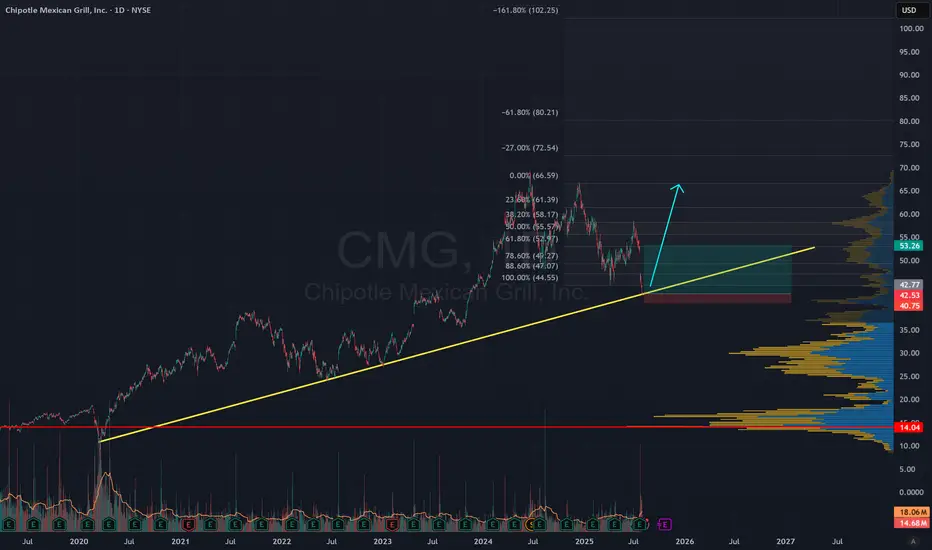
Long live Burrito Bowls Currently at strong support level, should close the gap above with greater upside potential.
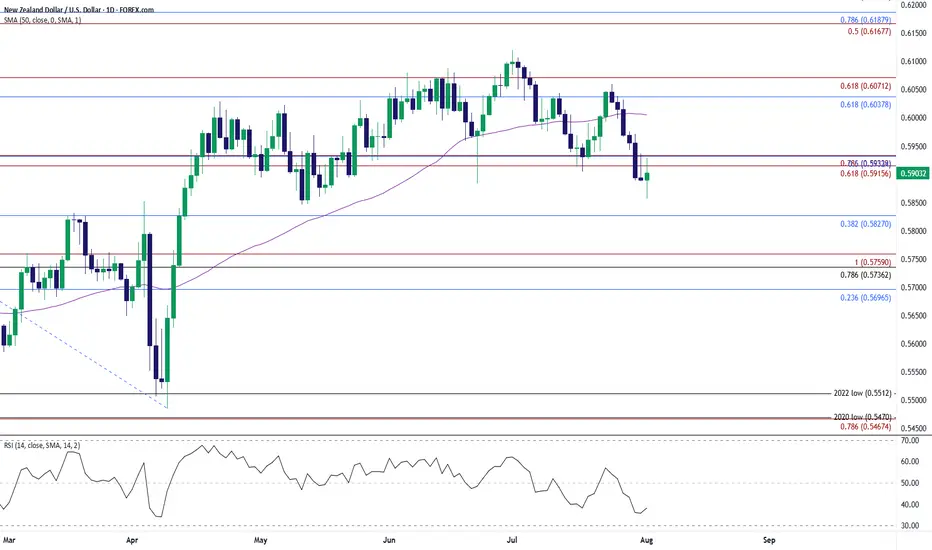
NZD/USD Holds Above May LowNZD/USD halts the decline from earlier this week to hold above the May low (0.5847), with a move/close above the 0.5920 (61.8% Fibonacci extension) to 0.5930 (78.6% Fibonacci extension) region bringing the 0.6040 (61.8% Fibonacci retracement) to 0.6070 (61.8% Fibonacci extension) zone on the radar.
Next area of interest comes in around the July high (0.6120), but the rebound in NZD/USD may turn out to be temporary if it struggles to trade back above the 0.5920 (61.8% Fibonacci extension) to 0.5930 (78.6% Fibonacci extension) region.
A breach of the May low (0.5847) opens up 0.5830 (38.2% Fibonacci retracement), with the next area of interest coming in around 0.5740 (78.6% Fibonacci retracement) to 0.5760 (100% Fibonacci extension).
--- Written by David Song, Senior Strategist at FOREX.com
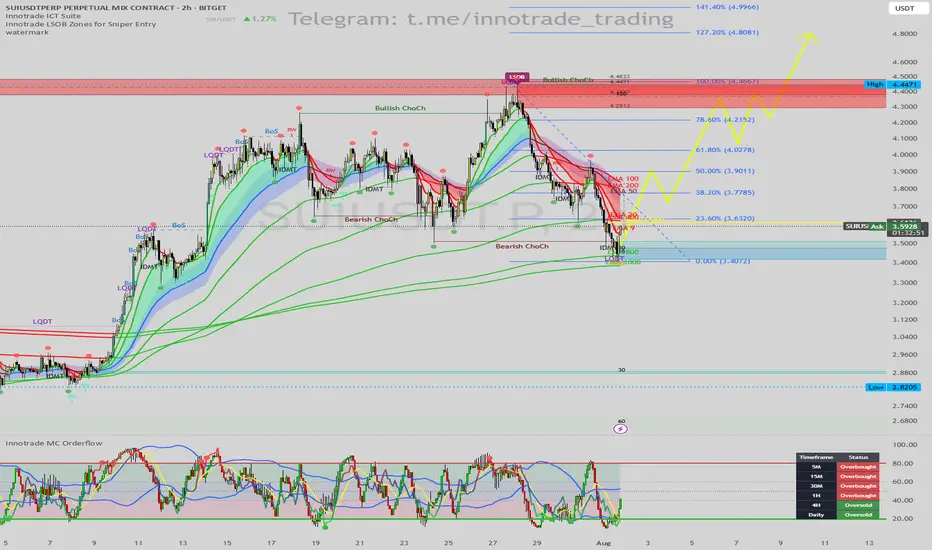
SUI/USDT: Prime Long Setup from LSOB Demand & Daily OversoldHello traders,
This analysis highlights a high-probability long setup on SUI/USDT (2H Chart). The current price action presents a classic institutional-style reversal pattern, strongly confirmed by momentum indicators signaling a bottom may be in.
1. Trend & Context (The "Why")
While the short-term trend has been corrective after a "Bearish ChoCh," price has now entered a major area of interest where a powerful bullish move could originate.
Here is the confluence checklist:
Primary Signal (LSOB Zone): Price has tapped into a key Bullish LSOB (Liquidity Sweep Order Block). This is a critical demand zone where smart money is likely to absorb selling pressure and initiate long positions.
Liquidity Sweep Confirmation: The price action confirms this with a clear Liquidity Sweep (LQDT), where the price wicked down to take out stops below the previous lows before reversing. This is a very strong bullish signal.
Momentum Exhaustion (MC Orderflow): This is where the setup gains its highest conviction:
The MC Orderflow oscillator is in the EXTREME OVERSOLD territory, indicating that sellers are exhausted.
CRITICAL MTF CONFLUENCE: The Multi-Timeframe Cycle Table is showing that both the 4H and Daily timeframes are "Oversold." This alignment of higher timeframe momentum with our 2H demand zone is the most powerful confirmation for this trade.
2. Entry, Stop Loss, and Targets (The "How")
This confluence provides a clear and structured trade plan with excellent risk-to-reward potential.
Entry: An entry around the current price ($3.50 - $3.58) is ideal, as we are in the LSOB demand zone. For a more conservative entry, one could wait for the 2H candle to close bullishly.
Stop Loss (SL): $3.38. This places the stop loss just below the low of the liquidity sweep wick. If this level is broken, the bullish setup is invalidated.
Take Profit (TP) Targets:
TP1: $3.90 (Targeting the cluster of short-term EMAs and the recent swing high).
TP2: $4.28 (The next major structural resistance).
TP3: $4.45 (The major swing high, which is also a Bearish LSOB supply zone).
Conclusion
This trade presents a superb opportunity due to the powerful combination of a price-action sweep into a key demand zone (LSOB), confirmed by severe multi-timeframe momentum exhaustion. This alignment across indicators points towards a high-probability bullish reversal.
Disclaimer: This is not financial advice. This analysis is for educational purposes only. Always conduct your own research and manage your risk appropriately.
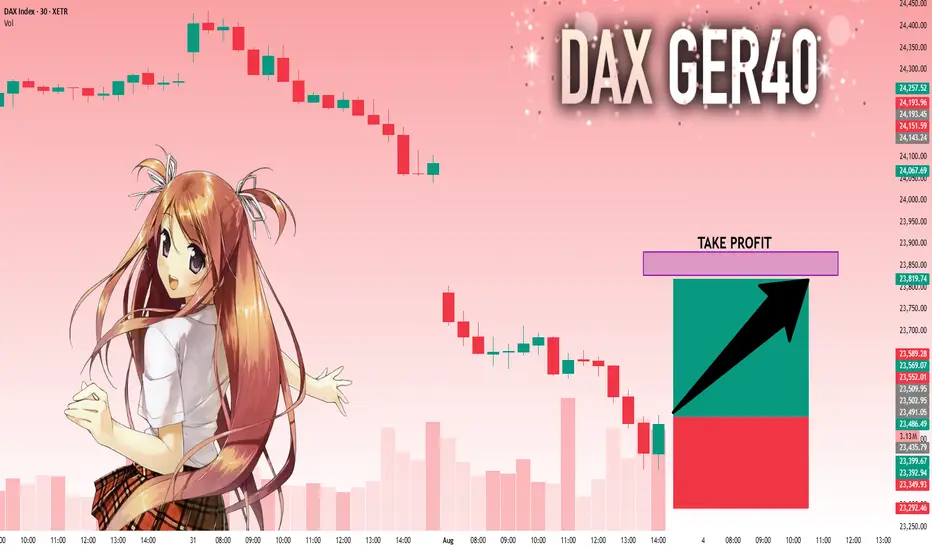
DAX: Next Move Is Up! Long!
My dear friends,
Today we will analyse DAX together☺️
The in-trend continuation seems likely as the current long-term trend appears to be strong, and price is holding above a key level of 23,502.95 So a bullish continuation seems plausible, targeting the next high. We should enter on confirmation, and place a stop-loss beyond the recent swing level.
❤️Sending you lots of Love and Hugs❤️
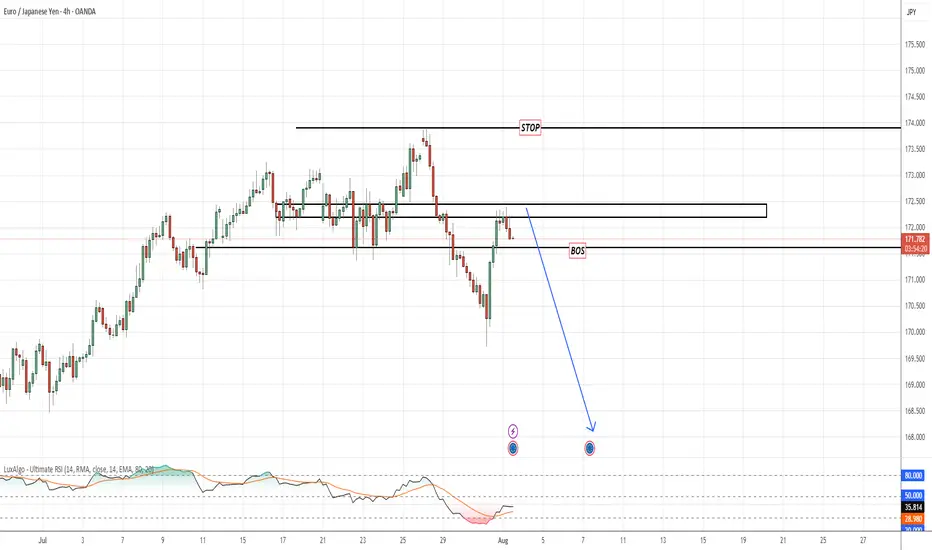
EURJPYPrice just broke key internal structure with a clear BoS (Break of Structure) after liquidity sweep above the previous highs. We're now watching for a clean retracement to the supply zone to execute a sniper short.
📍 Setup Details:
BoS Confirmed: 172.00 level cleanly broken
Area of Interest: Supply zone 172.90–173.60
Stop: Above liquidity zone ~174.55
Target: Downside continuation toward 168.00–167.00
📉 RSI shows momentum weakness on the pullback
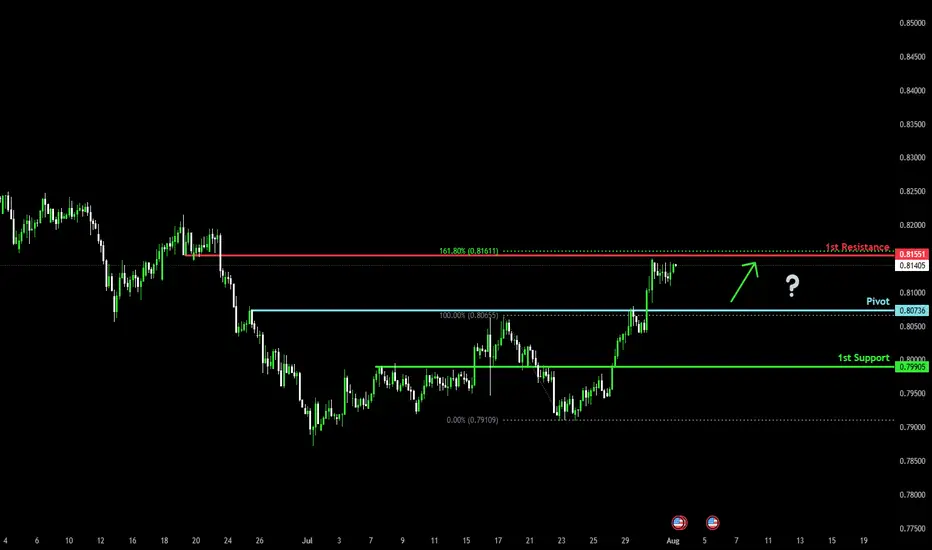
Bullish bounce off pullback support?The Swissie (USD/CHF) is falling towards the pivot, which acts as a pullback support and could bounce to the 1st resistance, which lines up with the 161.8% Fibonacci extension.
Pivot: 0.8073
1st Support: 0.7990
1st Resistance: 0.8155
Risk Warning:
Trading Forex and CFDs carries a high level of risk to your capital and you should only trade with money you can afford to lose. Trading Forex and CFDs may not be suitable for all investors, so please ensure that you fully understand the risks involved and seek independent advice if necessary.
Disclaimer:
The above opinions given constitute general market commentary, and do not constitute the opinion or advice of IC Markets or any form of personal or investment advice.
Any opinions, news, research, analyses, prices, other information, or links to third-party sites contained on this website are provided on an "as-is" basis, are intended only to be informative, is not an advice nor a recommendation, nor research, or a record of our trading prices, or an offer of, or solicitation for a transaction in any financial instrument and thus should not be treated as such. The information provided does not involve any specific investment objectives, financial situation and needs of any specific person who may receive it. Please be aware, that past performance is not a reliable indicator of future performance and/or results. Past Performance or Forward-looking scenarios based upon the reasonable beliefs of the third-party provider are not a guarantee of future performance. Actual results may differ materially from those anticipated in forward-looking or past performance statements. IC Markets makes no representation or warranty and assumes no liability as to the accuracy or completeness of the information provided, nor any loss arising from any investment based on a recommendation, forecast or any information supplied by any third-party.
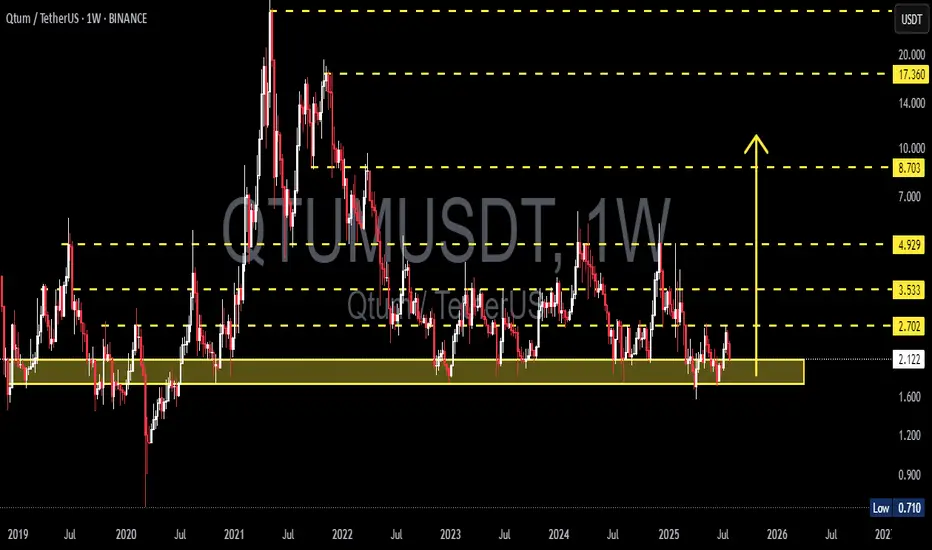
QTUM/USDT – Make or Break? Testing the Edge of Accumulation?🧠 Overview:
After going through a volatile multi-year cycle, QTUM is now back at one of the most critical historical support zones. This demand area has acted as a strong reversal point multiple times since 2020 and is once again being tested as price consolidates near the bottom of its macro range.
---
📉 Price Structure & Key Levels:
📍 Major Support Zone (1.70 – 2.10 USDT):
A proven accumulation zone based on multiple long wicks and price rejections in the past.
This is where smart money tends to accumulate during market uncertainty.
📍 Layered Resistance Levels (Bullish Targets):
2.70 USDT → Initial breakout validation
3.53 USDT → Mid-range resistance
4.93 USDT → Key structural level
8.70 USDT → Mid-term breakout target
17.36 USDT → Peak from previous macro cycle
---
🧩 Current Pattern: "Sideways Accumulation Range"
QTUM is clearly in a range-bound accumulation phase, with tight price action within a key support area. Historically, such patterns often precede large impulsive moves, especially when accompanied by volume surges and breakouts from structure.
> ⚠️ Important Note: Sideways movement at historical support, combined with increasing accumulation volume, often leads to a breakout into the markup phase.
---
📈 Bullish Scenario: Potential Upside Momentum
Trigger: A confirmed breakout and weekly candle close above 2.70 USDT.
Additional Confirmation: Strong bullish candle with increased volume.
Targets:
3.53 USDT (local resistance)
4.93 USDT (mid-range structural level)
8.70 USDT (swing target)
17.36 USDT (macro cycle high)
🎯 High reward-to-risk potential if entries are made near support with a stop-loss under 1.70 USDT.
---
📉 Bearish Scenario: Breakdown Risk
Trigger: Weekly candle closes below 1.70 USDT.
Implication: Breakdown from long-term demand zone.
Downside Targets:
1.20 USDT → Minor horizontal support
0.71 USDT → Historical all-time low
Warning Sign: High volume breakdown = likely sign of institutional selloff or panic exit.
---
📊 Strategic Summary:
> QTUM is at a pivotal crossroads.
The 1.70 – 2.10 USDT range is a decisive area.
A bullish breakout could spark a major recovery rally,
while a breakdown may lead to a deeper capitulation.
This is a “calm before the storm” situation. Traders should monitor closely as the next few weekly candles could define the trend for the rest of 2025.
#QTUMUSDT #QTUM #CryptoAnalysis #AltcoinSetup #TechnicalAnalysis #AccumulationPhase #SupportAndResistance #BreakoutPlay #CryptoBreakout
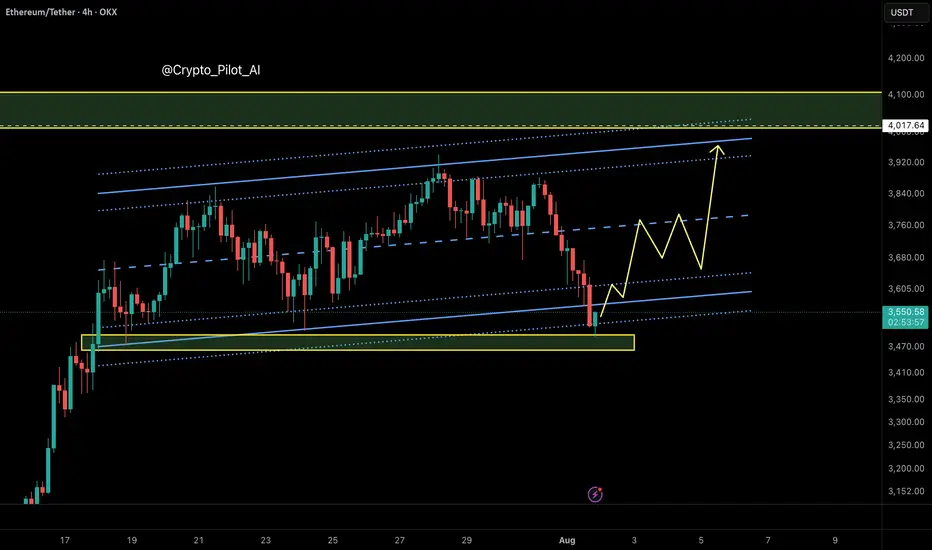
Ethereum: Smart Money Reversal After Stop Hunt?In the previous update, we warned that Ethereum might drop lower before any meaningful bounce — especially if it failed to hold the midline of the ascending channel. That scenario played out exactly as anticipated.
🟡 Price action summary:
ETH broke below the midline of the weak ascending channel, hunted the liquidity below recent lows, and tapped into the key bullish order block near $3,490 – $3,520. Price is now reacting to this zone with early signs of a reversal.
📌 Key observation:
Midlines of weak or low-momentum channels often act as liquidity traps in smart money models. Buying at these levels can be extremely risky — especially during corrective or distribution phases.
⸻
📚 Educational Note:
Never enter long positions solely at the midline of a weak ascending channel, especially when there’s a high probability of liquidity sweep below. Smart entries usually occur at order blocks formed after stop hunts.
⸻
🎯 Next steps:
Wait for confirmation (such as internal BOS or FVG closure) before entering longs. The structure suggests a potential move back toward the upper boundary of the channel if this OB holds.
⸻
🔗 Save this analysis and share it with fellow traders.
💬 Thoughts? Drop your view in the comments.
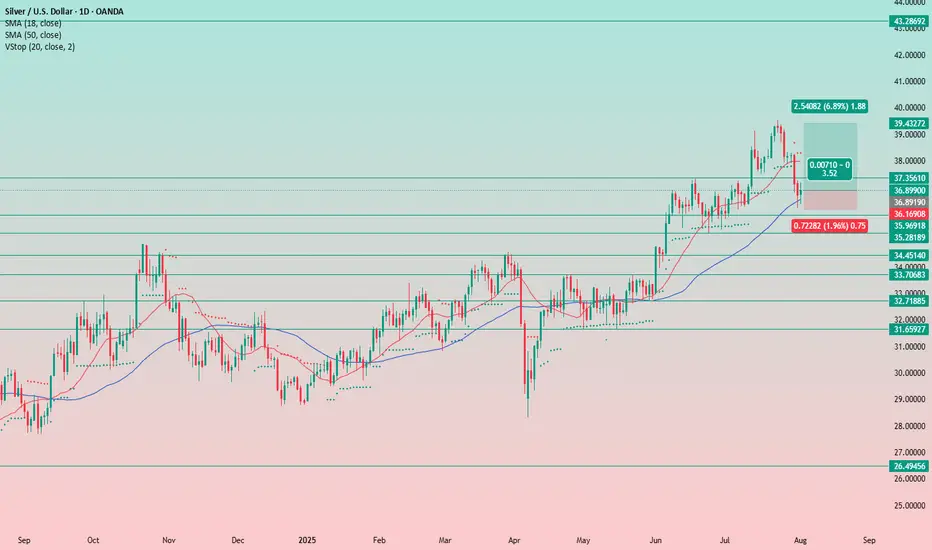
Silver Remains a Buy on DipsIt seems the precious metals market didn’t mourn the Fed’s decision and subsequent press release for long.
The uptrend remains intact, and the previously supportive factors are still in play.
Even amid the negative news, there was no sharp sell-off — everything stayed within the trend. This clearly signals that rate cuts are on the horizon, and metals are likely to continue their upward move.
We only trade from the long side — nothing has changed.
At the moment, we've seen a pullback, and it feels strange not to take advantage of it and add more silver to the portfolio.
Stop-loss is set below yesterday’s candle low at 36.15.
We’ll see how the position develops. For now, the idea is to hold as long as the stop-loss holds. The long-term target is 48. Obviously, we won't reach it quickly, so I’ll trail the stop as the trade progresses — first to breakeven, and eventually into profit.