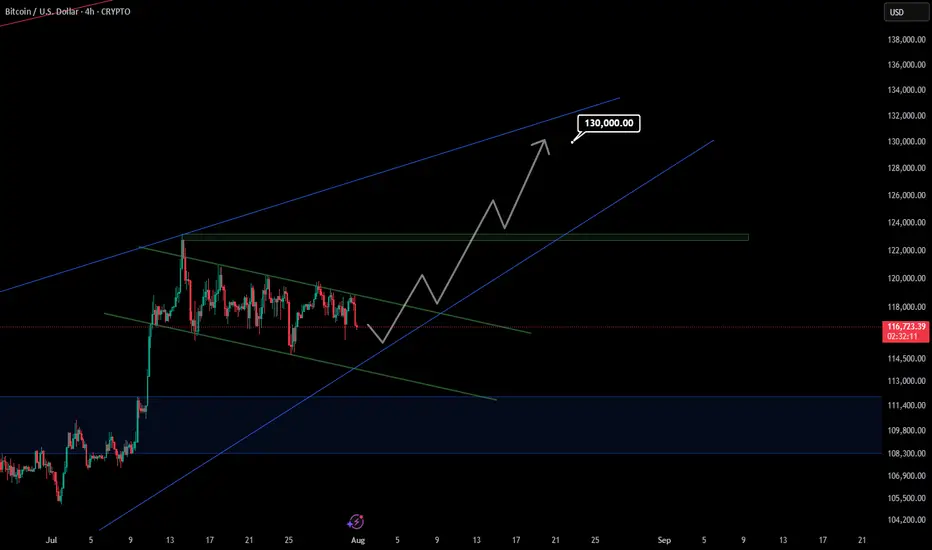
Bitcoin to 130kBTC is still moving inside the falling wedge. A bounce from the lower boundary could trigger a breakout and push price toward $130,000 in the coming weeks.
Trend Analysis
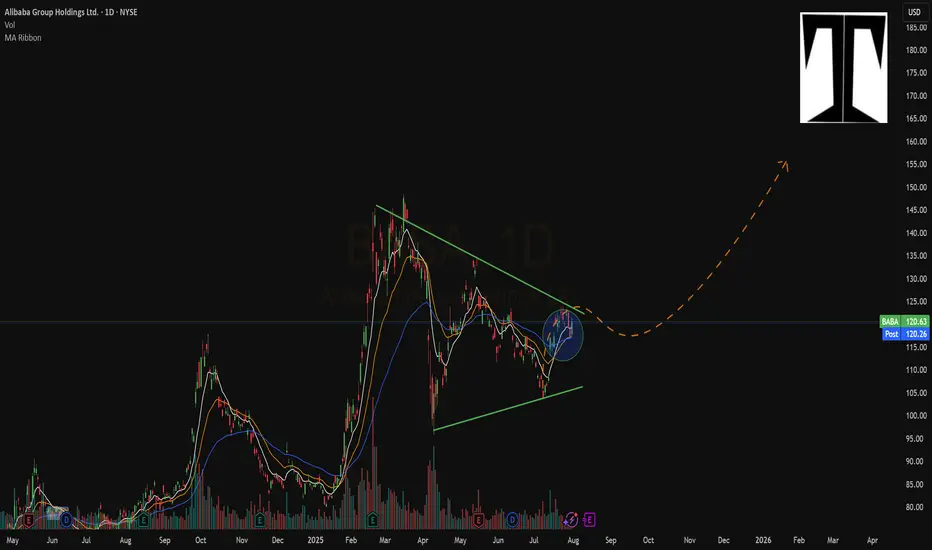
New Setup : $BABAInside this wedge there is a nice pullback to the ema 50.
Bullish ATR Break popped out with a new crossover.
Ready To Catch It !
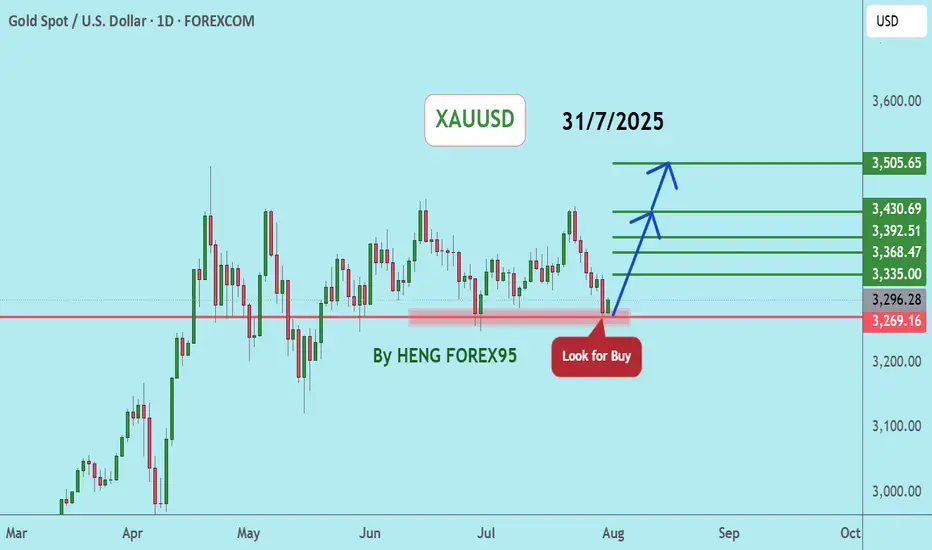
XAUUSDUpdate:
Gold Price Trend: As per our previous analysis on July 28, 2025, the price has now tested the support at 3,269. We expect that if the gold price can hold above 3,249, the gold price trend will remain bullish. We recommend considering buying in the red zone.
🔥Trading futures, forex, CFDs and stocks carries a risk of loss.
Please consider carefully whether such trading is suitable for you.
>>GooD Luck 😊
❤️ Like and subscribe to never miss a new idea!

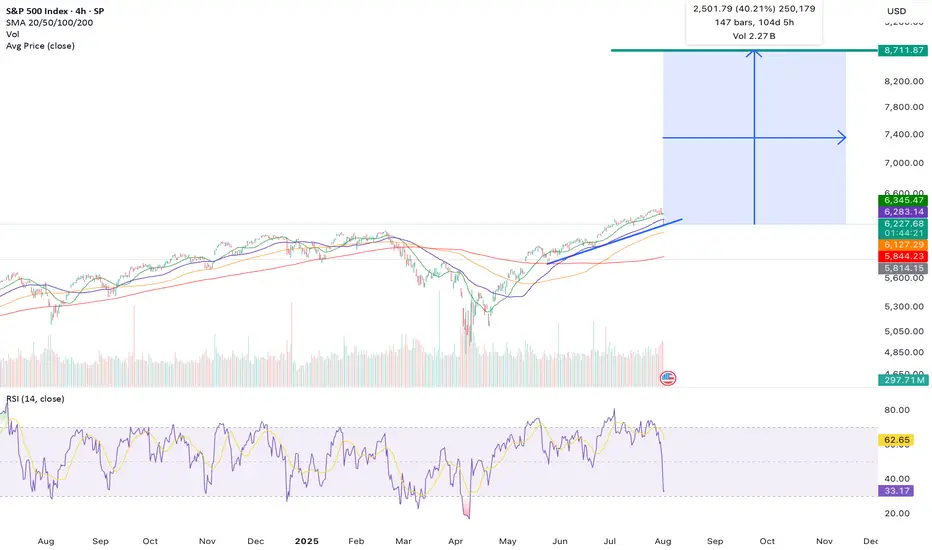
The Low Is In: Why the S&P 500 Just Confirmed a Bullish Reversal🔥 The Low Is In: Why the S&P 500 Just Confirmed a Major Bullish Reversal 🔥
The market just gave us a gift.
After weeks of drifting lower and sentiment turning cautious, the S&P 500 has touched — and bounced — off a critical rising trendline for the third time since May 2025. That third touch isn't just a technical coincidence… it's often the launchpad for a new impulsive leg higher.
📈 The Power of the 3rd Touch: Trendline Validation Complete
Look at the chart. This isn’t guesswork. Since May, the S&P 500 has been respecting a well-defined ascending trendline, one that connects multiple higher lows during this bull run.
The first touch was the May liftoff after the April consolidation.
The second came in June — a clean retest and bounce.
Now, as of early August, the third touch has held once again, exactly where the bulls needed it most.
This isn’t a random line on a chart. This is institutional flow stepping in to defend structure.
And when a rising trendline holds for a third time after a strong uptrend? That’s a classic continuation signal.
📉 RSI Washout + Structural Support = Perfect Storm for a Bottom
The RSI printed a dramatic dip to ~32, a level that screams “oversold” on the 4-hour timeframe. But notice the context — it happened right at structural support.
This is not weakness. This is accumulation.
Big players shake out weak hands on low timeframes… right before they send it.
🧠 Sentiment Is Offside… Again
Let’s not forget: this retrace came after a huge run-up since March. People expected a deeper correction. Bears started getting loud again.
That’s how bull markets trap you — by convincing you it’s over right before the next leg higher.
And with macro tailwinds (liquidity expansion, fiscal spend, tariff rollbacks), earnings season beats, and global capital rotation into U.S. equities, this setup is ripe for a violent upside squeeze.
🚀 8,700 in Sight: My End-of-Year Price Target Is Very Much in Play
Today’s close around 6,220 means the S&P 500 would need to rally ~40% to hit my target of 8,700 by year-end.
Sounds crazy? Not if you’ve seen what happens during parabolic melt-ups.
This isn’t just hope:
📊 Strong breadth under the surface
🏛️ Dovish policy pivot now expected in Q4
💸 Retail and institutional capital both re-engaging
📉 Bond yields are starting to roll over, supporting equity valuations
When bull markets enter their euphoria phase, they don’t stop at “reasonable” targets. They blast through them.
💡 The Setup Is Textbook — Now It’s About Execution
✅ Trendline defended
✅ RSI reset
✅ Sentiment shaken out
✅ Structure intact
The technicals just aligned with the macro. The low is in — and the runway to 8,700 is wide open.
Strap in. Q4 could be one for the history books.
USDJPY I Technical and Fundamental Analysis Welcome back! Let me know your thoughts in the comments!
** USDJPY Analysis - Listen to video!
We recommend that you keep this on your watchlist and enter when the entry criteria of your strategy is met.
Please support this idea with a LIKE and COMMENT if you find it useful and Click "Follow" on our profile if you'd like these trade ideas delivered straight to your email in the future.
Thanks for your continued support!

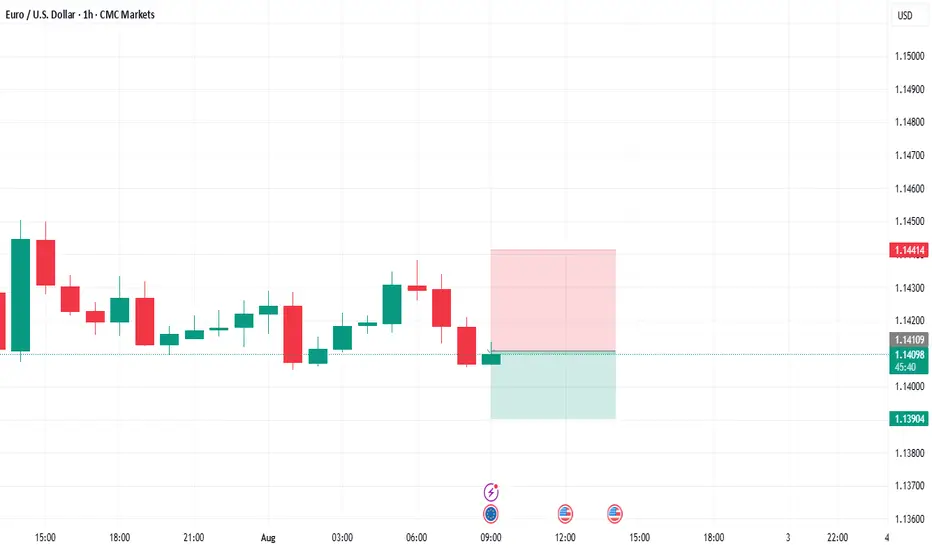
eurusd Short position sell 20 to 30 pips Eur usd short position sell 20 to 30 pips .
If you want to learn this analysis system free free contrect with me .
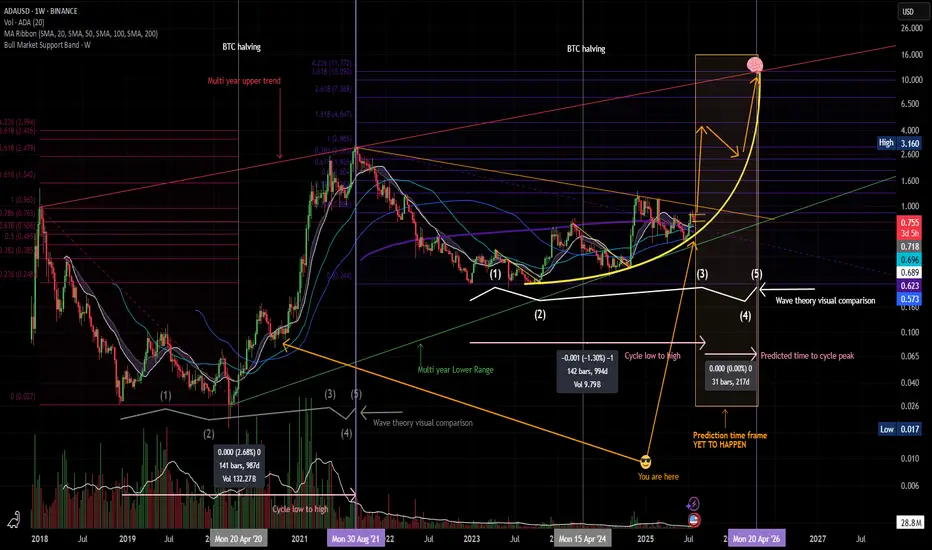
$ADA Macro ThesisGD To all
I have cleaned up and thrown a few other correlated patterns on the Chart for my Macro thesis.
You will have to watch the metrics and on chain data as well as sentiment to verify as we move fwd.
This is Pattern recognition on a Log Chart:
BINANCE:ADAUSD
I have been using this thesis since 2019 and have been able to successfully ident general buy/sell points ( weighing against real world events and on chain data )
I hope it helps you and feel free to ask questions.
Told ya I like crayons
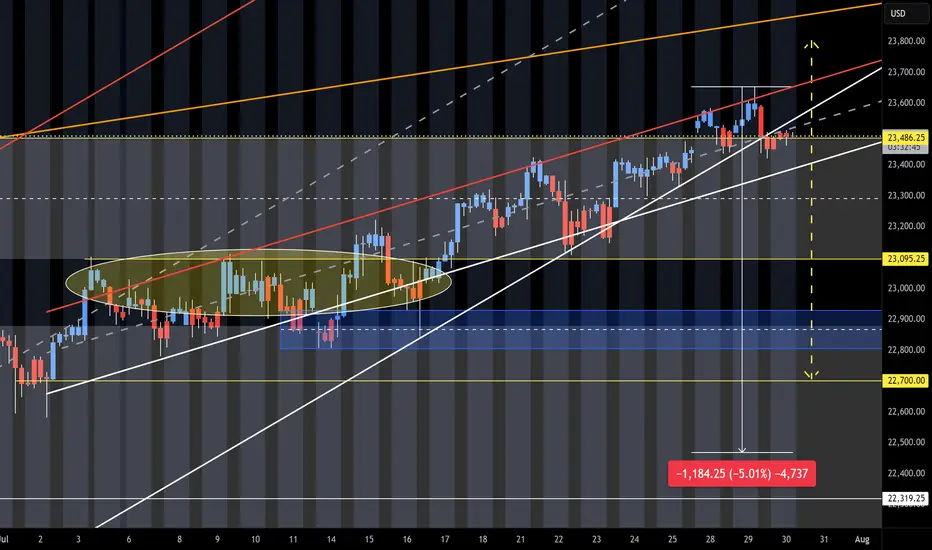
NQ Short (07-30-25)NAZ is at upper target and Turn Zone from May 12th post. Failure here should see a 5% drop test. The idea is that buyers will need some sellers in order to get higher. The sellers will help to test the level strength. Month end into a Friday-Monday Long play and a break in this long standing pattern may create the opposite. Current danger zone is the 23,486 KL. Look Long above and short below. Scalping Shorts should turn to holding shorts and scalping Longs. Expect timely Tweets and same old Tricks near or under the DZ. O/N is still The BOSS until both the O/N and Reg Session sell (on same day).
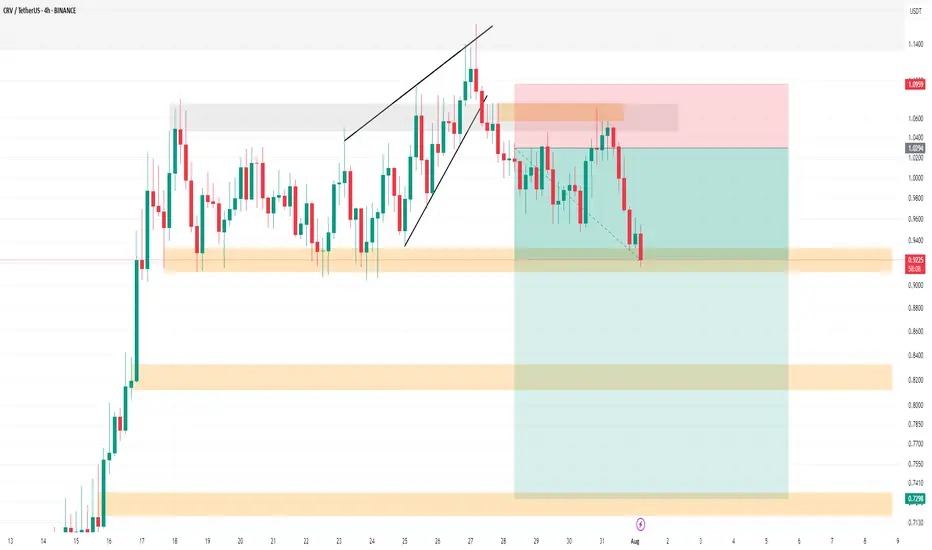
CRV SHORT Update Hello.
CRV Update
💁♂️ TP1 🔥
You can see this analysis in the analyses I posted before. It has now reached its first target. Please don't forget to like, share, and boost so that I can analyze it for you with more enthusiasm. Thank you. 💖😍
✅ TP1: 0.93$ Accessible (done)🔥
TP2: 0.82$ Possible
TP3: 0.73$ Possible
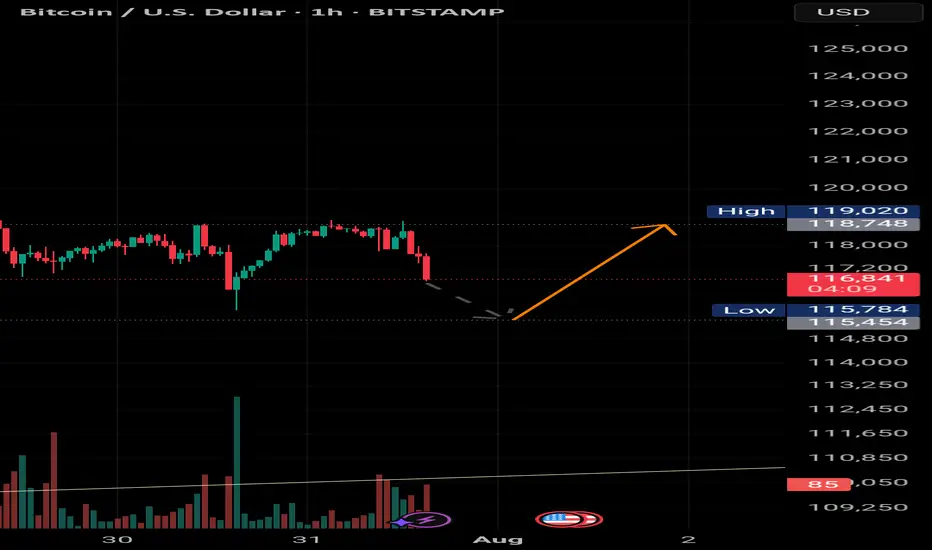
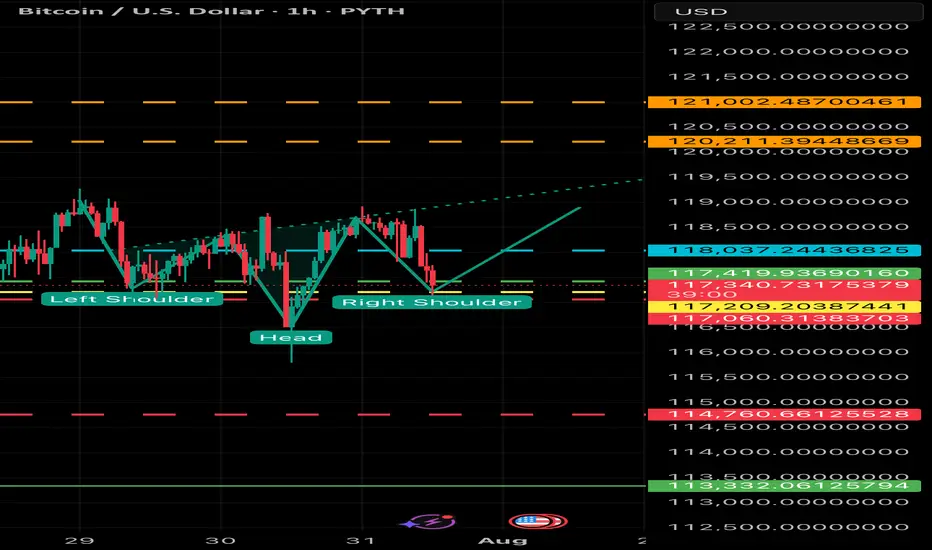
BULLISH BTC - Potential Inverted head and shoulders forming Potential breakout to $119 to $124,000 - Look for volume and support at $116 to $117,000. Breakout above $118,500 will confirm formation.
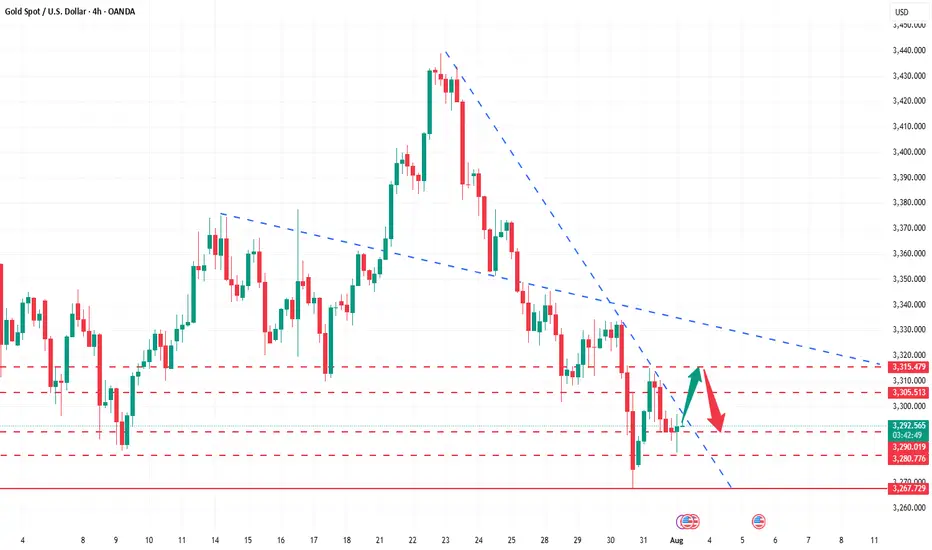
How to correctly grasp the gold trading opportunities?Yesterday, gold prices saw a technical rally amidst volatile trading, followed by a downward trend under pressure. Bulls strongly supported a rebound at 3280 in the Asian session. The European session saw an accelerated upward move, breaking through 3314 before retreating under pressure. We also precisely positioned short positions below 3315, achieving a perfect target of 3290-3295. During the US session, the market again faced pressure at 3311, weakening in a volatile trend before breaking through 3300. The daily chart ultimately closed with a medium-sized bullish candlestick pattern, followed by a pullback and then a decline.
Overall, after yesterday's rebound, gold prices remain under pressure at the key resistance level of 3314. The short-term bearish weakness line has moved down to this level. If pressure continues in this area in the short term, gold will maintain a weak and volatile structure, with intraday trading remaining focused on rebounds and upward moves. If you are currently experiencing confusion or unsatisfactory trading strategies, please feel free to discuss your options and help avoid investment pitfalls.
From a 4-hour analysis perspective, focus on resistance at 3305-3315 on the upside. A rebound to this level is a good opportunity to short against resistance. Focus on support at 3280-3270 on the downside. Unless the price stabilizes strongly, consider not entering long positions below this level. The overall strategy remains to short on rebounds, with the same rhythm. I will provide timely notifications of specific levels from the bottom, so keep an eye on them.
Gold Trading Strategy: Short on rebounds near 3305-3315, with targets at 3290-3280-3270.
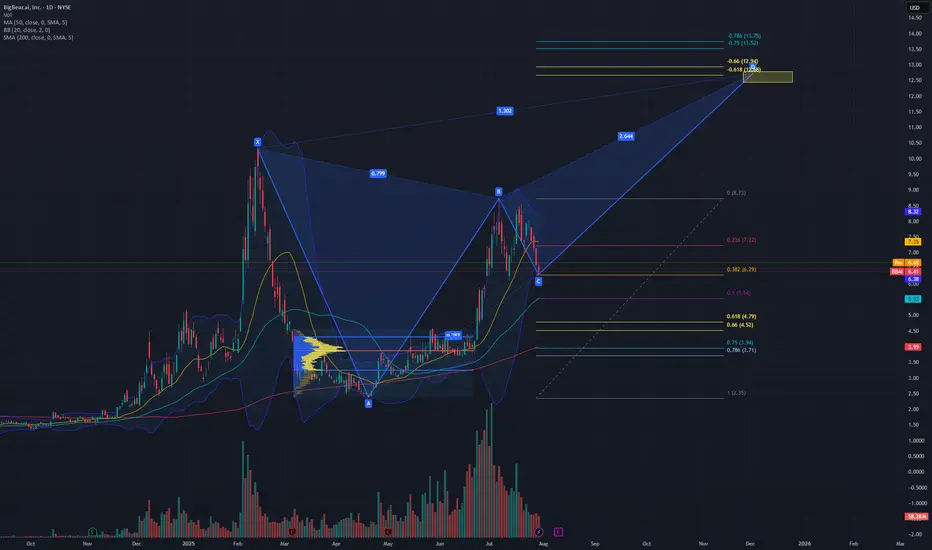
XABCD pattern playing out $12 targetBBAI is looking like it will play out the XABCD butterfly pattern if it continues to rally from the .382 of the pull back from previous $2.35 lows and 8.73 highs.
Breaking down and close below the $6.06 daily candle will potentially expose the previous consolidation POC at $3.87, which is a .75 pull back.
Using Fib time, I am expecting a $12 range around this year in December.
Will look to open a 7/12 bull call spread at Jan 2027 exp.
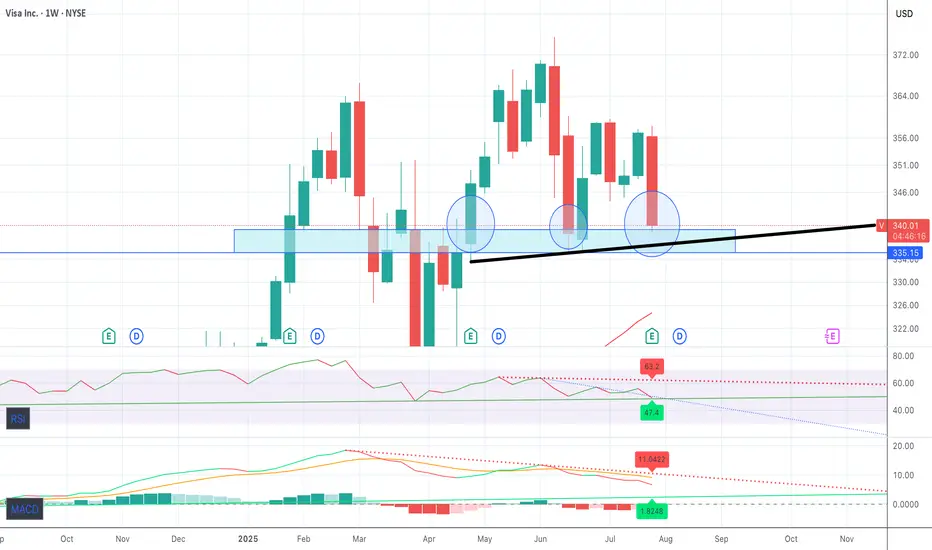
Visa UpsideWe're approaching what I believe is max pain at $435 after impressive earnings from Visa. I think the upside is very much on here
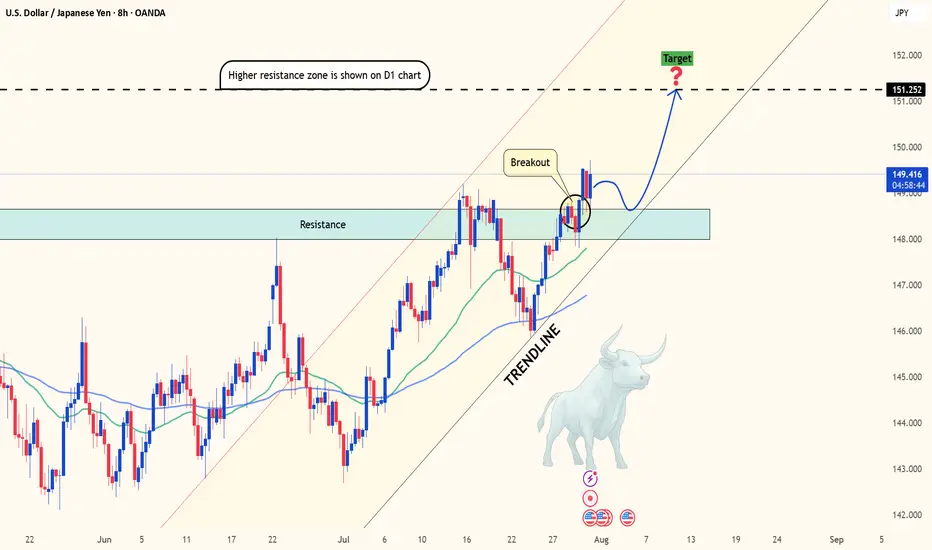
USDJPY breaks out as US data crushes forecastsHello traders! Do you think USDJPY will continue its upward momentum?
From a technical perspective, after several sessions of "building pressure," this pair has finally broken through a key resistance zone—opening the door to what could be the next bullish breakout.
Current price action suggests the uptrend remains firmly intact. The market continues to respect the rising trendline and finds strong support near the 34 & 89 EMA – a powerful technical combination that buyers often rely on. This isn’t just a typical breakout; it could be the start of a brand-new bullish cycle.
On the fundamental side, the U.S. dollar remains strong, supported by a string of solid economic data: employment, PCE, and consumer spending have all exceeded expectations. Meanwhile, the Japanese yen remains in “hibernation” as the Bank of Japan shows no sign of shifting away from its ultra-loose monetary policy. This divergence makes USDJPY one of the hottest pairs on the radar right now.
What’s next? If bullish momentum continues, the 151.25 level is likely the next short-term target. However, if the price encounters strong resistance at that level, a minor pullback could occur before the uptrend resumes.
So, what do you think? Is this the beginning of a major rally – or just a false breakout? Share your thoughts in the comments!
Wishing you successful and well-timed trades ahead!
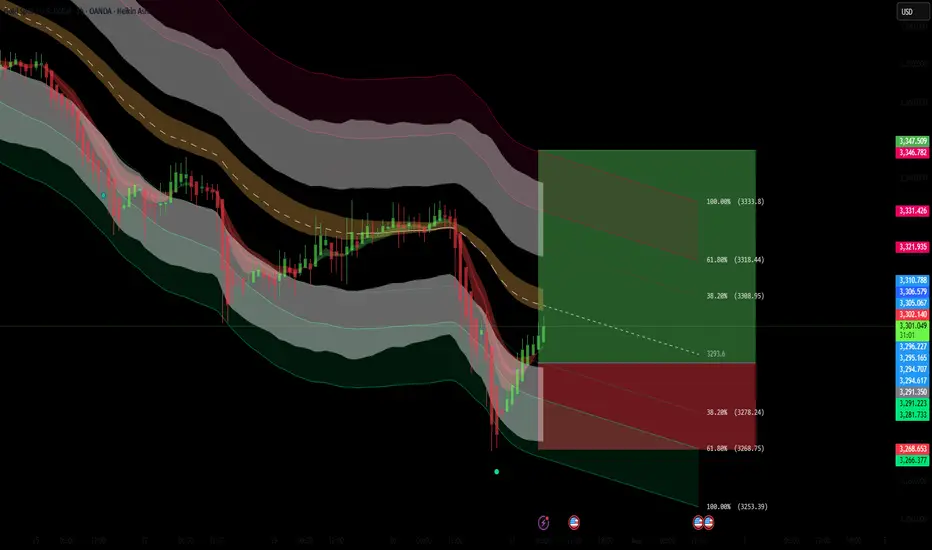
XAUUSD Long Setup – 1HGold (XAUUSD) has shown strong bullish rejection from the lower volatility band after a sharp selloff. The appearance of a Heikin Ashi reversal candle, suggests a short-term reversal is forming. Price has reclaimed key structure and is now targeting a reversion back to the mean, supported by Fibonacci retracement levels.
Entry: 3293.55
Target Zone: 3308.91 → 3333.76 (Fib 38.2% – 100%)
Stop Loss: 3253.35
Confluences:
✅ Bullish engulfing + Heikin Ashi trend shift
✅ Oversold bounce from lower channel extremity
✅ Fib retracement aligns with key structural resistance zones
✅ Custom signal confirmation (green dot)
✅ Clean R:R toward upper band and previous POI
Short-term counter-trend long targeting liquidity grab and mean reversion toward the 3308–3333 zone. Risk tightly managed with SL below local swing low.
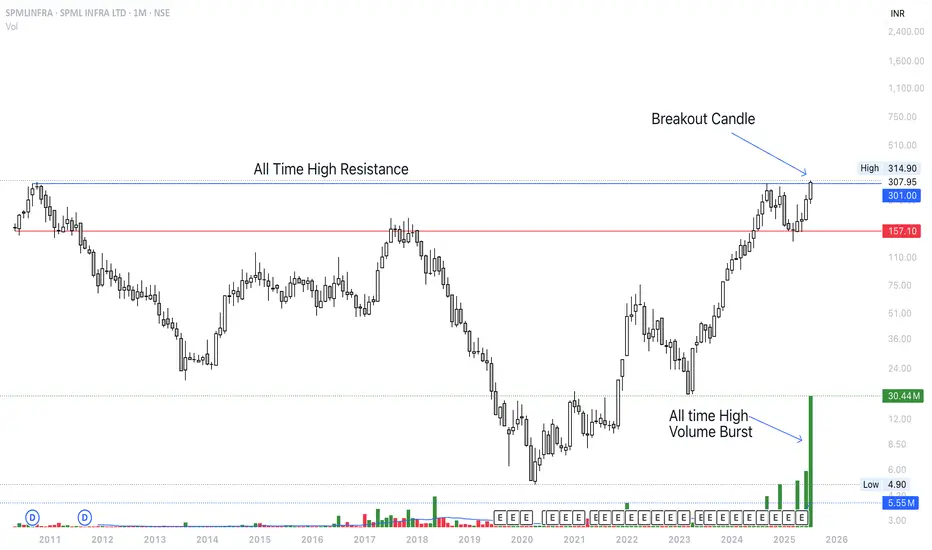
Breakout Soon <> SPMLINFRAStock is pushing above All time High resistance level. Keeping on radar. It would have been solid breakout if the Monthly closing was above 310 level. Volume also supporting the level. Recently realty sector rally also supporting.
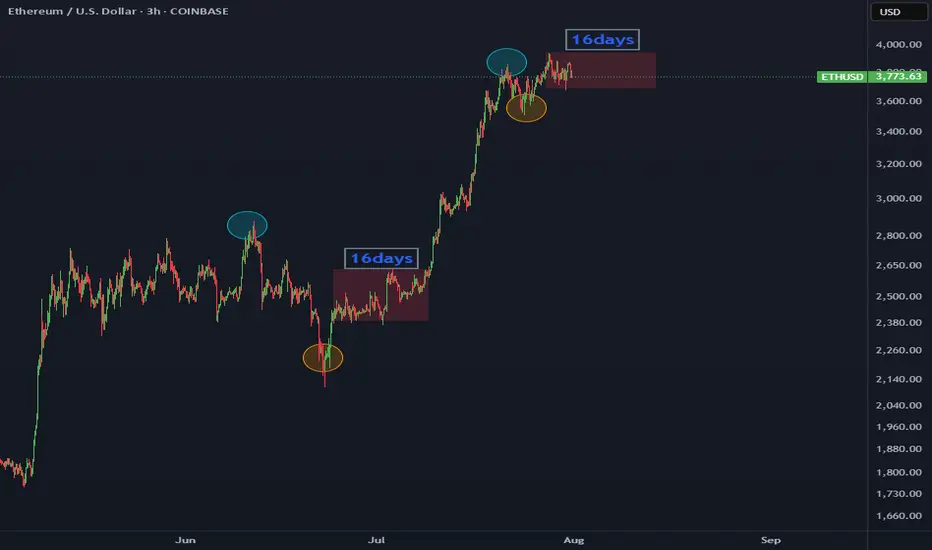
ETH will hit a new ATH in 16 days.ETH to reach new ATH in 16 days based on trend momentum and historical breakout patterns. Watching key resistance levels closely. High volume and bullish sentiment support the move.
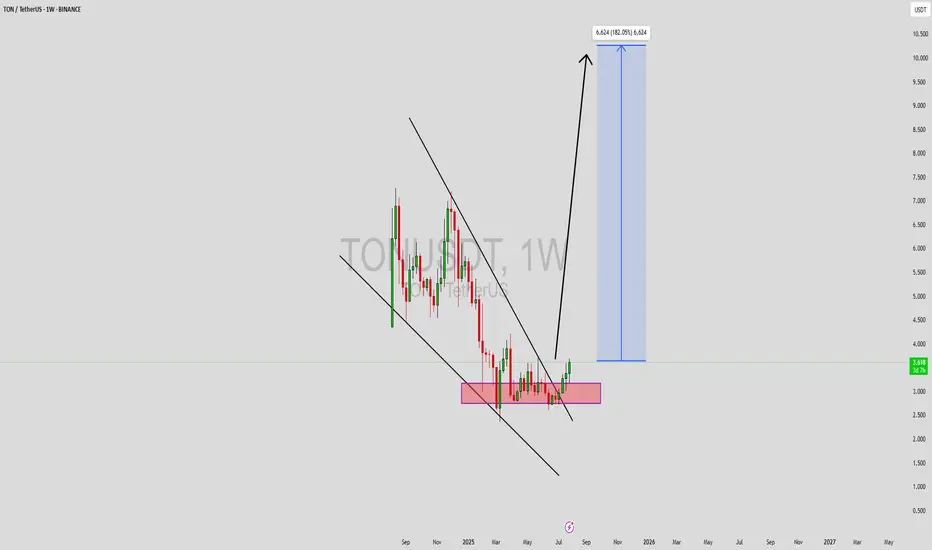
TONUSDT Forming Falling WedgeTONUSDT is forming a classic falling wedge pattern, which is widely recognized in technical analysis as a bullish reversal signal. After a period of consistent downward price compression, the narrowing structure on the chart signals that selling pressure may be weakening. This setup often precedes a significant bullish breakout, especially when accompanied by growing interest and steady volume—as is currently being seen in TON’s market behavior.
The fundamentals behind TON (The Open Network) are also strengthening, with increasing adoption across the Web3 ecosystem and a growing number of partnerships tied to Telegram's user base. The synergy between Telegram and the TON blockchain has created an environment where real-world utility is beginning to align with on-chain momentum. This alignment often catalyzes strong upward price moves, making TONUSDT one of the more promising altcoin setups in the current market landscape.
The expected gain of 140% to 150% from current levels is not just speculative—it aligns well with the technical breakout projection based on the wedge’s height and the last key swing high. If TON can maintain support above the lower boundary of the wedge while volume continues to increase, the likelihood of a breakout followed by a strong upward rally becomes much higher. Historical breakout moves from similar wedge patterns often show explosive growth in relatively short timeframes.
TONUSDT is a high-potential chart right now and should be closely monitored by traders and investors looking for large-cap altcoin opportunities with bullish technical setups. This could be the start of a major trend shift for TON, especially as broader crypto sentiment begins to tilt bullish again.
✅ Show your support by hitting the like button and
✅ Leaving a comment below! (What is You opinion about this Coin)
Your feedback and engagement keep me inspired to share more insightful market analysis with you!
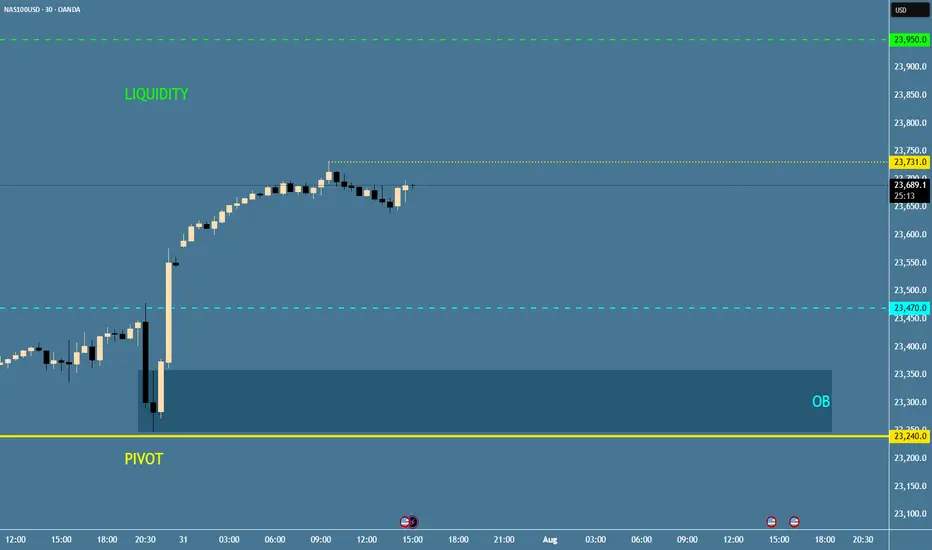
NAS100 - Update Dear Friends in Trading,
How I see it,
I will be waiting for a clear and decisive break below the PIVOT.
Keynote:
I am not trading NASDAQ at all...just monitoring patiently!!
I will keep you in the loop as the stock market progress...
I sincerely hope my point of view offers a valued insight
Thank you for taking the time study my analysis.
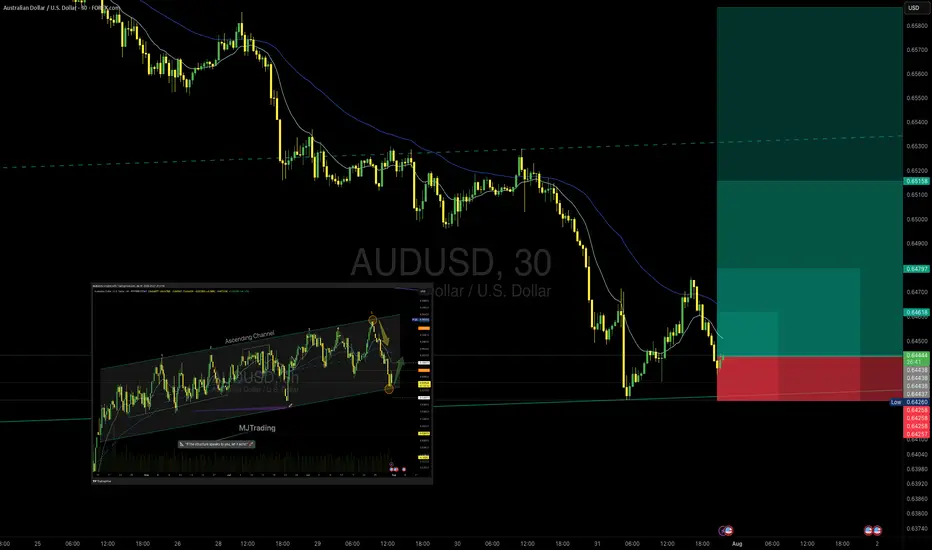
AUD/USD – Potential Bounce Buy SetupOANDA:AUDUSD
Timeframe: 30m
Type: Counter-trend / Bounce from Support
Risk Level: Medium to High
Possible Reward: 4+
🔹 Setup:
Price is testing the lower boundary of the recent support zone (0.6432 – 0.6420), aligning with the previous channel structure visible on the 8h chart. The descending move has shown initial signs of exhaustion, suggesting a potential bounce.
📈 Entry:
Current price zone 0.6432 – 0.6445
🎯 Targets (TP):
TP1: 0.64624
TP2: 0.64797
TP4: 0.65158
⛔ Stop Loss (SL):
0.64250 (below recent swing low and liquidity pool)
8H chart Overview:
Previous Position from top of Channel:
#AUDUSD #Forex #SmartMoney #PriceAction #MJTrading #ChartDesigner
Psychology Always Matters:
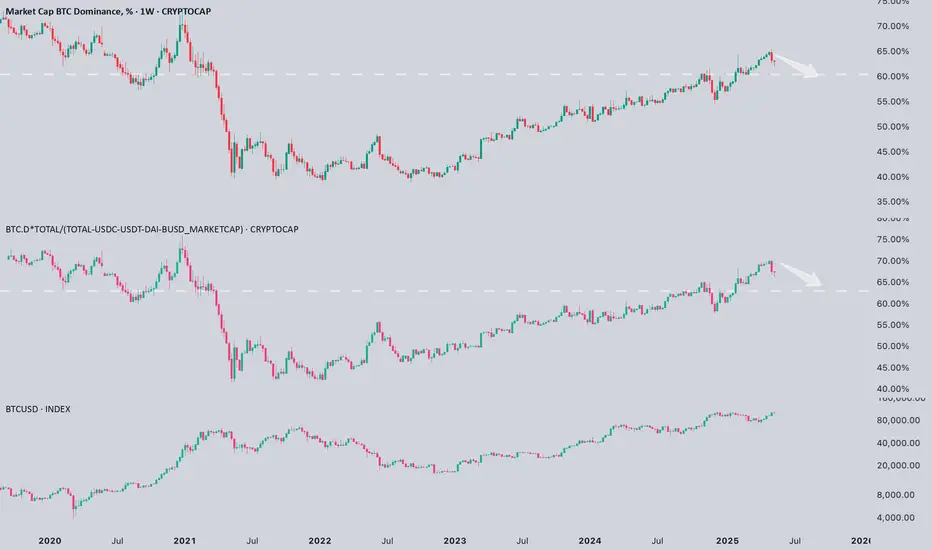
Is Bitcoin dominance finally starting to crack?Is #Bitcoin dominance finally starting to crack?
I think we’re getting the first real signal.
📉 After a strong run, BTC CRYPTOCAP:BTC dominance has rejected from major resistance and started to pull back. Even when adjusted for stablecoins, we’re seeing the same early signs of weakness.
📝 Historically, this kind of shift has been a precursor to capital rotation into altcoins. We might still be far from full-blown altcoin euphoria, but this could be the beginning of a transition from a BTC-led market to a broader risk-on phase, especially when the market starts pricing in a rate cut.
💡 Keep in mind: the biggest alt runs tend to come when BTC consolidates near highs while dominance fades. If this move confirms, it might be time to prepare.