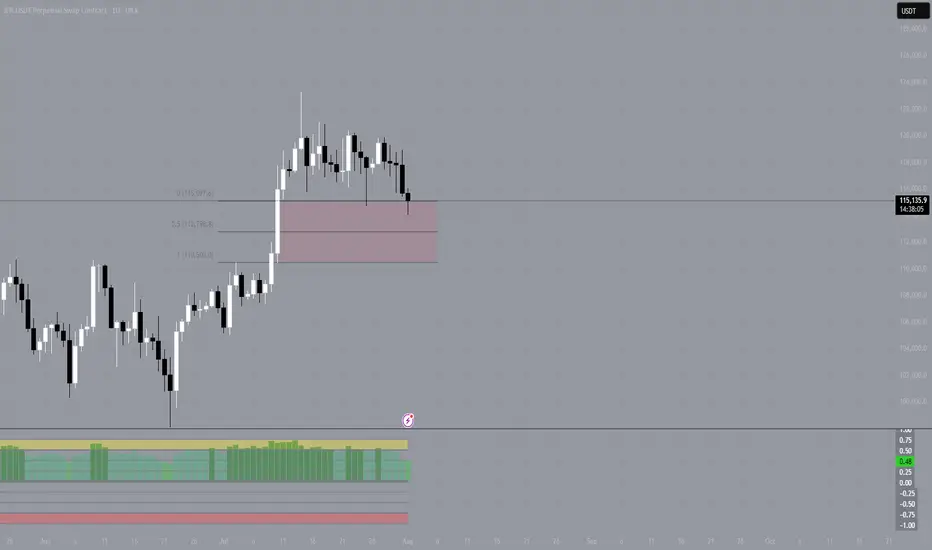
PUMP | Watching for Base ConfirmationThe sharp downtrend is showing signs of exhaustion as price starts to consolidate and build a potential range.
If we see a sweep and reclaim of the range low, that would confirm the start of a new accumulation phase and signal a potential reversal.
The invalidation for any long attempt is a confirmed breakdown below the deviation or the origin of the reclaim.
Plan:
Wait for a clean sweep and reclaim of the range low to trigger a long entry.
Target resistance levels above, with stops set below the reclaim origin.
Trend Analysis
BTC in a Sideways MovementBTC in a Sideways Movement: When the Market Froze, Psychology Starts to Fail
Honestly, this is one of the most difficult stages in the market - uncertainty without a clear direction. Bitcoin gets stuck between levels, giving false breakouts and immediately rolling back. It seems that something serious is about to happen, but in reality, nothing happens.
This kind of price movement often leads to emotional burnout of traders. Some start entering trades blindly, just to stay in the market. Others suffer a series of small losses, trying to guess the breakout. And some just close the charts, unable to cope with the silence.
The reality is that markets get tired too, especially after big moves. What we are seeing now with BTC is probably just a rebalancing phase. And that's okay. If there is no clear pattern, then this is not your trade.
For now, I am just watching, marking the boundaries of the range and waiting. For myself, I highlight the order block for 1D as zones of interest, I wait for a reaction from it and will look for a model to enter a position.
Any breakthrough, confirmed by volume and subsequent movement - that's when the next real movement will begin.
The main thing is not to waste energy in vain. Sideways movement is not eternal. After silence, movement always comes.
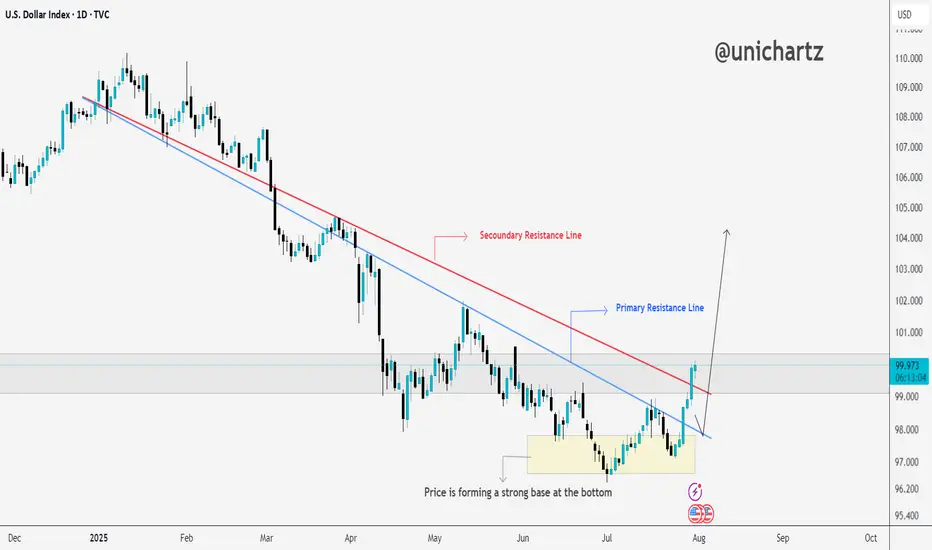
DXY Just Broke Resistance – Is This the Start of a Dollar Rally?As per our analysis, DXY has successfully broken above the primary and secondary resistance line.
If the price manages to close above the marked resistance zone, we could see further upside momentum ahead.
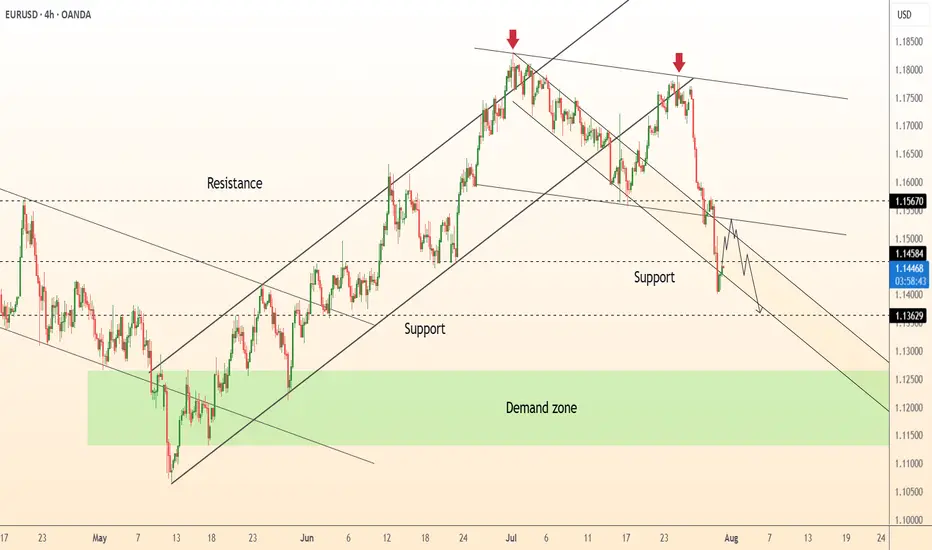
DeGRAM | EURUSD dropped below the support level📊 Technical Analysis
● EURUSD confirmed a double rejection below long-term resistance with two lower highs and broke channel support at 1.1567.
● Price is now trending within a descending channel toward 1.1363, with lower targets pointing into the 1.12–1.11 demand zone.
💡 Fundamental Analysis
● US Q2 GDP surprised to the upside, reinforcing the Fed’s hawkish tone, while Eurozone CPI inflation cooled below forecast.
● Diverging central bank trajectories continue to widen yield differentials in favor of the dollar, sustaining bearish euro flows.
✨ Summary
Short bias confirmed below 1.1567. Break of 1.1450 opens path to 1.1363 ➜ 1.1200 zone. Watch for rallies to fade below trendline.
-------------------
Share your opinion in the comments and support the idea with a like. Thanks for your support!
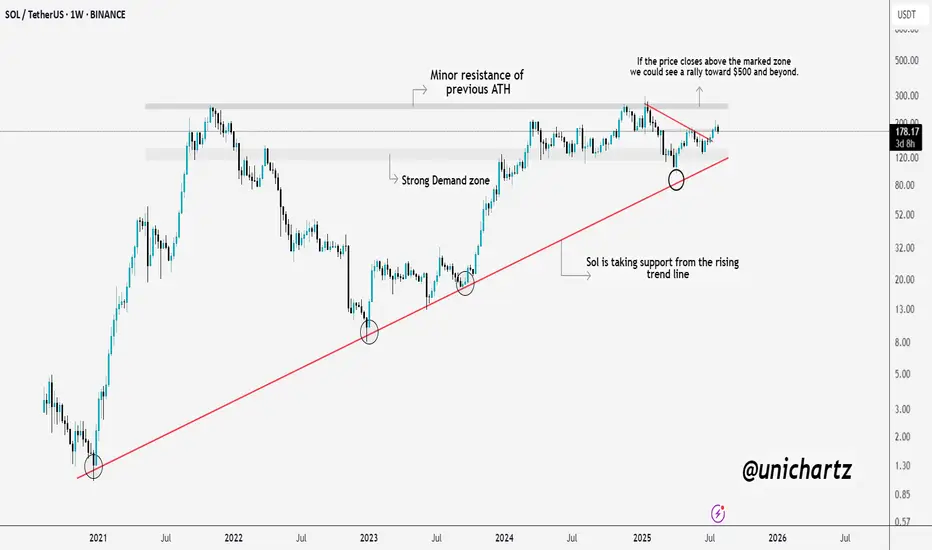
Massive Move Loading? $SOL Prepping for a BreakoutSolana is showing real strength here.
CRYPTOCAP:SOL consistently taking support from the long-term rising trendline, a sign that buyers are defending key levels. We're also approaching a critical resistance zone, which was the previous ATH area.
If SOL manages to close above this zone, we could witness a strong rally towards $500 and beyond. Until then, it’s a crucial level to watch, a breakout here could set the stage for the next leg up.
DYOR, NFA
MAGICUSDT 1D#MAGIC is moving inside a symmetrical triangle — it's decision time: breakout or breakdown?
If it manages to break above the triangle resistance and the daily SMA200, the potential upside targets are:
🎯 $0.2214
🎯 $0.3187
🎯 $0.3973
🎯 $0.4759
However, in case of a breakdown and a daily candle close below the triangle, it may retest the support level at $0.1149.
⚠️ As always, use a tight stop-loss and apply proper risk management.

NFP Friday - XAUUSD Prediction - August 2025#NFP Friday + New Month 👇
- Still leaning bearish on TVC:GOLD
- New month = re-positioning flows
- Watching 3225–3250 zone (Fib 38/50 confluence)
- Clean pullback setup near Psy level & untested orders
News Prediction:
- Labor market still holding up, I’m thinking NFP prints closer to 130k–150k, not that 110k estimate
- Yes, tech & retail saw some layoffs, but not enough to tank the whole report
- Adapt if wrong, execute if right. No stress
#XAUUSD #Gold #NFP #Dollar #NFPFriday #XAUUSD #Gold #NFP #JobsReport #Dollar #Macro #Trading #MarketOutlook #NFPFriday

$BTC Is Bullish: Bull Flag + Liquidity sweep + RSI DivI see higher targets for bitcoin. right now Bitcoin is forming a bullish flag, two times it has targeted short stops, and on the 4H timeframe we also have an RSI divergence.
Btc Short positing Strong sell 40 to 50 pips Btc Short positing Strong sell 40 to 50 pips .
If you wanted to learn about more fell free contrect me .
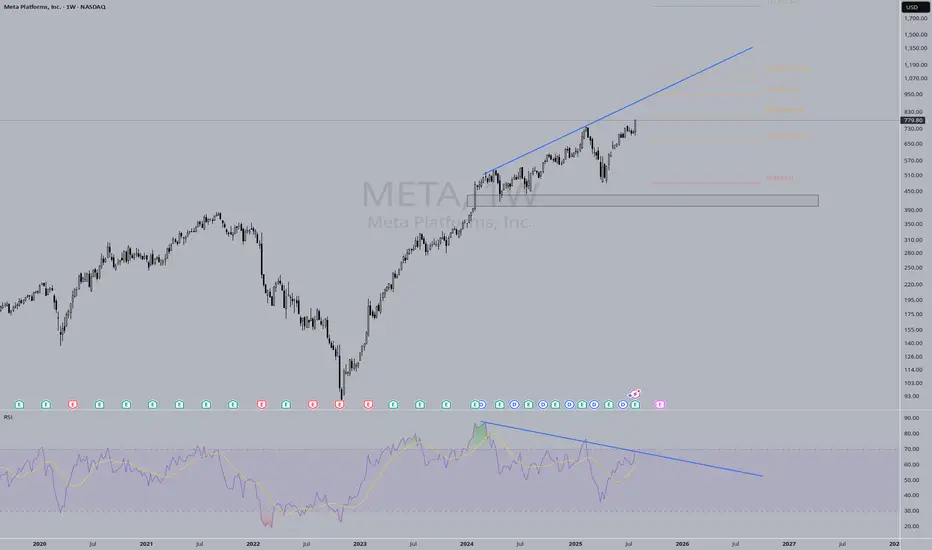
META Bearish RSI Divergence?RSI bearish divergence occurs when price makes a higher high, but the Relative Strength Index (RSI) forms a lower high. This mismatch signals weakening bullish momentum and hints at a potential trend reversal to the downside
How to seize the key turning points in the gold market?The market is ever-changing, and following the trend is the best strategy. When the trend emerges, jump in; don't buy against it, or you'll suffer. Remember not to act on impulse when trading. The market is a haven for all kinds of resistance, so don't hold onto positions. I'm sure many people have experienced this: the more you hold onto positions, the more panic you become, leading to ever-increasing losses, poor sleep, and missed opportunities. If you share these concerns, why not try following Tian Haoyang's lead and see if it can open your eyes? I'm always here for you if you need help, but how can I help you if you don't even offer a hand?
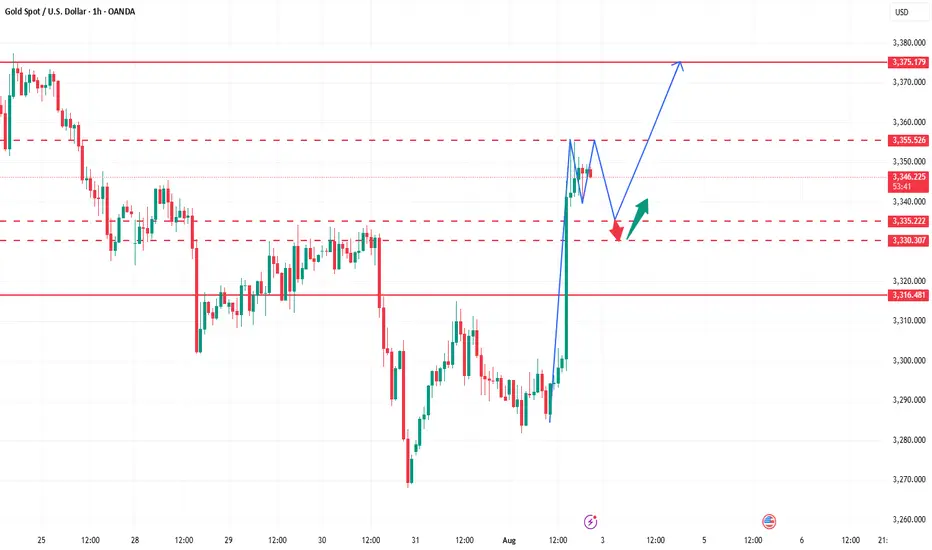
Gold did not fall below 3280 during the day on Friday and started to fluctuate in the range of 3280-3300. The non-farm payroll data was bullish, and it directly broke through the pressure of 3315, and then broke through the important pressure of 3335 again. As of now, it has reached a high near 3355. The non-farm payroll data market has almost been exhausted. Next, we will focus on the technical form adjustment. At present, you can consider light shorting in the area near 3355-3370. After all, chasing long is risky, and the technical side needs to be adjusted. If your current operation is not ideal, I hope I can help you avoid detours in your investment. Welcome to communicate with me.
Based on the 4-hour chart, short-term resistance is near 3355-3365, with a focus on the key resistance level of 3370-3375. Short-term buy orders should be taken if a rebound continues. I'll provide detailed trading strategies at the bottom of the page, so stay tuned.
Gold operation strategy: Short gold in batches when gold rebounds to 3355-3370, with the target being the area around 3340-3335. Continue to hold if it breaks through.
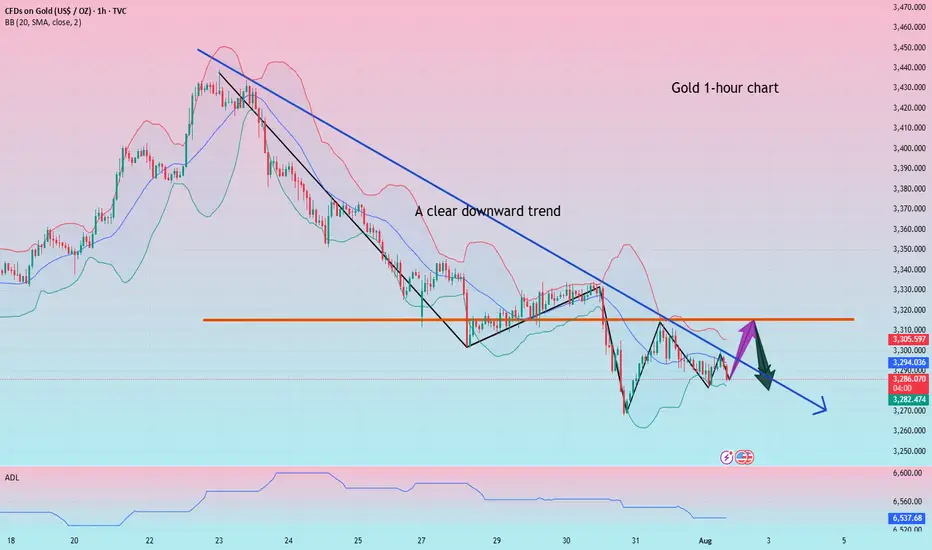
Gold rebound is weak, short below 3315
Gold remains weak, with multiple intraday rebounds failing to maintain momentum. The upper moving average continues to suppress the market, and the short-term market remains dominated by bears. Today, we are following the trend and taking a bearish stance. The key upside level is around 3315. If it reaches this level before the US market opens or if it peaks in the short term, we will short sell. The non-farm payroll data will be released today, and we will consider reversing our direction based on the situation after the data.
Gold prices have once again encountered resistance to their upward trend, and the volatile pattern continues. The gold price trend is trending lower highs, and today's low is expected to be lower than yesterday's. Therefore, our intraday short target could be 3268 or even lower, so it's crucial to seize the right entry point.
If you're new to the market, come to me. I'll teach you how to trade while you learn. If you're already in the market and struggling, come to me. I'll help you avoid repeating the same mistakes. If you've already experienced this market and are battered, come to me. I'm confident I can help you regain confidence. If you're stuck in a position, I'll develop a strategy tailored to your entry point. Because everyone's trapped positions are different, the solutions will vary, some suitable for conservative traders and others for aggressive ones. However, I can't offer a perfect answer to every situation. I suggest you bring your order with you. Once you contact me, I'll use the most appropriate method to resolve your situation and help you exit the market.
Specific Strategy
Short gold at 3315, stop loss at 3325, target at 3280
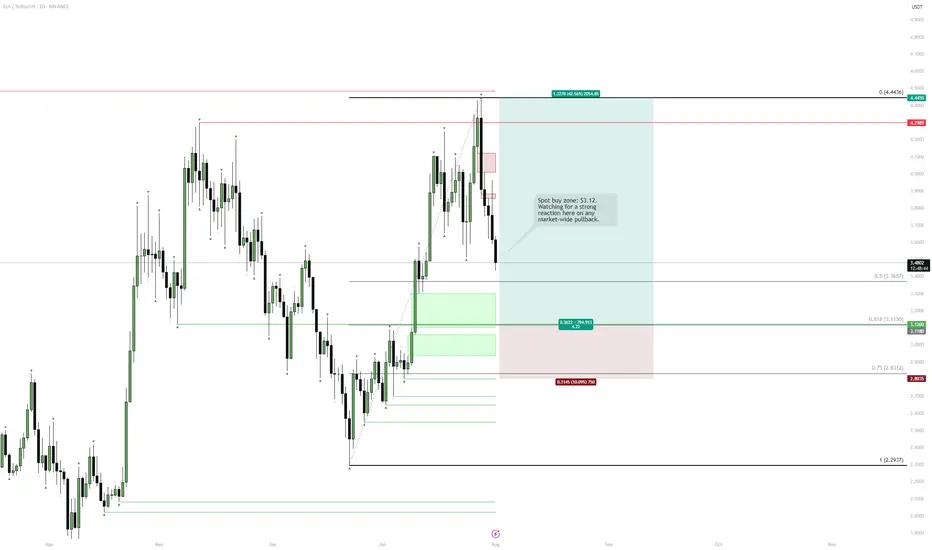
SUI | Spot Buy Zone for PullbackPrice has pulled back after a local top and is heading toward a clear demand zone.
Key buy area sits around $3.12, aligned with 0.618 retracement and recent consolidation.
Strong structure below—if majors keep retracing, this is where risk/reward for new spot buys becomes attractive.
Plan:
Waiting for price to reach the green zone to accumulate spot.
Invalidation below $2.80, targeting a move back toward $4.45 and higher if momentum returns.
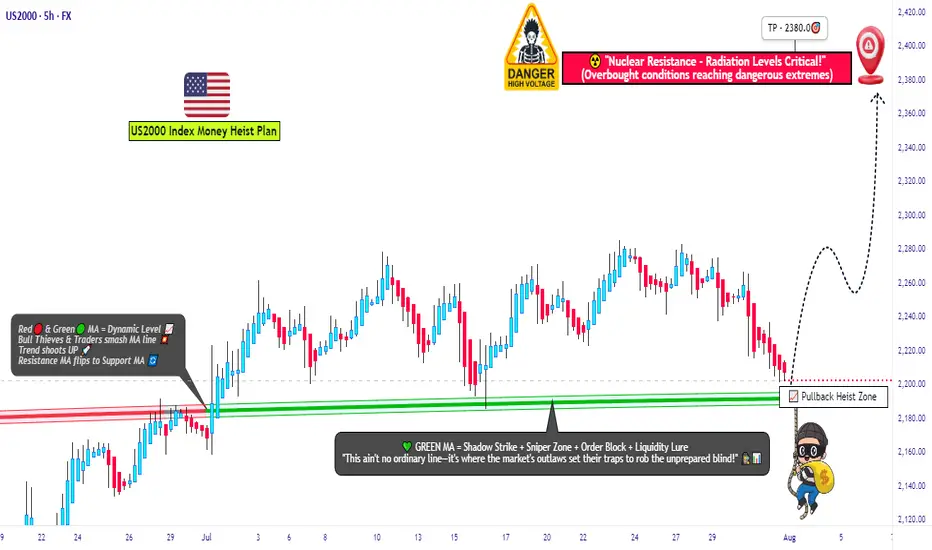
"US2000 THIEF TRADE: SWIPE & ESCAPE BEFORE BEARS!"🚨Russell 2000 Robbery: Pullback to Power Play⚡️💰
🌟Hi! Hola! Ola! Bonjour! Hallo! Marhaba!🌟
Dear Market Robbers & Money Makers, 🤑💰💸✈️
This is a full-blown heist plan on the US2000 (Russell 2000) index using the Thief Trading Style™, a perfect combo of real-time technicals + macro heat.
Get ready to swipe the bull run right after a tactical pullback — let’s rob the market clean and vanish at the high-voltage resistance level ⚡️🚨📊
📈 Entry Plan – The Vault Opens @ 2190.00
Watch for a clean pullback to the zone around 2190.00.
Place buy limit orders after confirmation from 15m or 30m candles – preferably near recent swing lows.
Smart move: Set alerts so you don’t miss the breakout trigger.
🛑 Stop Loss – Escape Hatch @ 2140.00
Use the nearest 4H candle wick or swing low as your SL level.
Thieves scale their lot size & SL based on position stacking and trade confidence.
🎯 Target – 2380.00 (Or Jump Before the Heat Gets Real)
Take profit near the heavy resistance zone. Don’t overstay — market traps ahead! Electric reversals & institutional bears wait there to flip the game ⚡🐻
👀 Scalpers’ Secret:
Only long scalps! 💣
No funds? Follow the swing robbers.
Trail your SL and let the bulls push your bags up.
🧠 What’s Fueling This Bullish Ride?
US2000 is surging with:
• Risk appetite from macro sentiment
• COT data aligning bullish
• Intermarket signals syncing up
• Rotational flows into small-cap strength
⚠️ Thief Trading Alerts – News Impact Zone Incoming!
• Don’t enter fresh trades during red news.
• Use trailing SLs to guard floating profits.
Market spikes are good — if you’re prepared.
💣💥This isn’t just a trade – it’s a mission.
Rob smart, trail hard, and cash out sharp.
📦💼Every move is calculated. Every entry is a chance.
🚀Stay sharp, robbers – next heist plan drops soon! 💼🔐📈
🏆Trade like a thief, win like a boss.
XAUUSD
XAUUSD Updated in 15M :
The gold signal is marked on the chart based on the latest price changes and the supply and demand in the market. These points include the entry point, stop loss, and take profit
XAUUSD – Downtrend Confirmed, Bears in ControlOn the H4 timeframe, gold has completely broken its short-term uptrend structure and formed a series of lower highs and lower lows. Every bounce is rejected at the strong resistance zone of 3,326 – 3,333 USD, confirming the clear downtrend.
Although the recently released Core PCE index was lower than expected, this is not enough to drive a recovery as other data, such as the Employment Cost Index and statements from the Fed, still show persistent inflationary pressure. Therefore, the monetary policy remains hawkish, causing money to flow out of gold.
Currently, the price is approaching the critical support zone of 3,247. If this level is broken, the scenario of further declines to 3,192 is entirely possible.

BTC : The future of Bitcoin...Hello friends🙌
👀According to the price history, the price has always been bullish and is in a long-term bullish channel.
📈Now that the price is struggling in the middle of the channel and is gathering strength for a big move, which is expected to break the middle of the channel in the form of a resistance or middle channel, the price will move to the ceiling of the channel.
⚠Don't forget risk and capital management.
🔥Follow us for more signals🔥
*Trade safely with us*
ETH Reposition Play – VolanX DSS Sentiment Filter Active📉 ETH Reposition Play – VolanX DSS Sentiment Filter Active
🧠 VolanX DSS Triggered a Long Watchlist Signal
The ETH/USDT daily chart shows price stalling near the 0.786 Fib zone after a strong rally. Our proprietary DSS (Decision Support System) now monitors sentiment misalignment to prepare for the next institutional push.
🔍 Key DSS Observations:
Retail Sentiment: Fearful — retail bias flipped to short.
News Headlines: Negative — VADER sentiment ≈ –0.45.
Funding Rates: Flipped to negative across major exchanges.
Fear & Greed Index: 28 (deep fear zone).
📊 All 4 signals confirm contrarian long opportunity in “Reposition Zone” (≈ 3566–3280). Smart Money often absorbs panic exits before triggering the next leg.
🎯 DSS Strategy:
✅ Wait for confirmation at 3,280 or wick flush to 3,061.
📈 Potential upside target = 5,033 (1.618 Fib extension)
🛡️ DSS Sentiment Filter = ✔ Passed (4/4 bearish crowd indicators)
“When the crowd panics, liquidity positions. VolanX knows this.” – WaverVanir Protocol
📡 Signal monitored via VolanX Alpha Engine
🔒 Institutional tracking | AI-guided logic | DSS Probability Matrix
#ETH #Ethereum #Crypto #WaverVanir #VolanX #SmartMoney #SentimentTrading #AlphaProtocol #DSS #Reposition
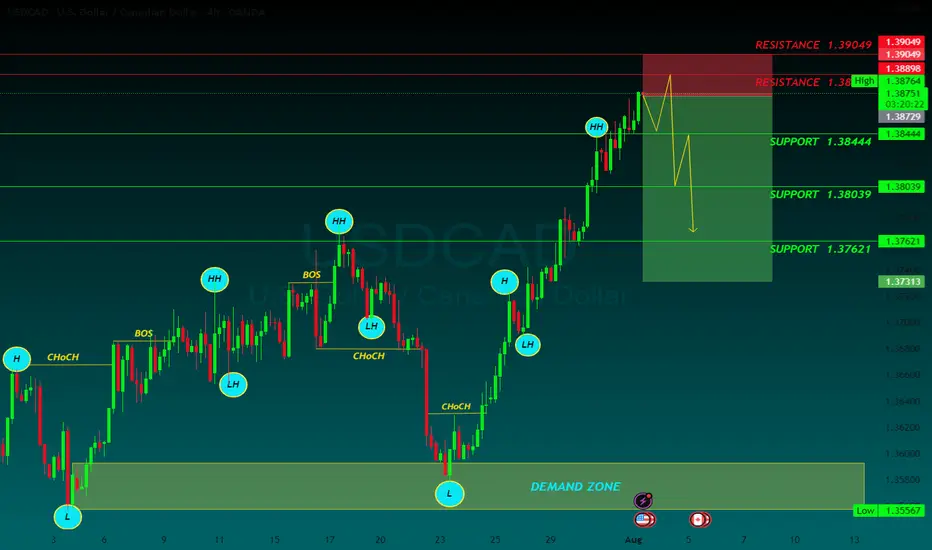
USDCAD SELLUSD/CAD rallies further, approaches 1.3900 on higher levies to Canada
The US Dollar keeps marching higher, as the Canadian Dollar struggles after Trump decided to increase tariffs to Canada to 35% from the previous 25%, escalating the trading tension with one of its main trading partners. The US President justified his decision on Canada’s alleged reluctance to cooperate on curbing the traffic of fentanyl and other drugs across the US border
The year will be politically marked by Trump’s return to the White House. A Republican government is seen as positive for financial markets, but Trump’s pledge to cut taxes and impose tariffs on foreign goods and services may introduce uncertainty to both the political and economic landscape.
Canada’s political crisis peaked in late 2024 with a no-confidence vote against Prime Minister Justin Trudeau, leading to snap elections and a weakened Liberal minority government. Policy uncertainty and economic challenges dominate 2025’s outlook, raising concerns over market stability and investor confidence.
The BoC is set to continue easing interest rates through 2025, at least at a faster pace than the Fed is expected to, which could apply pressure on CAD’s already-rising rate differential.
SUPPORT 1.38444
SUPPORT 1.38039
SUPPORT 1.37621
RESISTANCE 1.38889
RESISTANCE 1.39049
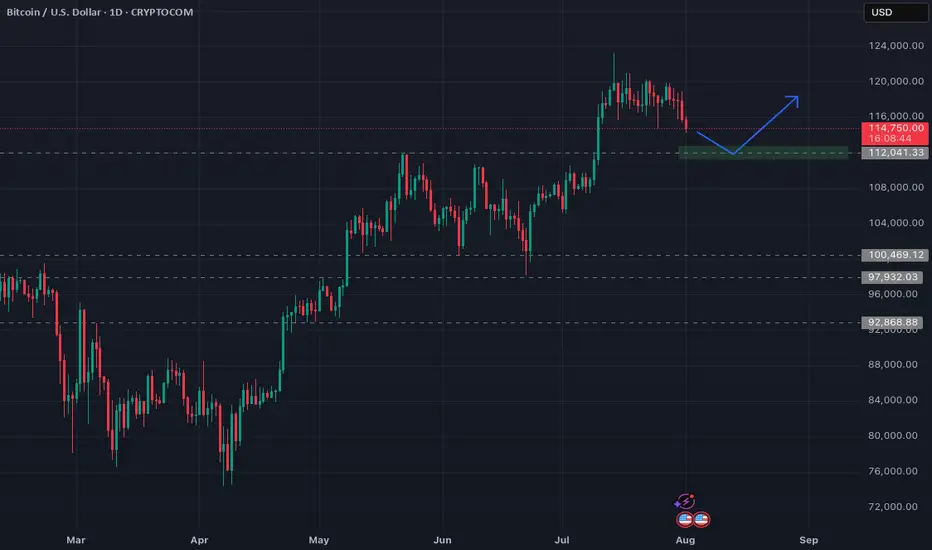
Bitcoin FOMC aftermath & plan aheadHi all,
As you may have noticed, Wednesday's FOMC meeting delivered a less-than-optimistic outlook. The absence of rate cuts, combined with uncertainty about potential cuts in September, triggered a downward move in the markets.
Bitcoin is currently trading 7% below its high from July 14th. I anticipate a relatively shallow downtrend and plan to add to my position around $112,000.
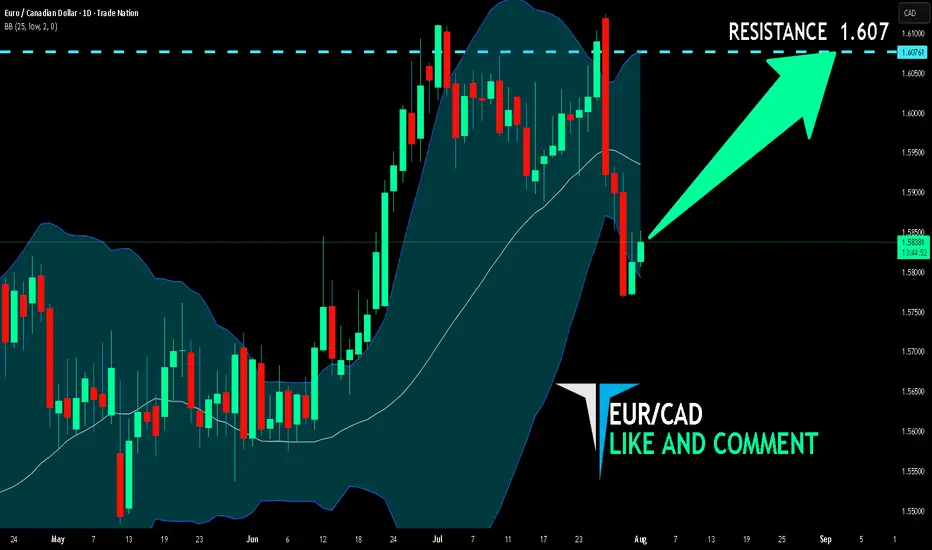
EUR/CAD BUYERS WILL DOMINATE THE MARKET|LONG
Hello, Friends!
We are going long on the EUR/CAD with the target of 1.607 level, because the pair is oversold and will soon hit the support line below. We deduced the oversold condition from the price being near to the lower BB band. However, we should use low risk here because the 1W TF is red and gives us a counter-signal.
Disclosure: I am part of Trade Nation's Influencer program and receive a monthly fee for using their TradingView charts in my analysis.
✅LIKE AND COMMENT MY IDEAS✅
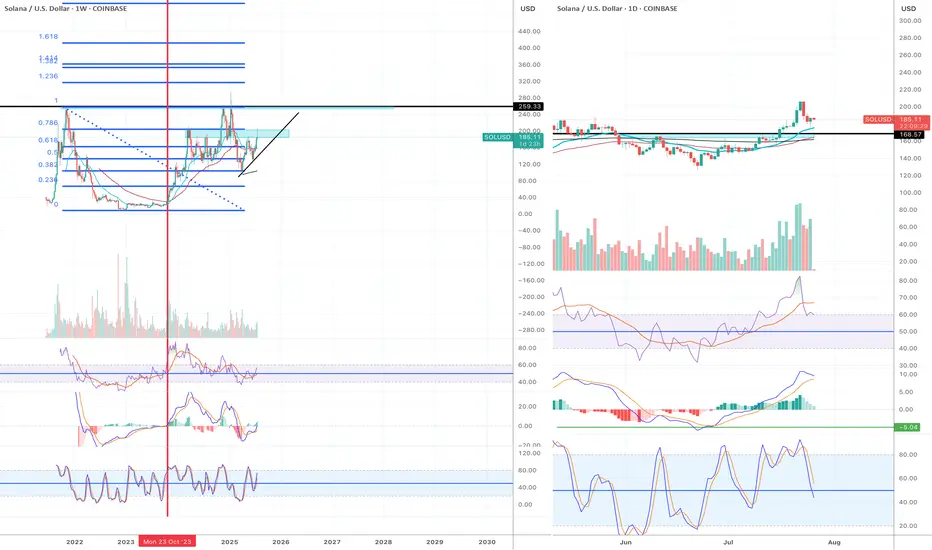
Very Bullish!!
Solana chart looks very bullish. The price is currently dropping but I think it is a very healthy correction.
Weekly chart:
1) all momentum indicators just entered the bull zone.
2) The chart is forming higher highs.
Daily:
1) EMA55 finally crossed EMA200. The last time they crossed was October 2023 (see red vertical line in the chart) and it was the beginning of the macro bull trend.
2) Momentum indicators have reached overbought territory and crossed to the downside, however, given weekly momentum indicators have just entered the bull zone, this move is likely to be corrective action.
3) When EMA55 and EMA200 cross, the price often retraces initially to EMAs (21, 55 or 200). Once it completes the pull back, I anticipate the price to move to the previous ATH and beyond.
This is the time when high leverage trading volume increases.
Be careful not get wicked out. Focus on monthly/weekly/daily charts and ignore the noise in the lower timeframes.
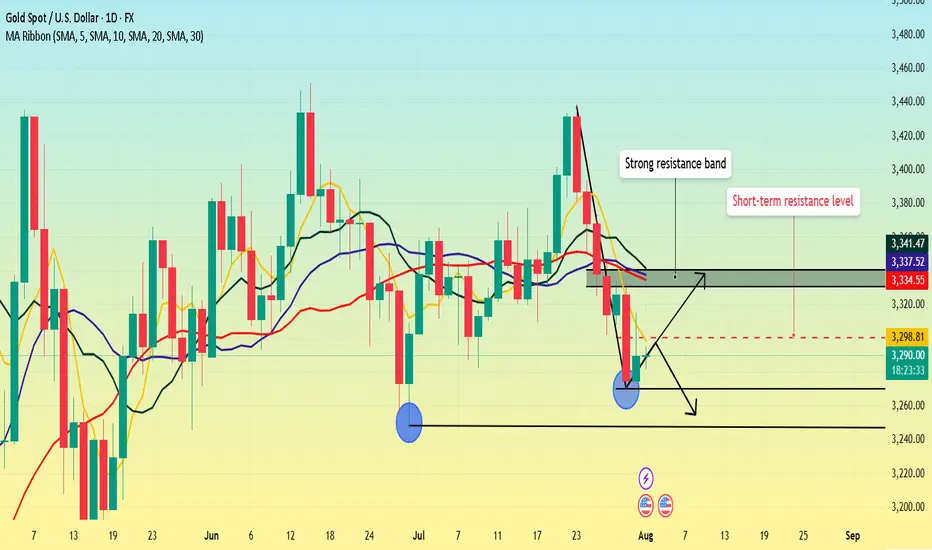
Non-farm payrolls are coming. What's the gold trend?Gold fell sharply on Wednesday, but Thursday's market didn't continue the downward trend as some investors expected. Instead, it showed a trend of rising and then falling.
From the daily perspective, we first need to focus on the resistance level near 3300 where the 5-day moving average is located. This position is not only a short-term technical resistance, but also reflects the market's psychological expectations to a certain extent. If prices can successfully break through this level and stabilize above it, it will indicate that bullish momentum is strengthening, potentially boosting market sentiment. At this point, the next resistance area to watch is the 3330-3340 range. This area converges the 10-day, 20-day and 30-day moving averages, forming a strong resistance band.
As for the support below, the primary focus is Wednesday's low of 3268. However, if this level is lost and the price continues to fall, the next support area will be around 3245, which is the previous low.
Trading strategy:
Short around 3300, stop loss at 3310, profit range 3280-3260.