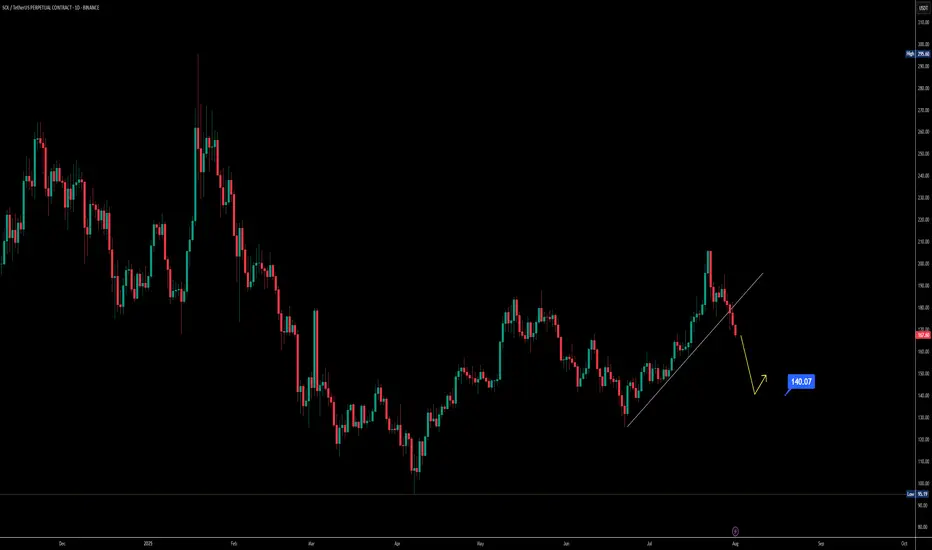
$SOL Loses Key Support | Eyes on $140 & $95 Zones📉 CRYPTOCAP:SOL Loses Key Support | Eyes on $140 & $95 Zones
🕵️♂️ On the daily timeframe, #Solana has officially lost its key support near $140, which previously acted as a strong bounce zone. A failure to reclaim this level could open the gates for a deeper drop toward the $95–$100 support range.
📊 Indicators signal downside:
RSI is trending downward
MACD shows a bearish crossover
Stochastic RSI confirms continued selling pressure
⚠️ Macro pressure adds fuel to the fire: August 1st tariff tensions, with expected news from Trump on charging Paris, are weighing down global risk assets. Historically, August tends to be a bearish month for crypto markets.
🎯 Key Levels to Watch:
Immediate Resistance: $140
Major Support: $95–$100
🧠 Trade wisely and manage risk accordingly.
Trend Analysis
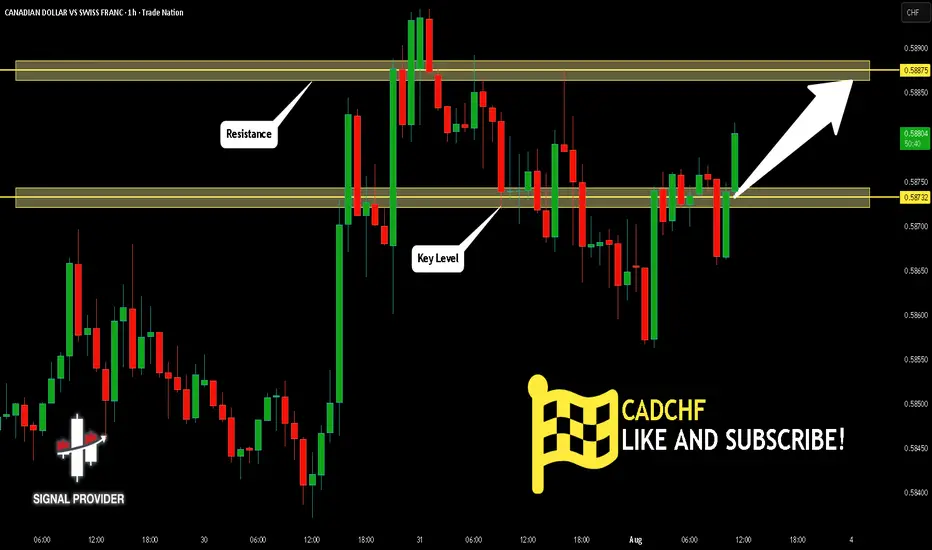
CADCHF Will Grow! Long!
Please, check our technical outlook for CADCHF.
Time Frame: 1h
Current Trend: Bullish
Sentiment: Oversold (based on 7-period RSI)
Forecast: Bullish
The market is trading around a solid horizontal structure 0.587.
The above observations make me that the market will inevitably achieve 0.588 level.
P.S
Please, note that an oversold/overbought condition can last for a long time, and therefore being oversold/overbought doesn't mean a price rally will come soon, or at all.
Disclosure: I am part of Trade Nation's Influencer program and receive a monthly fee for using their TradingView charts in my analysis.
Like and subscribe and comment my ideas if you enjoy them!
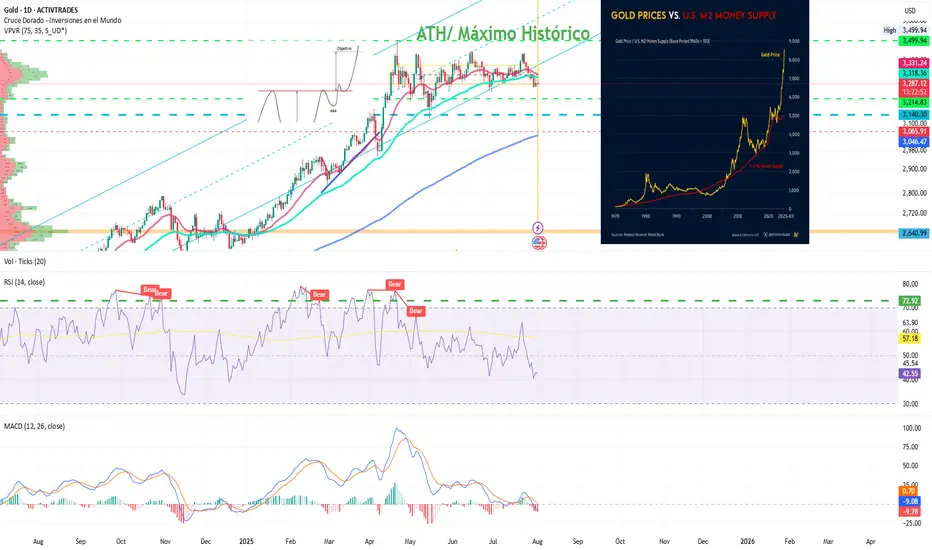
Gold: Are the Bulls Still Behind It?Ion Jauregui – Analyst at ActivTrades
Fundamental Analysis
In 2025, gold has appreciated around 27% year-to-date, reaching a peak of 33.37% at the end of April, driven by structural factors. Its strength is based on global de-dollarization, central bank purchases, persistent inflation, and expectations of real rate cuts in the U.S. Since real interest rates peaked in July 2023, gold has risen 74%, reinforcing its role as a hedge against monetary policy.
In addition, countries like China and Russia continue to accumulate gold as protection against the dollar and potential sanctions, supporting long-term structural demand. Diversifying with physical and financial gold (ETFs, mining stocks) is an increasingly common strategy in an environment of high debt, geopolitical tensions, and doubts about traditional safe-haven assets. A suggested allocation in a classic model portfolio could range between 10% and 25%, depending on the risk profile, in a typical equity-focused investment portfolio.
Technical Analysis
From a technical standpoint, gold has completed a long-term “cup with handle” formation that began in 2012, with an upside projection toward the $4,000 per ounce area. This pattern supports the continuation of its long-term upward structure.
In the short term, however, the price is in a consolidation phase after reaching all-time highs of $3,499.94 at the end of April. Since then, the lateral movement suggests a pause within the primary trend.
Technical indicators are showing mixed signals: RSI and MACD are pointing toward a possible oversold condition, suggesting a risk of short-term correction. Additionally, a bearish crossover between the 50-day and 100-day moving averages may reinforce selling pressure.
If this corrective scenario unfolds, gold could retrace toward a key support zone around $3,140, a level that has served as the base of the current range and where renewed buying interest could emerge.
Despite a possible pullback, the broader technical outlook remains constructive. Any correction would likely present tactical opportunities to re-enter the market—especially if expectations of real rate cuts or global geopolitical tensions persist.
Gold Consolidates After Highs
All in all, despite potential short-term pullbacks, gold continues to offer value as a tool for diversification, wealth protection, and a hedge against systemic risks. Its inclusion in portfolios remains relevant, even at current levels.
*******************************************************************************************
The information provided does not constitute investment research. The material has not been prepared in accordance with the legal requirements designed to promote the independence of investment research and such should be considered a marketing communication.
All information has been prepared by ActivTrades ("AT"). The information does not contain a record of AT's prices, or an offer of or solicitation for a transaction in any financial instrument. No representation or warranty is given as to the accuracy or completeness of this information.
Any material provided does not have regard to the specific investment objective and financial situation of any person who may receive it. Past performance and forecasting are not a synonym of a reliable indicator of future performance. AT provides an execution-only service. Consequently, any person acting on the information provided does so at their own risk. Political risk is unpredictable. Central bank actions can vary. Platform tools do not guarantee success.
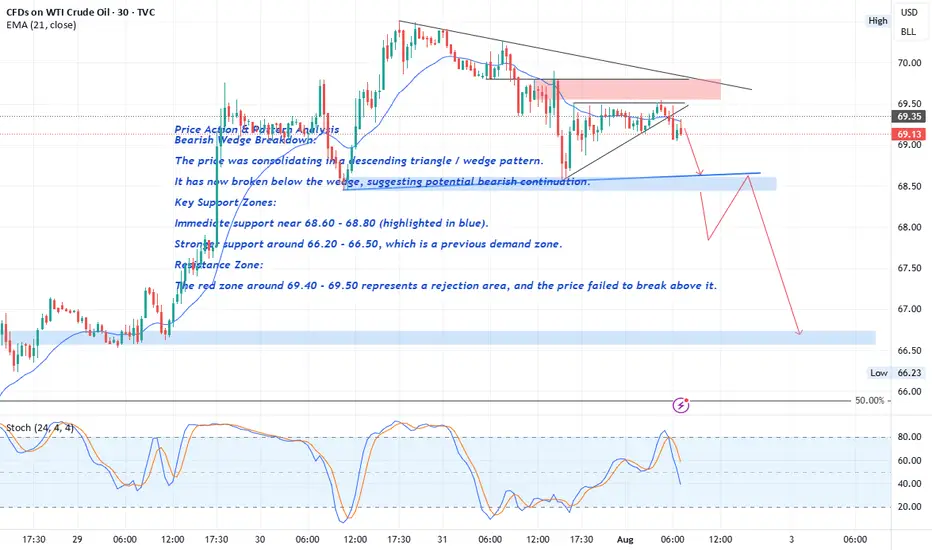
Crude Oil Price Action & Pattern Analysis
Bearish Wedge Breakdown:
The price was consolidating in a descending triangle / wedge pattern.
It has now broken below the wedge, suggesting potential bearish continuation.
Key Support Zones:
Immediate support near 68.60 - 68.80 (highlighted in blue).
FOREXCOM:USOIL
The break of the 68.60 level with a strong bearish candle would serve as confirmation of a Head and Shoulders (H&S) pattern , with solid bearish implications.
Stronger support around 66.20 - 66.50 , which is a previous demand zone.
Resistance Zone:
The red zone around 69.40 - 69.50 represents a rejection area , and the price failed to break above it.
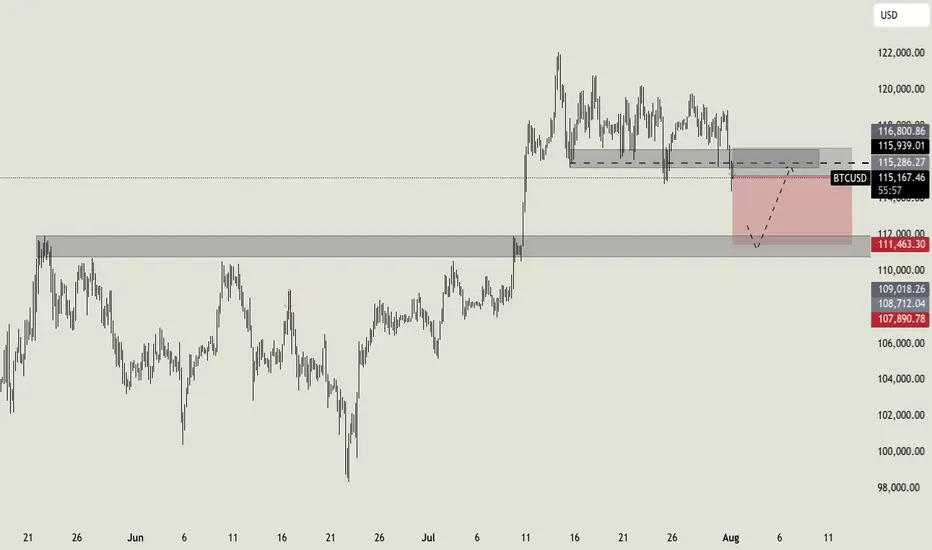
NO FEAR on BITCOIN!I was waiting for a break on this level from some days, and here we go! We catched a nice long setup previous days, and now Bitcoin broke down the key level i highlited last week. This is an important support area that will now act as resistance, so i expect a continuation to the downside till the second support area at $112.000. To invalidate this setup we should expect a clean break above $116.800.
Let me know in the comment what do you expect!
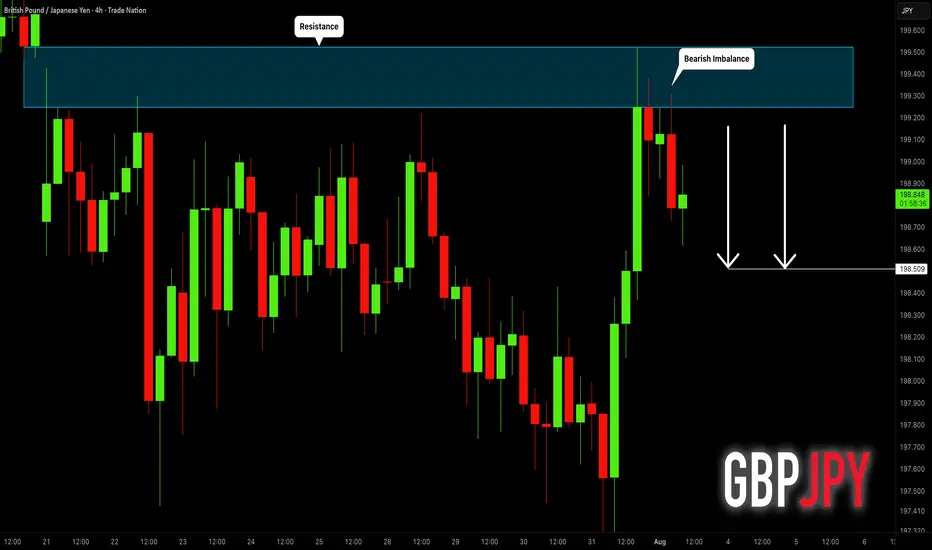
GBPJPY: Pullback From Resistance 🇬🇧🇯🇵
I think that GBPJPY will pull back from a wide
intraday supply area.
As a confirmation, I see a bearish imbalance candle that
is formed after its test.
Goal - 198.51
❤️Please, support my work with like, thank you!❤️
I am part of Trade Nation's Influencer program and receive a monthly fee for using their TradingView charts in my analysis.
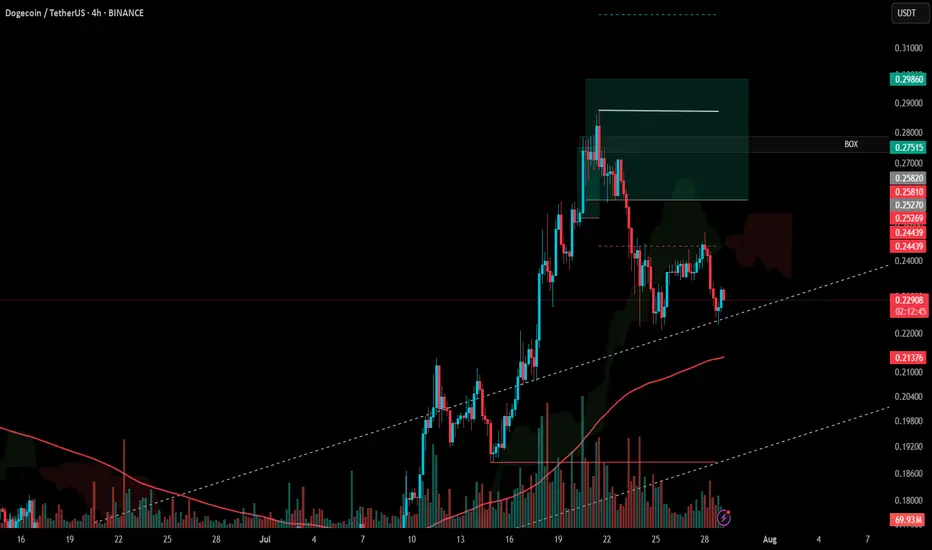
#DOGE Update #3 – July 29, 2025#DOGE Update #3 – July 29, 2025
I’m still holding my Doge position and haven’t been stopped out. I plan to lower my average cost by adding to the position at potential reversal zones. This is how I intend to proceed. My entry level is currently $0.2583, and my target is $0.2986, which means I’m aiming for roughly a 15% profit.
At the moment, the price has pulled back about 11% from that level. There’s nothing to worry about—it’s perfectly normal. Doge is continuing its movement by taking support from the bottom of an upward trend. I’m still in the position and planning to exit with profit without setting a stop.
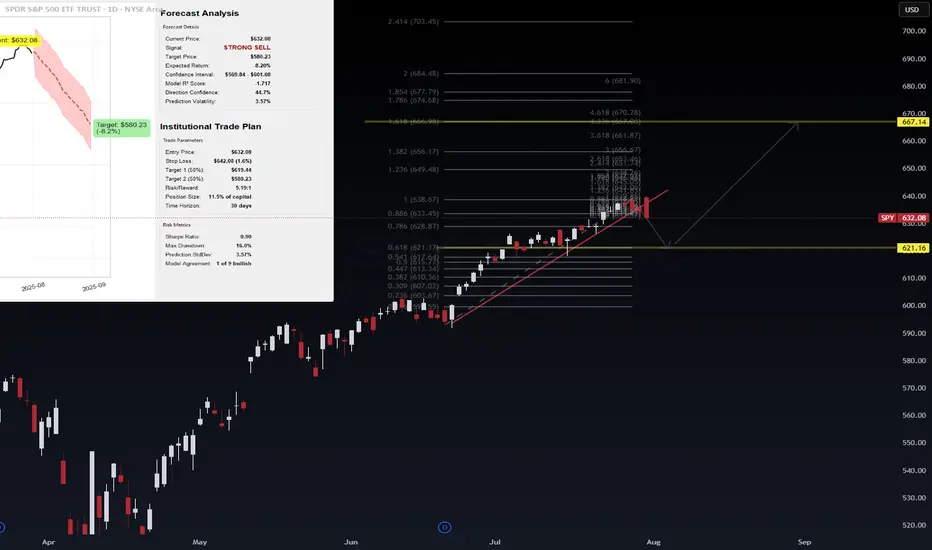
S&P 500 Futures – Trendline Breach + AI Forecast Signals Major C📉 S&P 500 Futures – Trendline Breach + AI Forecast Signals Major Correction
VolanX Risk Engine Flags High Probability Downside
🧠 Narrative:
Markets have enjoyed a powerful uptrend off the March lows, but the structure is showing signs of exhaustion.
The ascending trendline—untouched for over two months—has now been breached.
Fibonacci levels cluster below current price, with critical demand at:
6319.25 (immediate test zone)
6179.25 (0.618 retrace)
5964.75 (macro support / VolanX institutional target)
Meanwhile, VolanX Protocol's predictive engine has shifted to a "Strong Sell" with a projected correction path clearly outlined. The 30-day price forecast (shown in red) leans toward a mean reversion toward 5842.12 by late August.
📊 Institutional Trade Plan (VolanX DSS):
Entry Zone: 6360-6380 (Confirmed breakdown retest)
Target 1: 6179.25
Target 2: 5964.75
Final Target: 5842.12
Invalidation: Close above 6480 (new highs with strength)
🔎 Risk/Reward: 3.4+
📈 Trend Deviation: 7.4%
📉 Bearish Conviction: 84.1%
📌 Key Insights:
Breakdown below trendline confirms shift in control to bears
Institutional models anticipate volatility-led selloff
Major liquidity rests below 6200 and 5960 zones
This is not the time to chase highs—risk is asymmetric
🔮 VolanX Opinion:
“Volatility expansion is near. Institutional capital is likely rotating out of risk. The squeeze has passed; now the trapdoor may open.”
This is where preparation outperforms prediction. Execute with risk logic, not emotion.
📚 #SNP500 #ESFutures #SPX #MacroTrading #SmartMoney #InstitutionalFlow #TrendReversal #Volatility #LiquiditySweep #FibonacciLevels #VolanX #AITrading #EminiFutures #WaverVanir #QuantStrategy #TechnicalAnalysis #Forecast #TradingView
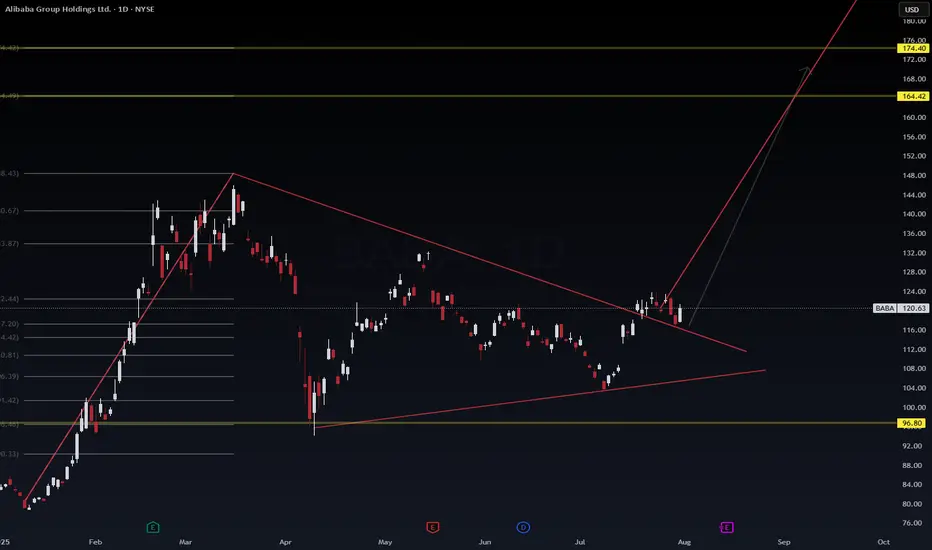
BABA: We have a bounce but is it temporary? Too many questions but dss forecasts a price growth near-term on ticker symbol $BABA. We will see where it goes. Another one on the watch is NASDAQ:PDD
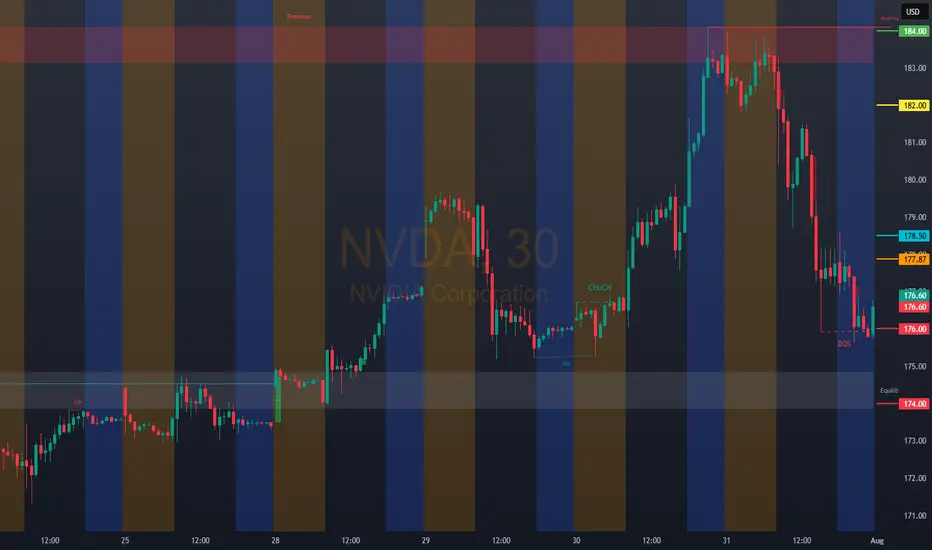
NVDA: 177.87Bullish Entries: 174.00/178.50 Stop 177.00 Target 182.00–184.00
Bearish Entries: 178.50/176.00 Stop 177.00 Target 172.00................Note if you find it somewhat confusing, here is the clarification 178.50 possible bullish reach zone wait for confirmation. 174.00 possible rebound zone or rejection of the bearish entry wait for confirmation for the bearish entry.
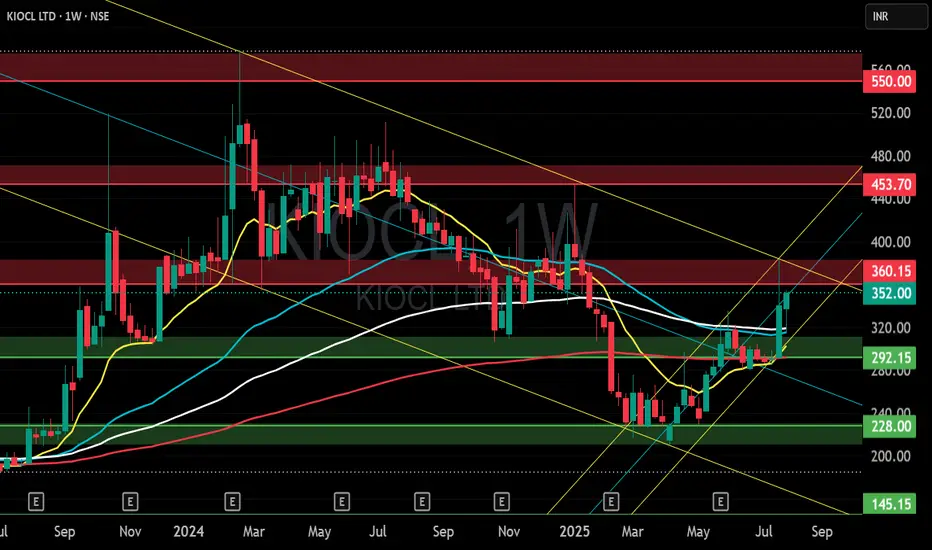
KIOCL LTD S/RSupport and Resistance Levels:
Support Levels: These are price points (green line/shade) where a downward trend may be halted due to a concentration of buying interest. Imagine them as a safety net where buyers step in, preventing further decline.
Resistance Levels: Conversely, resistance levels (red line/shade) are where upward trends might stall due to increased selling interest. They act like a ceiling where sellers come in to push prices down.
Breakouts:
Bullish Breakout: When the price moves above resistance, it often indicates strong buying interest and the potential for a continued uptrend. Traders may view this as a signal to buy or hold.
Bearish Breakout: When the price falls below support, it can signal strong selling interest and the potential for a continued downtrend. Traders might see this as a cue to sell or avoid buying.
MA Ribbon (EMA 20, EMA 50, EMA 100, EMA 200) :
Above EMA: If the stock price is above the EMA, it suggests a potential uptrend or bullish momentum.
Below EMA: If the stock price is below the EMA, it indicates a potential downtrend or bearish momentum.
Trendline: A trendline is a straight line drawn on a chart to represent the general direction of a data point set.
Uptrend Line: Drawn by connecting the lows in an upward trend. Indicates that the price is moving higher over time. Acts as a support level, where prices tend to bounce upward.
Downtrend Line: Drawn by connecting the highs in a downward trend. Indicates that the price is moving lower over time. It acts as a resistance level, where prices tend to drop.
Disclaimer:
I am not SEBI registered. The information provided here is for learning purposes only and should not be interpreted as financial advice. Consider the broader market context and consult with a qualified financial advisor before making investment decisions.
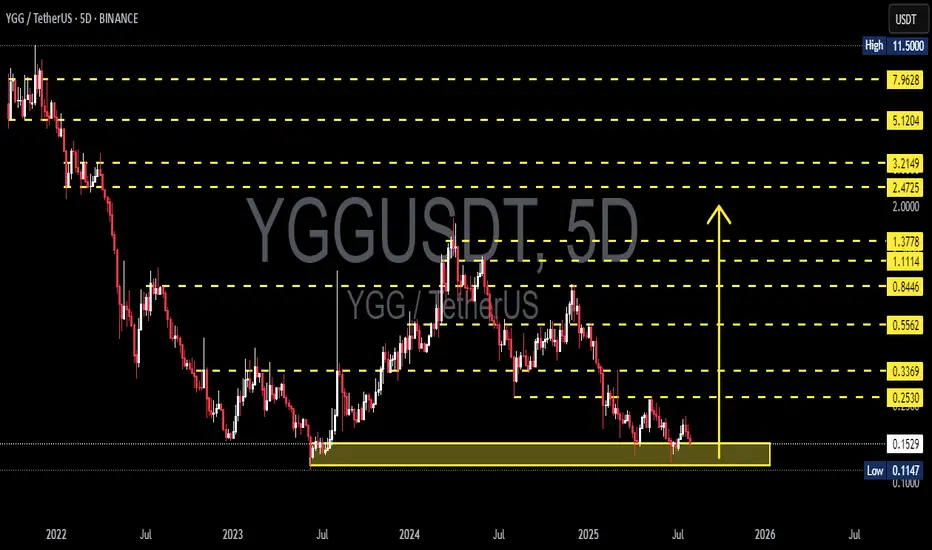
YGGUSDT Retesting Historical Support Zone! Bounce or Breakdown?YGG/USDT is currently at a critical crossroad. After a long-term downtrend from the peak at $11.50, the price has once again returned to the historical demand zone between $0.1147 and $0.1535 — an area that previously served as a strong base for reversals in the past.
Will this level act as a launchpad for a strong rebound, or are we about to witness a fresh breakdown?
---
🔍 Comprehensive Technical Analysis:
📌 Mid-Term Market Structure:
Price remains in a macro downtrend, but is now entering a potential accumulation phase.
This support zone has been tested multiple times throughout 2023–2025, confirming it as a key psychological level.
The current structure resembles a bottoming range, setting the stage for a possible trend reversal.
📊 Key Support & Resistance Levels:
🟩 Major Demand Zone: $0.1147 – $0.1535 (highlighted green box on the chart)
📈 Bullish Upside Targets:
$0.2530 (initial resistance & breakout trigger)
$0.3369 (early trend strength confirmation)
$0.5562 – $0.8446 (realistic mid-term targets)
Up to $1.11 and $1.37 (longer-term resistance)
---
🐂 Bullish Scenario (Reversal Potential):
If price holds this support and forms a clear reversal pattern:
A strong rebound toward $0.2530 – $0.3369 is highly likely.
A breakout above $0.3369 would confirm a double bottom or falling wedge breakout.
Additional catalyst: positive sentiment in the broader crypto market could accelerate the move.
🔔 Confirmation needed: a strong bullish candle + rising volume = reversal validation.
---
🐻 Bearish Scenario (Breakdown Risk):
If support at $0.1147 fails:
Price could slide lower toward $0.10 or even create a new all-time low.
This would extend the current bearish structure and invalidate short-term recovery hopes.
---
🧠 Pattern Insight:
The current setup resembles a sideways accumulation range.
Possible bullish formations:
Double Bottom
Rounding Bottom
Falling Wedge Breakout (typically bullish)
---
🎯 Strategy & Trader Perspective:
Aggressive Traders: May consider entering near support with tight stop-loss below $0.1147 and targets around $0.2530 – $0.3369.
Conservative Traders: Wait for a confirmed breakout above $0.2530.
Long-Term Investors: This area could present a gradual accumulation opportunity if you believe in YGG’s long-term fundamentals.
---
📝 Conclusion:
This isn't just a technical support level — it's a battle zone between bullish hope and bearish pressure. The next few candles will be crucial to determine whether the bulls will regain control or the bears will break through.
#YGG #YGGUSDT #CryptoSupport #CryptoRebound #AltcoinAnalysis #BullishReversal #CryptoBearish #CryptoTrading #TechnicalAnalysis
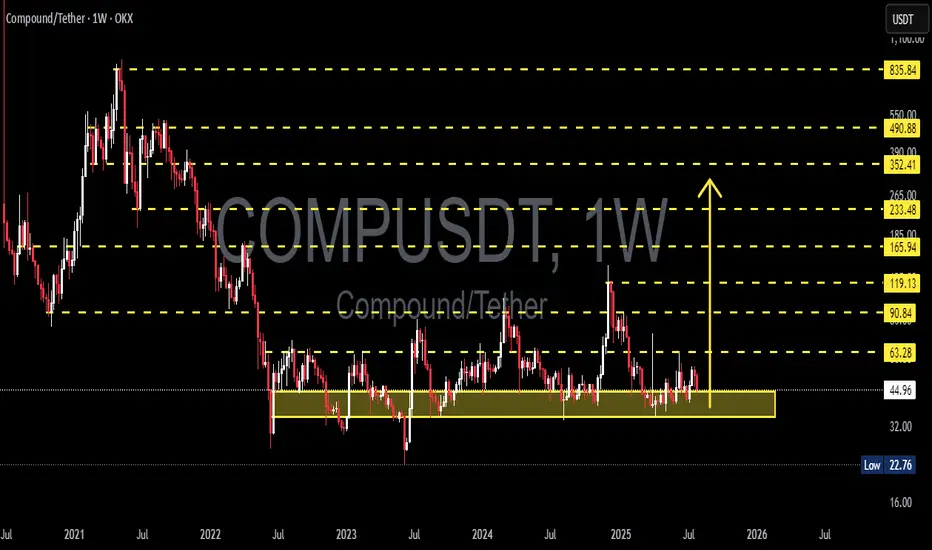
COMPUSDT in a Strong Demand Zone! Reversal Potential / Breakdown🔍 In-Depth Analysis (Timeframe: Weekly / 1W)
The COMP/USDT pair is currently hovering above a long-term demand zone that has held strong since mid-2022. Price is sitting around $44.90, just above the key support area of $32 – $45 (highlighted in yellow), which has acted as a major accumulation zone for over 2 years.
🧱 Critical Zone: Smart Money Accumulation or Exhaustion?
The $32–$45 demand zone has been tested multiple times, indicating smart money interest and hidden buying pressure.
Price action in this range forms a clear base structure or horizontal accumulation pattern, a classic setup before a large directional move.
However, the prolonged sideways consolidation hints at an imminent breakout or breakdown — momentum is building.
---
📊 Key Technical Pattern:
🟨 Rectangle Range (Accumulation Structure)
Price has been ranging between $32 and $63.28 with no clear breakout.
Strong rejections every time price dips below $35 indicate consistent buyer defense.
🔃 Mean Reversion Behavior
Repeated moves back to the mid-range reflect an indecisive market (equilibrium phase), often seen before expansion.
---
📈 Bullish Scenario (Potential Reversal):
If price breaks above major resistance at $63.28:
1. Upside Targets:
🎯 $90.84 (key resistance zone)
🎯 $119.13 (prior distribution zone)
🎯 $165.94 (macro target if sentiment turns highly bullish)
2. Confirmation needed via weekly close above $63 with strong volume.
3. A bullish breakout may form a new Higher Low and Higher High structure on both daily and weekly timeframes.
🟢 Bullish confirmation: Weekly bullish engulfing + volume breakout above $63.
---
📉 Bearish Scenario (Potential Breakdown):
If price closes below the $32 support:
1. Possible downside targets:
⚠️ $22.76 (next logical support)
🚨 $16 (last consolidation base pre-2021 rally)
2. A break below this long-term support could trigger a final capitulation flush before a potential macro reversal.
🔴 Bearish confirmation: Weekly close below $32 with increased volume and sustained selling.
---
⚖️ Strategic Takeaway:
COMP/USDT is currently at a pivotal decision zone — a crossroads between massive upside potential and deeper downside risk.
This is not just another support area, it’s a macro-level demand zone that will likely dictate trend direction in the coming months.
⏳ A major move is brewing — whether breakout or breakdown, be ready.
#COMPUSDT #CryptoOutlook #TechnicalAnalysis #AltcoinSeason #DeFi #CryptoTrading #AccumulationZone #BreakoutSetup #BearishScenario #BullishSetup #CryptoAnalysis
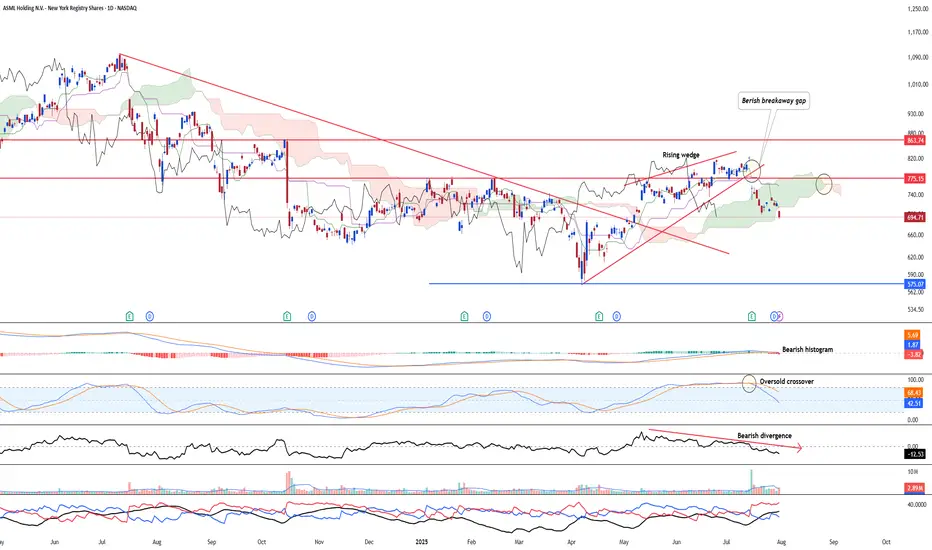
ASML - Resuming its bearish trendASML NASDAQ:ASML saw a strong bearish continuation after the stock has broken below its rising wedge formation. Ichimoku has shown a clear three bearish death cross right after yesterday's gap down below the kumo.
Bearish divergence is in on the 23-period ROC.
Long-term MACD has performed a bearish crossover at the top and histogram is negative.
Stochastic Oscillator has confirmed the overbought signal.
23-period ROC turns negative and forms a bearish divergence. Directional movement index saw increased bearish trend strength signal.
Target is at the next support of 575
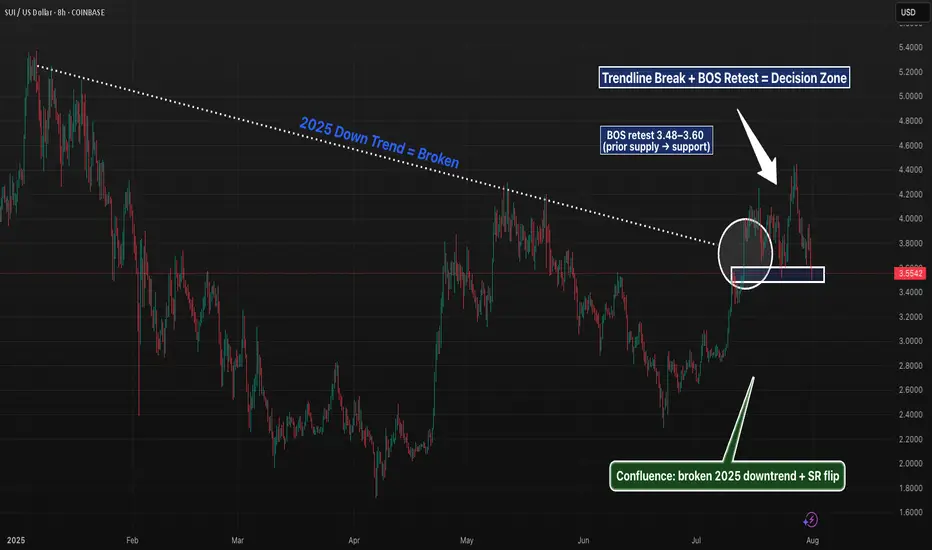
SUI 8H – Trendline Break, BOS Retest, and SR FlipSUI is at a pivotal level after cleanly breaking its 2025 downtrend and flipping prior supply into potential support. The current zone ($3.48–$3.60) marks a textbook BOS retest, aligning with the broken trendline and a clear structure shift.
Price has already printed a higher high, and if this zone holds, it could establish a higher low — a key confirmation for bullish continuation. Momentum traders may watch for reclaim of $3.70 for confluence, while invalidation sits below $3.32.
A break lower opens the door to deeper retracement targets around the 0.618 zone ($3.32–$3.38), but structure remains intact until then. Clean price action, strong confluence, and a clear invalidation level make this an actionable zone to watch.
📊 Structure: BOS → Retest
🧠 Bias: Bullish if $3.48–$3.60 holds
📉 Invalidation: 8H close below $3.32
🔔 Next key levels: $3.90, $4.10, $4.45
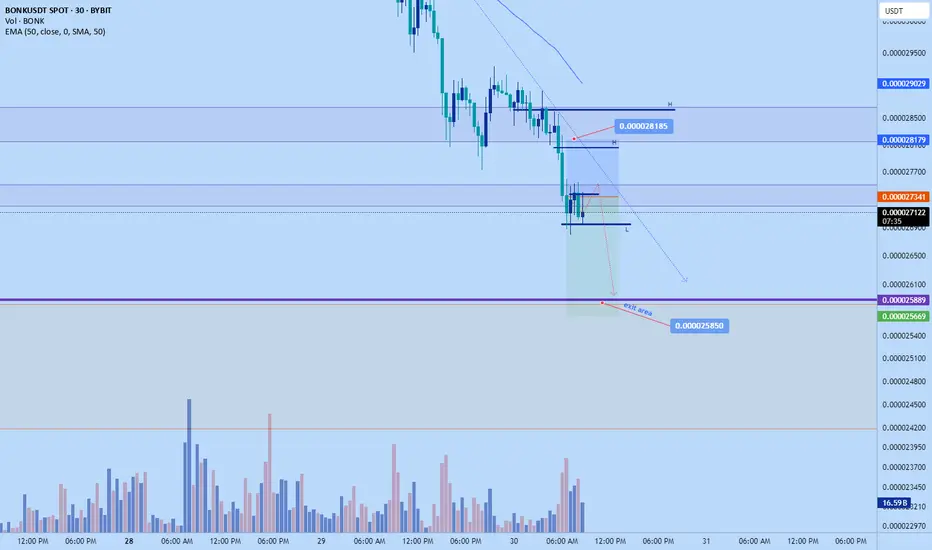
Bonk short to $0.02585Opened a short position on bonk just now. Aiming for 0.02585
Sl: $0.028185 or higher
Roughly 2RR
DTT strategy used - Learn more on X
Gold's Strong Moves: Will the Bears Take Over?Hello everyone, Kevinn here!
Today, gold continues to experience significant fluctuations in the new week, with XAU/USD currently hovering around 3,325 USD. Amid the strong rise of the USD, the gold market has seen a sharp adjustment. However, the medium-term trend still seems to favor the bears.
The main reason for the turbulence in gold prices is the strengthening of the U.S. dollar, following strong economic news from the U.S. that points to a clear recovery. The stronger USD has made gold more expensive for international investors. Additionally, the market is awaiting further moves from the Fed regarding interest rate policies, which is limiting the flow of capital into gold.
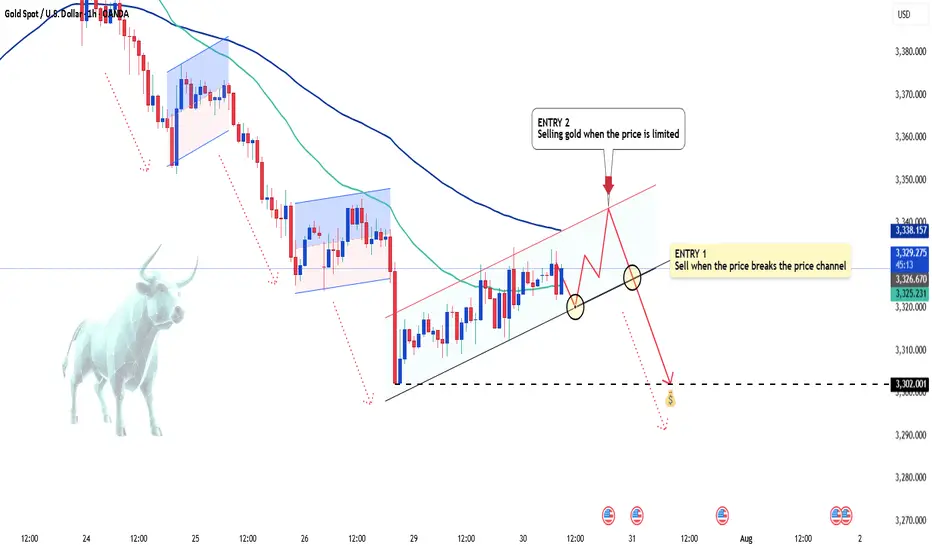
Looking at the technical chart, we can see that although gold has shown a slight uptick, bearish pressures are still lurking. Indicators and patterns suggest that gold may break its rising price channel, with a high likelihood of further declines. The next support level could be around 3,310 USD, and if broken, gold may continue to fall toward 3,300 USD or lower.
Based on the signals from the chart, ENTRY 1 strategy would be to sell when the price breaks the upward channel. Additionally, if the price pulls back to the upper limit zone, ENTRY 2 could present another potential selling point.
For today's strategy, I expect gold to decrease. What do you think? Share your thoughts in the comments!
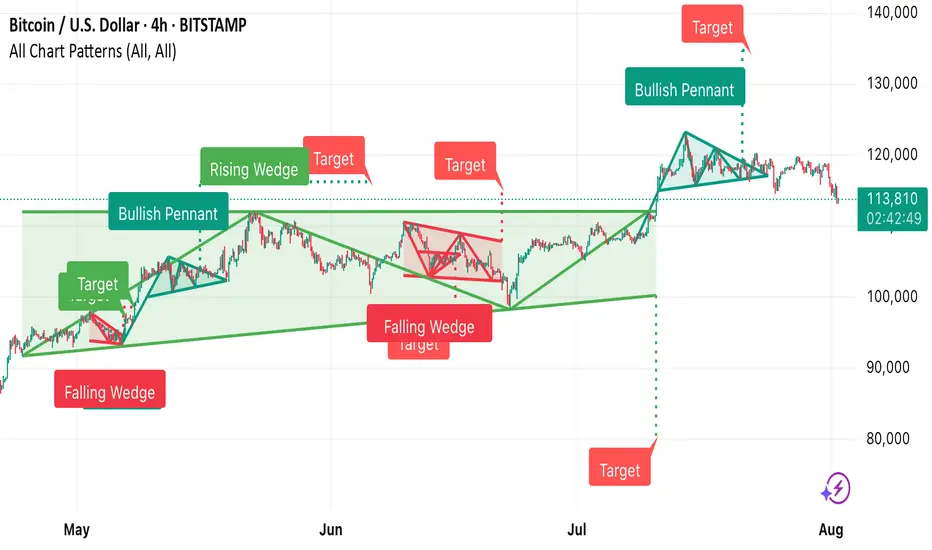
This Bitcoin 4-hour chart from TradingView shows multiple techni • Falling Wedge (early May) → Bullish breakout, target achieved.
• Bullish Pennant → Strong upward continuation.
• Rising Wedge (June) → Bearish breakdown, target met.
• Falling Wedge (mid-June) → Bullish breakout, target achieved.
• Bullish Pennant (late July) → Upward move toward the 140,000 target zone.
Currently, BTC is trading around 113,829, below recent highs, and near the dotted horizontal support zone from the last breakout.
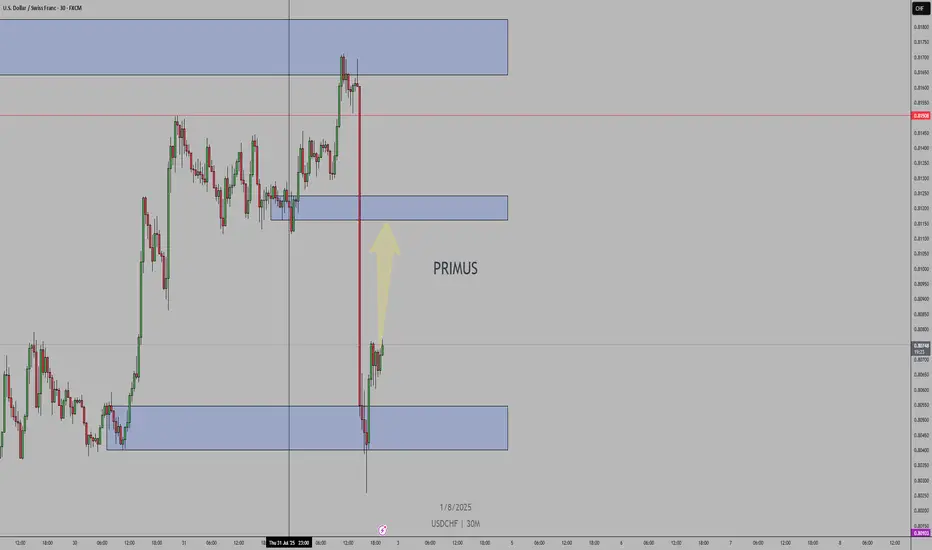
USDCHFUSD/CHF Bullish Bias — Price is holding above demand with market structure showing higher highs and higher lows. COT data supports continued USD strength. As long as demand holds, expecting further upside towards next resistance.
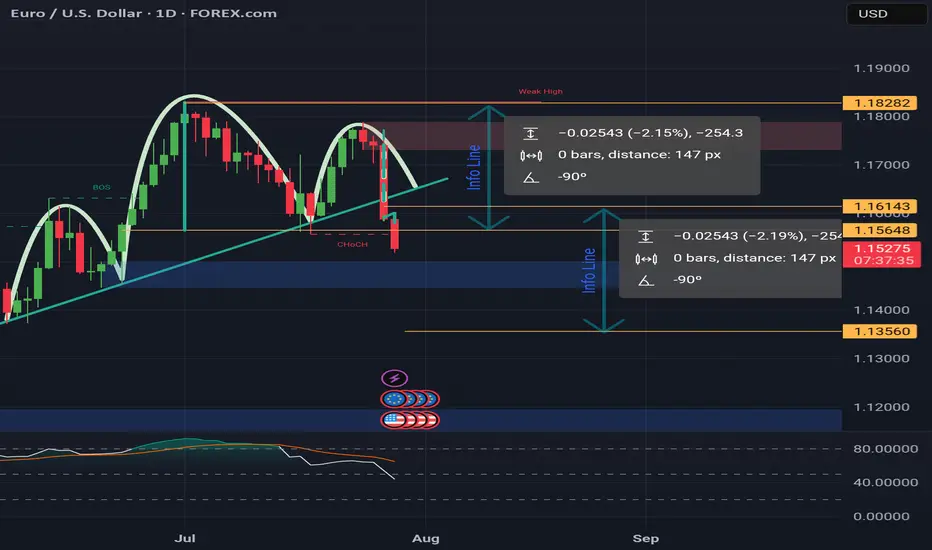
Head & Shoulders on EUR/USD daily!We're currently observing a significant Head & Shoulders pattern forming on the EUR/USD daily chart, with the price just breaking below the neckline on the right shoulder.
Applying standard Head & Shoulders trading principles, we measure the distance from the head's peak to the neckline and project that same range downward from the breakdown point. Based on this, the estimated target price (TP) for the trade lands around $1.135. The stop-loss will be positioned just above the right shoulder to manage risk effectively.
We'll be watching closely to see how this setup unfolds. 🍻
GBP/JPY Clears July LowGBP/JPY clears the July low (195.37) as it tumbles to a fresh weekly low (195.34), and a close below the 195.70 (61.8% Fibonacci extension) to 196.60 (23.6% Fibonacci extension) region may push the exchange rate toward the June low (192.73).
Failure to hold above the 192.40 (50% Fibonacci extension) to 193.50 (38.2% Fibonacci extension) zone may lead to a test of the May low (190.33), but the selloff in GBP/JPY may turn out to be temporary if it defends the rebound from the June low (192.73).
GBP/JPY may attempt to retrace the decline from the July high (199.98) should it hold/close above the 195.70 (61.8% Fibonacci extension) to 196.60 (23.6% Fibonacci extension) region, with a close above the 199.80 (61.8% Fibonacci retracement) to 200.50 (78.6% Fibonacci extension) region opening up 201.20 (23.6% Fibonacci retracement).
--- Written by David Song, Senior Strategist at FOREX.com

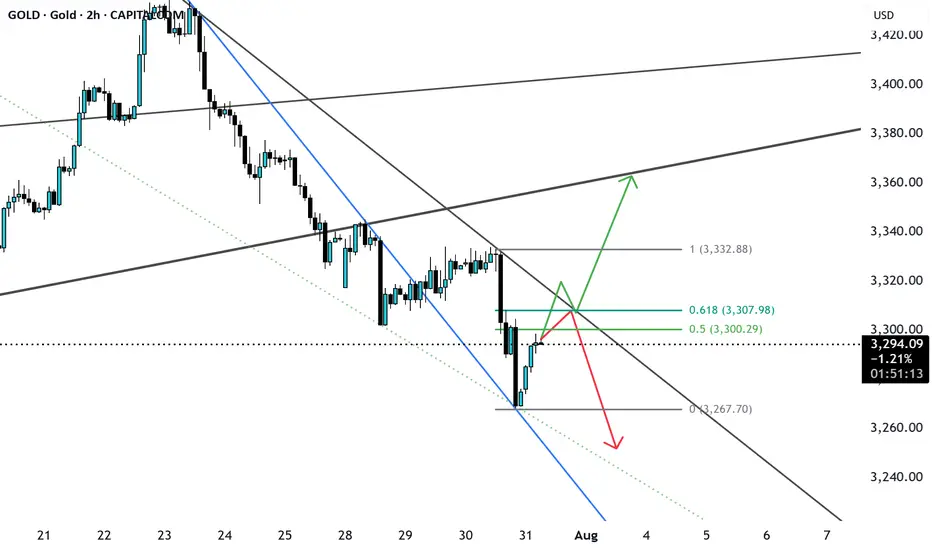
GOLD possible ScenarioCurrently gold has broken a major trendline and currently trading in bearish momentum, currently consolidating or pullback from support and may get rejected from 0.5 or 0.618 if bearish ahs to continue 3240-3250, if breaks the fib level along with trendline resistance can easily price can reach 3340 major resistance level. let us see.
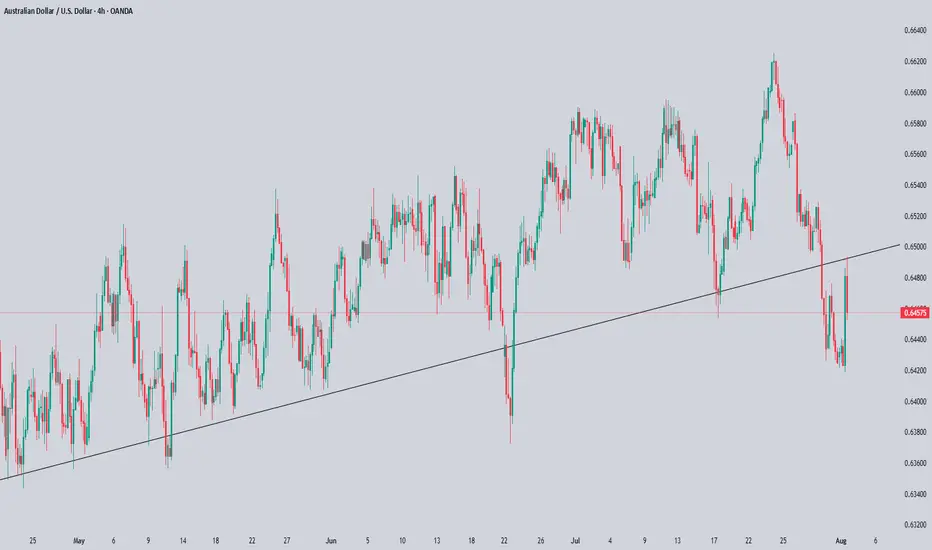
AUDUSD Technical & Order Flow AnalysisOur analysis is based on a multi-timeframe top-down approach and fundamental analysis.
Based on our assessment, the price is expected to return to the monthly level.
DISCLAIMER: This analysis may change at any time without notice and is solely intended to assist traders in making independent investment decisions. Please note that this is a prediction, and I have no obligation to act on it, nor should you.
Please support our analysis with a boost or comment!