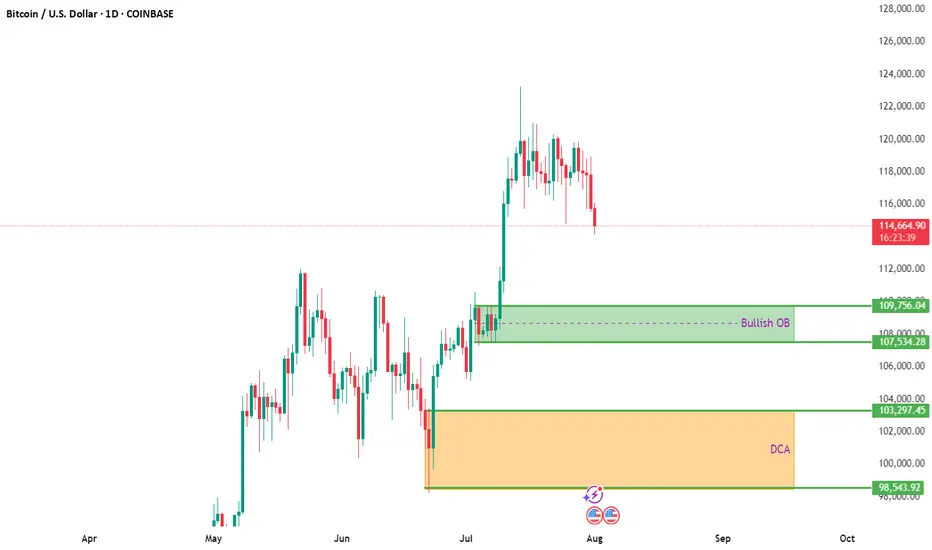
BTCUSD Daily Analysis – Key Entry & DCA ZonesBitcoin is currently pulling back after a strong bullish move, now hovering near $115K. The correction opens a potential window for smart entries based on prior market structure and order block analysis.
🔍 Bullish Order Block (OB):
✅ Zone: $107,534 – $109,756
This area previously served as a breakout zone after consolidation. A retest of this region could act as strong support, making it a prime candidate for short- to mid-term bullish setups.
🟧 DCA Zone (Long-Term Accumulation):
✅ Zone: $98,543 – $103,297
Ideal for long-term investors looking to build exposure gradually. Dollar-cost averaging in this zone allows entry at historically undervalued levels in case of a deeper pullback.
🧠 Trading Insight:
Patience pays. Let price come to your levels rather than chasing. Use alerts and consider scaling into positions with proper risk management.
📌 Chart Context: 1D | COINBASE
📆 August 2025
📈 TA by: @NFX_Solutions
#BTC #Bitcoin #Crypto #BTCUSD #TechnicalAnalysis #OrderBlock #TradingView #CryptoStrategy #DCA #SwingTrade #SupportZone
Trend Analysis
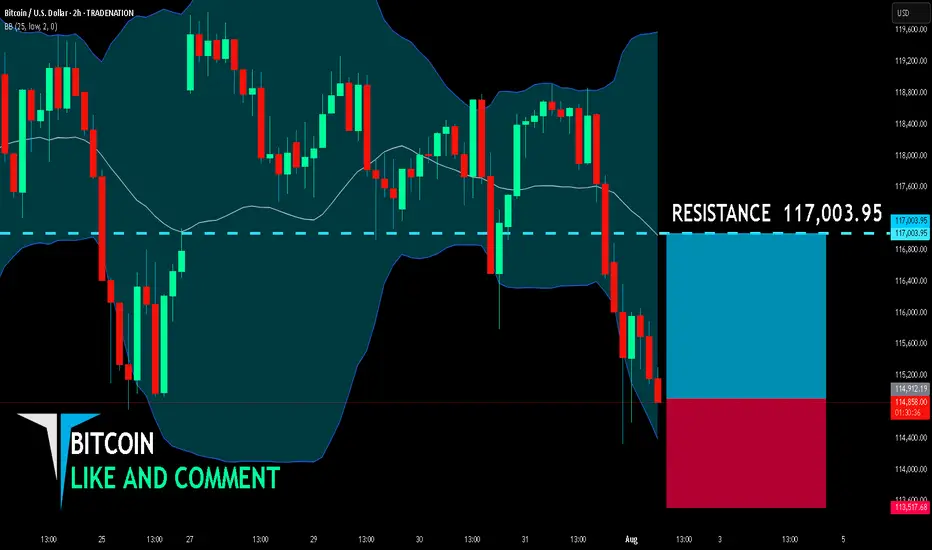
BITCOIN SENDS CLEAR BULLISH SIGNALS|LONG
BITCOIN SIGNAL
Trade Direction: long
Entry Level: 114,912.19
Target Level: 117,003.95
Stop Loss: 113,517.68
RISK PROFILE
Risk level: medium
Suggested risk: 1%
Timeframe: 2h
Disclosure: I am part of Trade Nation's Influencer program and receive a monthly fee for using their TradingView charts in my analysis.
✅LIKE AND COMMENT MY IDEAS✅
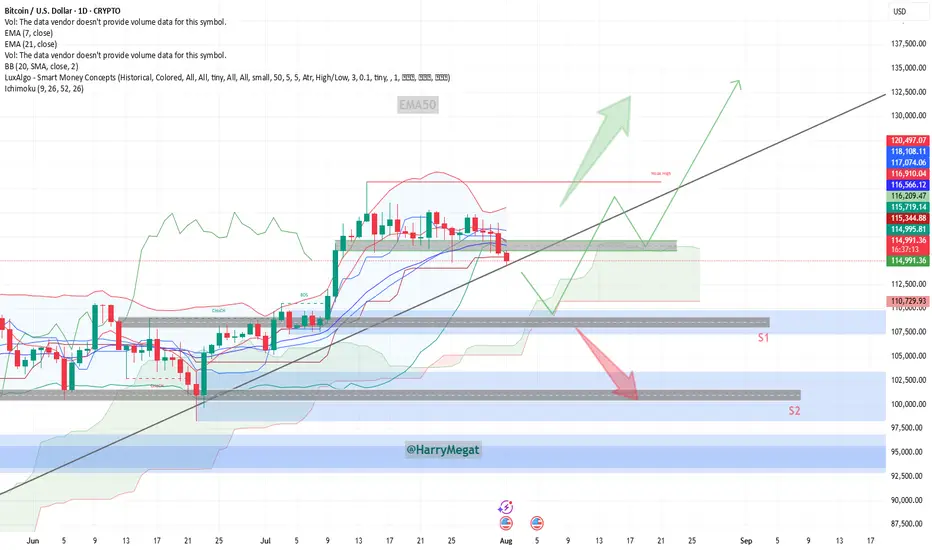
Analysis BTC/USD Daily ChartAnalysis BTC/USD Daily Chart
**Chart Overview (Daily Timeframe)**
**Current Price**: \~\$114,937
**EMA 7**: \$116,896 (short-term)
**EMA 21**: \$116,561 (medium-term)
**Trendline**: Price is testing the long-term ascending trendline
**Key Zones:**
* **Support 1 (S1)**: \~\$110,000
* **Support 2 (S2)**: \~\$102,000
* **Immediate Resistance Zone**: \~\$116,000–\$120,000
**Bullish Scenario**
**Conditions**:
* Price **holds above the ascending trendline**
* A strong **bounce from current level (\~\$115K)** or a reclaim above **\$116K**
**Buy Setup**:
* **Entry**: \$115,000–\$116,000 (if bounce confirmed)
* **Stop-loss**: Below \$114,000 or the ascending trendline
* **Targets**:
* TP1: \$120,000
* TP2: \$125,000
* TP3: \$132,000+
**Confirmation**:
* Bullish candle formation near the trendline
* Reclaim of EMAs (especially EMA 7)
**Bearish Scenario**
**Conditions**:
* Price **breaks below the ascending trendline** and **closes below \$114K**
* Rejection from \$116K zone with a strong red candle
**Sell Setup**:
* **Entry**: Below \$114,000 (on confirmed breakdown)
* **Stop-loss**: Above \$116,000
* **Targets**:
* TP1: \$110,000 (S1)
* TP2: \$105,000
* TP3: \$102,000 (S2)
**Invalidation**:
* Quick recovery above \$114.5K and trendline reclaim = possible fakeout
**Bias**
**Neutral to Bullish**, as price is **at trendline support**.
Watch closely for **price reaction at current levels** for the next directional trade.
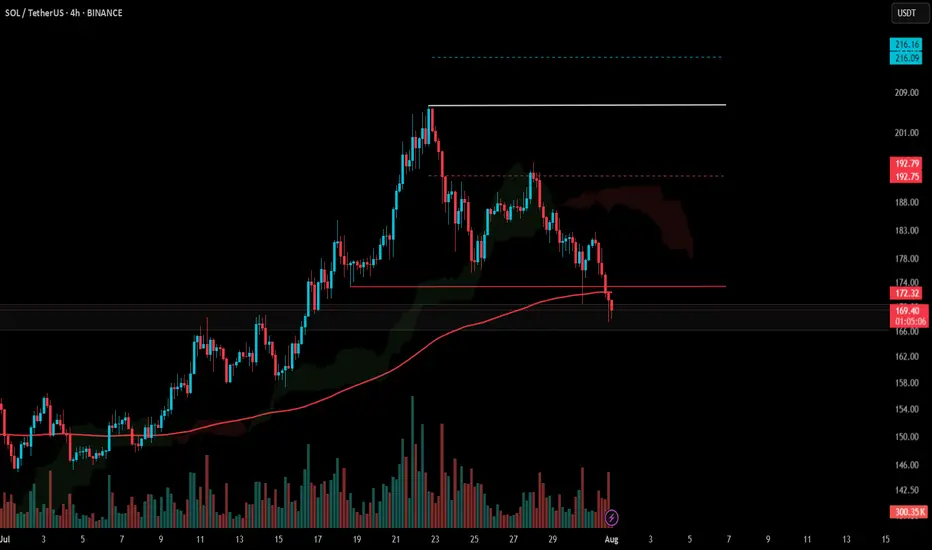
#SOL Update #6 – Aug 01, 2025#SOL Update #6 – Aug 01, 2025
Unfortunately, Solana failed to hold the last low where its most recent impulsive move had started, and it closed below that level. This close also occurred below the MA200 band. In other words, Solana broke a very strong support on the 4-hour chart and moved downward, reaching the previous K-Level zone. It’s hard to say anything positive for Solana at this stage. If the current K-Level fails to hold, Solana may look for support around the $158 level. A long position on Solana is definitely not recommended. I also do not suggest a short position. However, unless there’s a strong reversal, it’s safe to say that Solana has entered a bearish phase on the 4-hour chart.
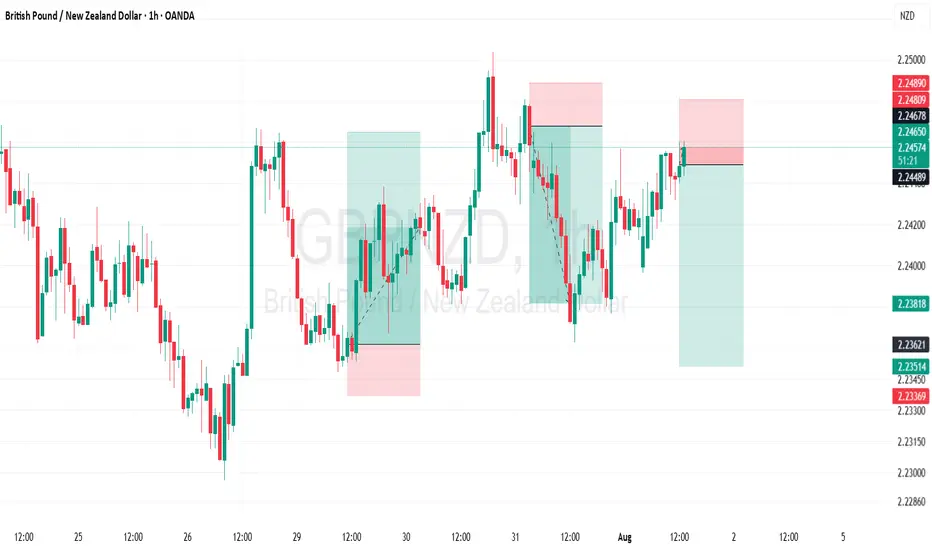
Short on GBPNZD i'm shorting GBP/NZD due to the liquidity zone below, which suggests a potential downside breakout. The pair is approaching a significant support level where previous buy orders are likely clustered. If price breaks through this zone, stop-loss orders could be triggered, accelerating downward momentum. Additionally, fundamental factors
ADA Monthly Buying Opportunity As per my analysis ADA is showing buying opportunity in monthly chart. I hope it will return max 50% of investment in coming months. Trend is bullish, Monthly volume is above the average volume, golden level support. Do your own research before taking any risk.

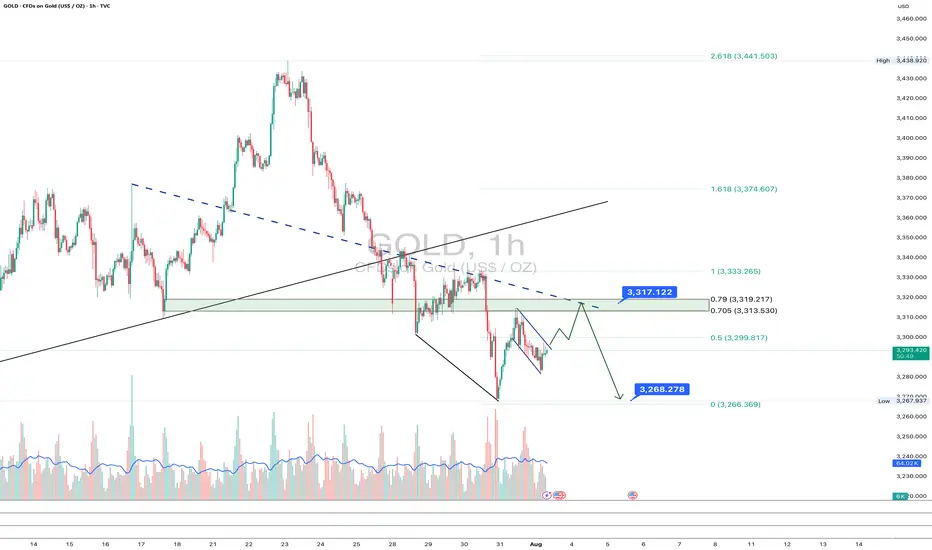
Gold: final pullback or bull trap?On the 1H chart, gold (GOLD) is forming a bullish flag after a sharp decline, which may just be a corrective move within a broader downtrend. The price is now approaching the key resistance zone around $3313–$3317 - this area holds the POC, broken trendline, and the 0.705–0.79 Fibonacci retracement from the last drop. This is the decision-making zone.
If bulls fail to push above it, we expect a move down toward $3268 - the next strong support and potential buy zone, also confirmed by Fibonacci and local demand. Stochastic divergence and slowing volume suggest a possible rebound from that level. However, if the price breaks and holds above $3317, this would indicate a local trend reversal, with targets at $3333 and $3374.
Watch the $3317 zone closely - bulls have yet to prove this is more than just a bounce.
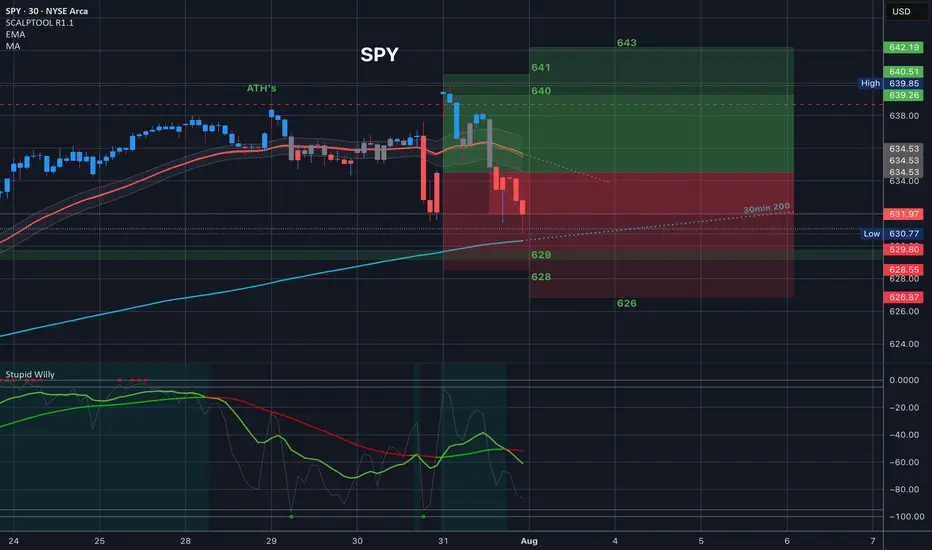
$SPY Analysis, Key Levels & Targets
This is how last night’s members chart played out and it was amazing. We opened at the top of the trading range and all of the spreads at the top paid as we dropped back to the 30in 200MA
Non-farm payrolls are coming. Will it trigger the market?On Thursday, the US dollar index briefly rallied after the Federal Reserve's favorite inflation indicator unexpectedly rebounded, crossing the 100 mark for the first time in two months. This marked the sixth consecutive trading day of gains and the first monthly gain since 2025.
Spot gold rebounded as risk aversion lingered amid uncertainty surrounding Trump's tariff deadline, reaching a high of around $3,315, but its intraday gains narrowed after the release of the PCE data.
The dollar has already firmly established itself above the 100 mark on the daily chart, so the next target is likely to be between 101.5 and 102.0. Currently, support levels on the daily chart are visible at 99.5 and 99.0.
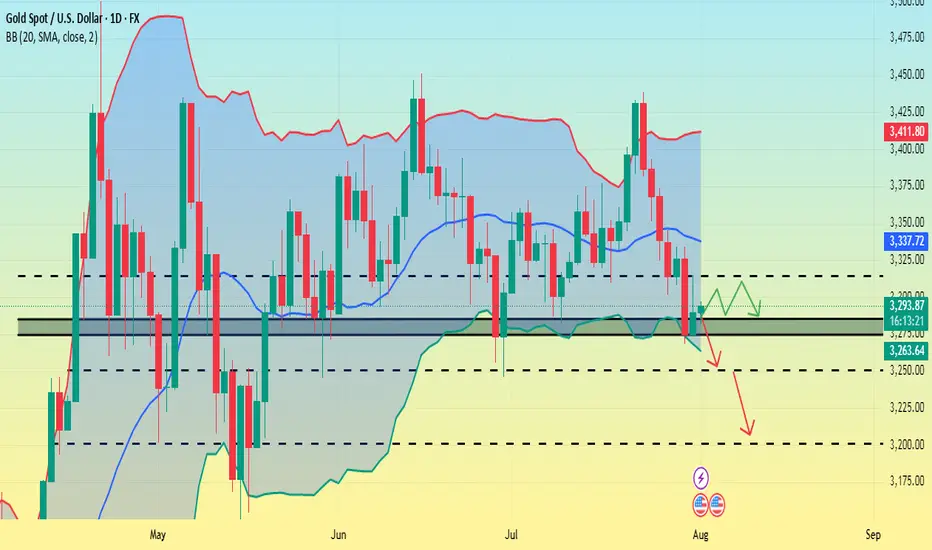
The gold market is currently consolidating in the 3315-3275 range. However, if the dollar rises again, Quaid believes gold prices could fall below 3275.
On the daily chart, if it falls below 3275, the price would likely be around 3250. If 3250 falls below, the market could test 3200. However, the possibility of a consolidation between 3315 and 3275 remains undisputed.
Before the release of the non-farm payroll data, scalping within this consolidation range is advisable. However, the risk is relatively high, so please take profits in time.
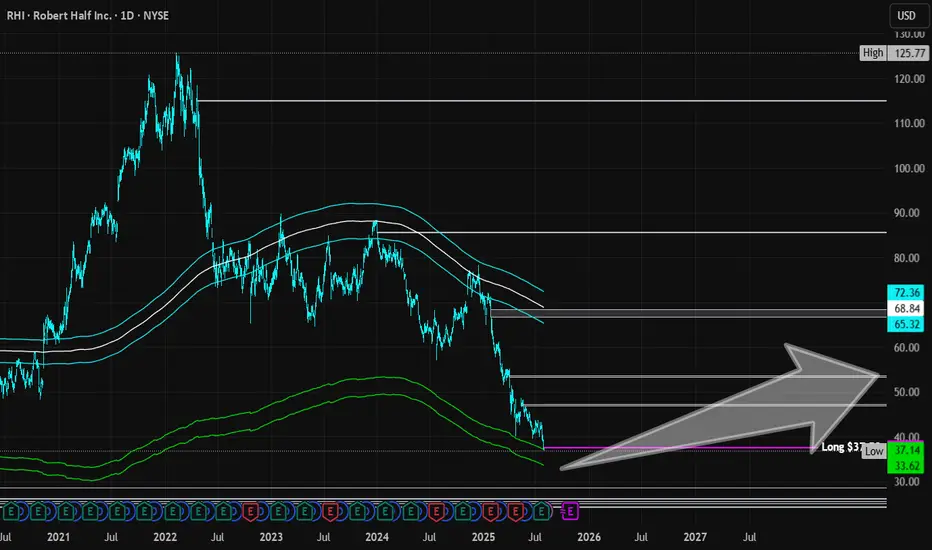
Robert Half | RHI | Long at $37.58Robert Half NYSE:RHI is a company that provides talent solutions and business consulting services in the US and internationally. It's a cyclical stock. Currently, the price has entered my "crash" simple moving average zone ($37-$33) and has historical bounced from this area. This doesn't mean the "major crash" area won't be reached ($26-$21 or below), but the company has been around since 1948 and survived many hurdles along the way.
Earnings are forecast to grow 8% annually and it has a 6.3% dividend. P/E = 21x and financially healthy (low debt-to-equity: .2x, low bankruptcy risk/Altmans Z Score: 5; and enough cash to pay current bills/quick ratio: 1.6).
Regardless of bottom predictions, I think there is a high chance the stock may reach $33 before a slight bounce. If the market flips for a bit, that "major crash" area ($20s) may be hit.
So, a starter position for NYSE:RHI has been created at $37.58 with additional entries near $33 and $25-$26.
Targets into 2028:
$46.00 (+22.4%)
$53.00 (+41.0%)
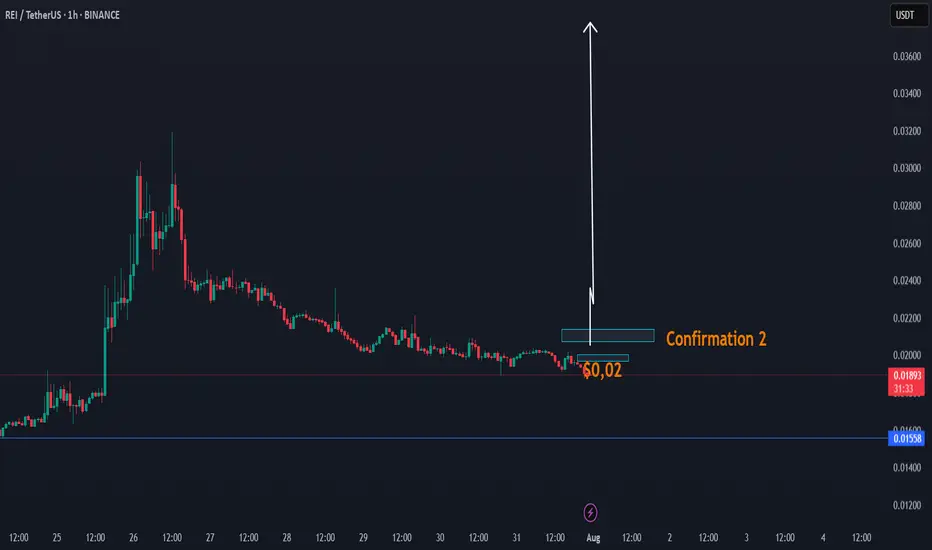
DAY UPDATE REI/USDT THE INCREASE CANDLE OF UP $0,03 - $0,05REI is an interesting coin since the update of Q4
We have seen that this coin was able to increase to $0,031 and until here $0,018 zone, a return to where we are now. There is a high chance that this coin can recover next 24H if this coin is able to confirm the confirmation $0,02 - $0,021
This coin, as before, was targeted at $ 0.02 and had low volume. We expect that if it comes back to $ 0.02, it will be confirmation of the volume, which can take the trend with a candle to up $0,03
REI CONFIRMATIONS ZONE
Higher time frame
When you look normally at this coin, then this coin is in a trend line of breakdown. This can change with the next confirmations. The question is, are we going to see again $0,02 the next 24h? If yes high chance of a break.
We also have a cycle update 2025, check it here, expecting $0,90
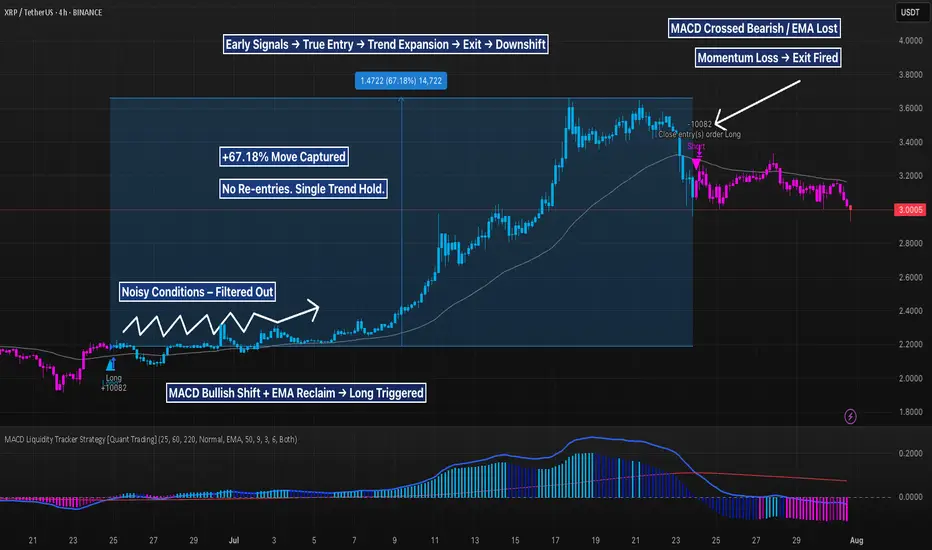
XRP 4H + 67% From MACD Trend Entry, But Is the Pullback Real?This XRP move was a masterclass in filtered momentum trading. The MACD Liquidity Tracker Strategy (Normal Mode) skipped early chop, then fired long once MACD aligned with a reclaim of the 60/220 EMAs — signaling a clean directional shift.
The strategy held through a +67.18% rally, exiting only when MACD flipped bearish and price lost EMA support. From ~$2.12 to ~$3.54, the move was captured in full with zero re-entries or second guessing.
Now price is under pressure, printing pink bars and sitting below both EMAs. The $2.90–$3.00 zone may determine if this is a healthy pullback — or the start of a reversal.
📊 MACD: 25 / 60 / 220
Trend Filter: 60/220 EMA
Mode: Normal | Timeframe: 4H
Educational chart. Drop your take.
GOLD & BTC analysisWe did a detailed analysis on Gold and BTC to have our directional bias and we kick off the month of August with a profitable setup.

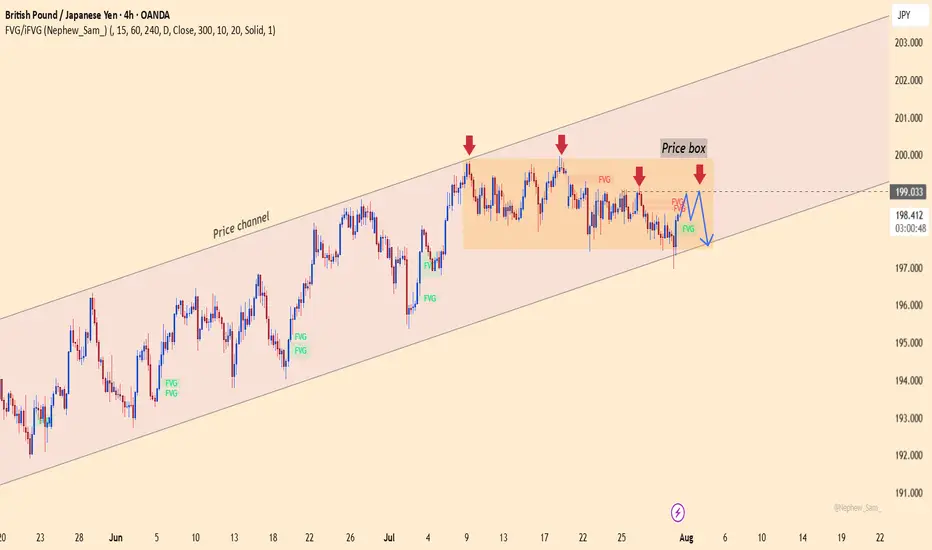
GBPJPY – Losing control zone, downtrend taking shapeGBPJPY is still trading within a long-term ascending price channel. However, what’s concerning is that recent price action has broken out of the previously established price box – which had acted as a stabilizing structure for the uptrend. Buyers failed to maintain momentum, repeatedly getting rejected at the top of the box.
Currently, GBPJPY is showing signs of breaking below the short-term support inside the price box, raising the risk of a deeper correction toward the lower boundary of the channel. A “lower high” structure is clearly forming, confirming that selling pressure is taking over.
From a news perspective, the Japanese yen is gaining strength as risk-off sentiment increases, while the pound is losing ground due to cautious tones from the Bank of England following a string of weak economic data. This shift is weakening GBP's appeal and could accelerate the bearish trend.
Strategy:
Wait to SELL if price pulls back to the former resistance zone within the price box and shows rejection signals. The downtrend will be confirmed if the recent low is broken. Stay out if there’s no clear confirmation.
What do you think will happen next with GBPJPY?
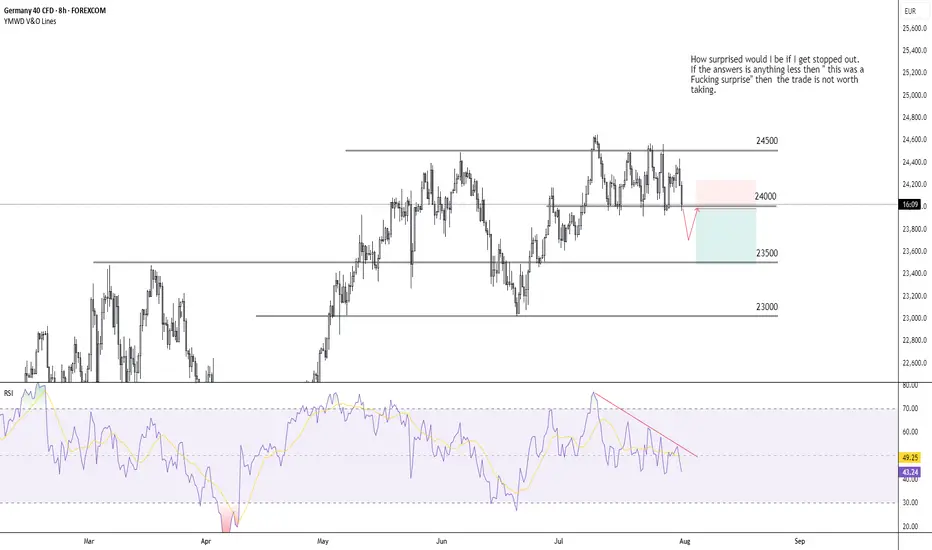
Down continuationDown continuation, 24000 level is strong but we will see. Would like to see a brake and retest on Fib level.
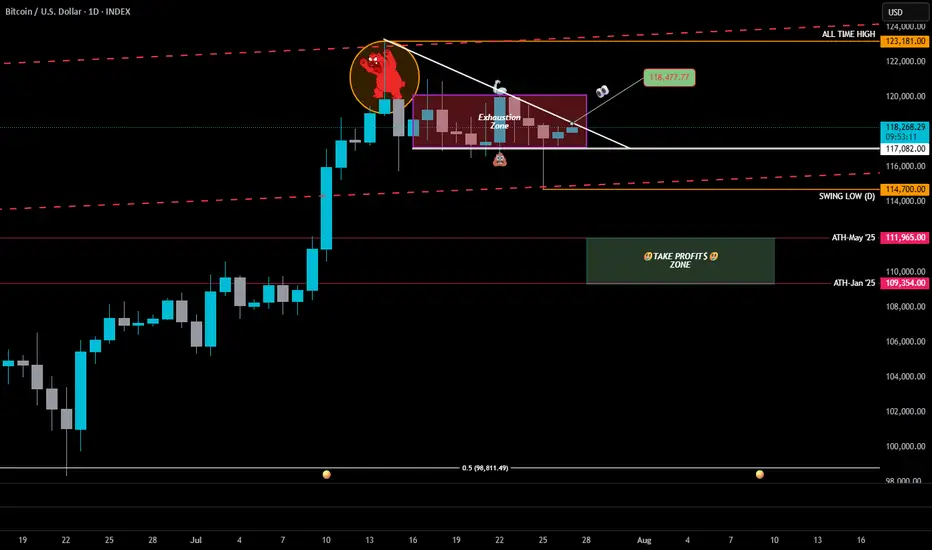
BTC Exhaustion Zone Update: The Bulls Charged… But the Zone HeldExhaustion Zone Update: 2025–208
📉 Exhaustion Zone Update: The Bulls Charged… But the Zone Held
On Friday, BTC dipped to 114,700, printing a fresh Daily Swing Low — a classic liquidity grab. The bulls stormed in for reinforcements, pushed price back up late in the day…
but once again, the Exhaustion Zone stood its ground.
BTC closed lower than Thursday, and since then? Pure chop.
Feels like both bulls and bears took the weekend off to watch Netflix.
—
🔻 The Downward Trendline Still Rules
Today, it’s simple: Bulls must close above 118,477.
That’s the trendline test — hesitation here, and the bears come clawing.
Usually I’d say, "give the bulls until Monday"...
but this year has shown us one thing:
🐋 The Whales Hunt on Sundays.
If the bulls don’t step up today, we might learn the hard way why it’s called the Exhaustion Zone.
—
📉 The Risk if Bulls Fail
BTC already gathered all the bulls it could down at the Daily Swing Low — and they’re tired.
If they can’t break out, the High-Powered Short Zone (dashed red lines) will take over.
The bears? Heavy. Angry. Overdue for a window jump.
🎯 Next floors down:
• May ATH → 111,965
• January ATH → 109,354
That’s the Take Profit$ Zone 👇
And honestly? I’m letting a small short position ride in case the evil whales take us all the way to the 50% level (98,811).
—
📌 The Alpha View
To the bulls: It’s showtime.
Either close above 118,477 today…
or the All-Time High Parade might just reroute — straight down the fire escape. 🐻🔥
TSLA Downtrend Deepens — Key Gamma Floor at $300.41. August 1TSLA Downtrend Deepens — Key Gamma Floor at $300.41 Now in Sight
🔍 GEX & Options Flow Insight (1st Image Analysis)
TSLA continues to grind lower, breaking multiple gamma supports and staying pinned near the $306–$307 zone. The GEX profile shows a clear negative gamma environment, which means dealer hedging flows can intensify moves in either direction — but right now, momentum remains firmly bearish.
* Call Walls & Resistance:
* 📍 $321.36 → 2nd Call Wall (64.81% GEX2)
* 📍 $325.00 → Call wall resistance
* 📍 $330–$332 → Higher gamma resistance, unlikely in current structure without a strong reversal
* Put Walls & Support Zones:
* 🛡️ $306.99 → Current price zone, already tested multiple times
* 🚨 $300.41 → Highest negative NET GEX / hard gamma floor
* 📉 Below $300 → Opens quick downside to $295–$292
* Volatility Insight:
* IVR 7.5, IVx Avg 52.9 → Low relative IV in the context of a trending move down
* Call flow 39.3% → Bearish tilt despite modest call activity
* GEX sentiment: 🔴🔴🔴 = Strong negative gamma → price more sensitive to continued downside flows
✅ Option Trading Suggestion:
Bias: Bearish until a firm reclaim of $311–$315
Strategy: Bear put spread
* Entry Idea: Buy 305P / Sell 295P (Aug 2 or Aug 9 expiry)
* Invalidation: Strong hourly close above $315
* Target: $300 → $295
Why this works: Negative gamma positioning increases the likelihood of a push to $300. If $300 breaks, option dealer hedging can exacerbate selling.
🧠 Technical Analysis (1H Chart) (2nd Image Analysis)
Market Structure & SMC:
* 🟥 Multiple CHoCH events confirming breakdown structure
* ❌ Lost prior BOS levels near $321, then $315, and now hovering above $306
* Trading firmly inside a downward-sloping channel
Trendline Dynamics:
* Well-defined descending channel from recent highs
* Lower bound points toward $300–$295 in coming sessions
SMC Zones:
* 🟩 Demand Zone: $300–$295 → Last defense before deeper drop
* 🟥 Supply Zone (Purple Box): $319–$325 → Major resistance cluster
🔄 Price Action & Key Levels
* Support:
* ✅ $306.99 → Current defense
* 🚨 $300.41 → Critical gamma floor
* 📉 $295 → Lower channel target
* Resistance:
* 🚩 $311.64 → First reclaim needed for relief
* 🚩 $319–$321.36 → Key supply & call wall zone
🧭 Scalping / Intraday Trade Setup
🟥 Bearish Setup (Preferred):
* Entry: Breakdown below $306
* Target 1: $300.41
* Target 2: $295
* Stop: Above $311
🟩 Bullish Reversal Setup:
* Entry: Reclaim of $315 with volume
* Target 1: $321
* Target 2: $325
* Stop: Below $311
🔁 Summary Thoughts
* TSLA remains in a clear downtrend with a negative gamma backdrop.
* $300.41 is the key gamma floor — holding it may see a short-term bounce, breaking it risks a fast flush to $295.
* Until bulls reclaim $315, all rallies remain suspect.
🚨 Disclaimer:
This analysis is for educational purposes only and does not constitute financial advice. Always do your own research and manage your risk accordingly.
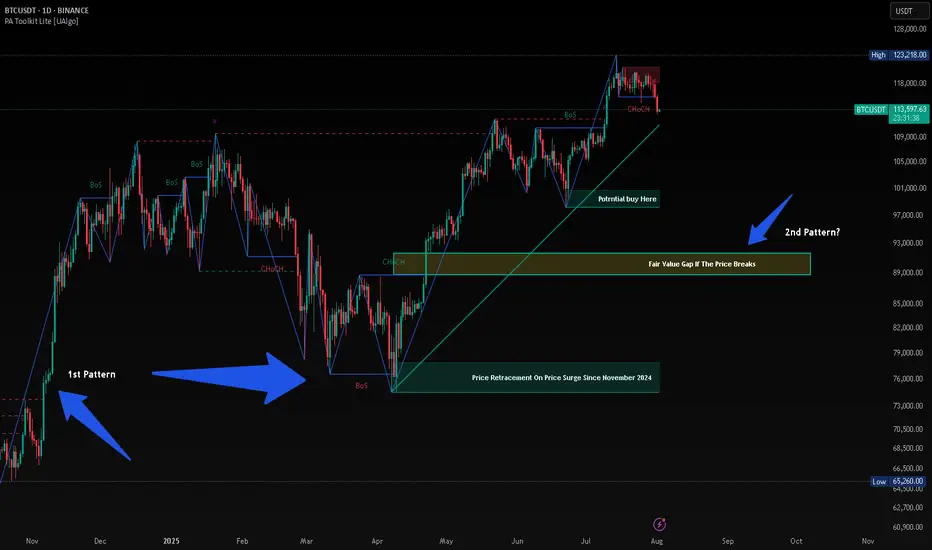
BTC HUNTS LIQUIDITYThis is just my opinion, BTC will hunt liquidity before taking new High. Since November 2024 after President Trump was elected, the price of BTC surge from $74,000 and retrace almost the same price on April 2025 after taking its new High. History will repeat itself and when history failed, there will be a long Bearish at least 90%.
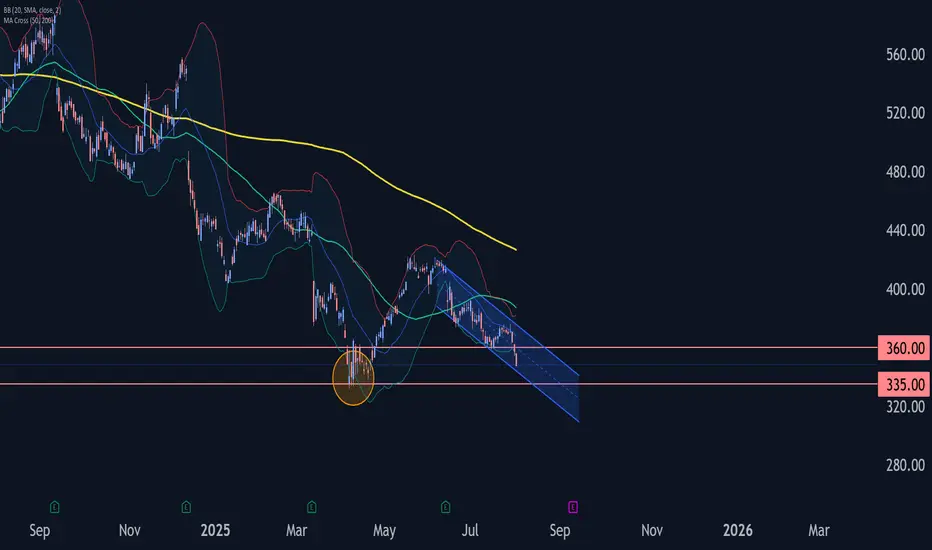
Adobe Wave Analysis – 1 August 2025- Adobe broke the key support level 360.00
- Likely to fall to support level 335.00
Adobe recently broke below the key support level 360.00 (which stopped the previous minor impulse wave i at the start of July).
The breakout of the support level 360.00 accelerated the active impulse wave C of the medium-term ABC correction (2) from the end of May.
Given the strong daily downtrend, Adobe can be expected to fall further to the next support level at 335.00 (the double bottom from April and the target for the completion of the active impulse wave C).
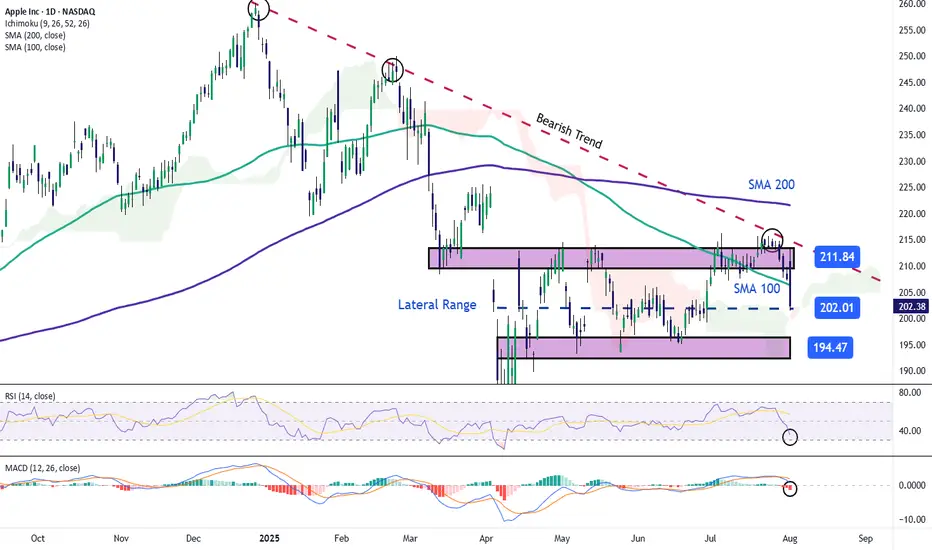
Apple Stock Falls Despite Strong EarningsApple stock is down more than 4% in the final session of the week, following the company’s earnings release yesterday. Apple reported earnings per share of $1.57, beating expectations of $1.43, while total revenue reached $94.04 billion, surpassing the $89.53 billion forecasted by the market.
However, despite the strong results, the stock is once again facing a notable short-term bearish bias as investor concerns grow. The primary issue is the perception that Apple is falling behind in the race for artificial intelligence, especially compared to its main competitors. In addition, shortly after the earnings announcement, it was noted that the company may face challenges in sustaining growth throughout the remainder of 2025, which has fueled additional downward pressure on the stock.
Sideways Range Emerges
In recent weeks, Apple’s price action has consolidated within a clear lateral range, with resistance around $211 and support near $194. So far, price fluctuations have not been strong enough to break this structure, and the latest bearish candlestick has reinforced the validity of the channel. For now, this sideways range remains the most relevant technical formation to watch in the upcoming sessions.
Technical Indicators
RSI:
The RSI line is falling rapidly and is now approaching the oversold zone at the 30 level. If the indicator reaches that threshold, it could suggest a technical imbalance, opening the door to a short-term bullish correction.
MACD:
The MACD histogram has moved into negative territory in recent sessions, suggesting a clear dominance of bearish momentum in the moving average structure. If this persists, selling pressure may continue to build in the near term.
Key Levels to Watch:
$211 – Main Resistance: Upper boundary of the current range. A breakout above this level could trigger a stronger bullish trend.
$200 – Psychological Support: Round number zone, a breakdown here could activate an immediate bearish bias for the next sessions.
$194 – Key Support: Corresponds to recent weekly lows. A move below this level would likely confirm a more extended bearish trend.
Written by Julian Pineda, CFA – Market Analyst
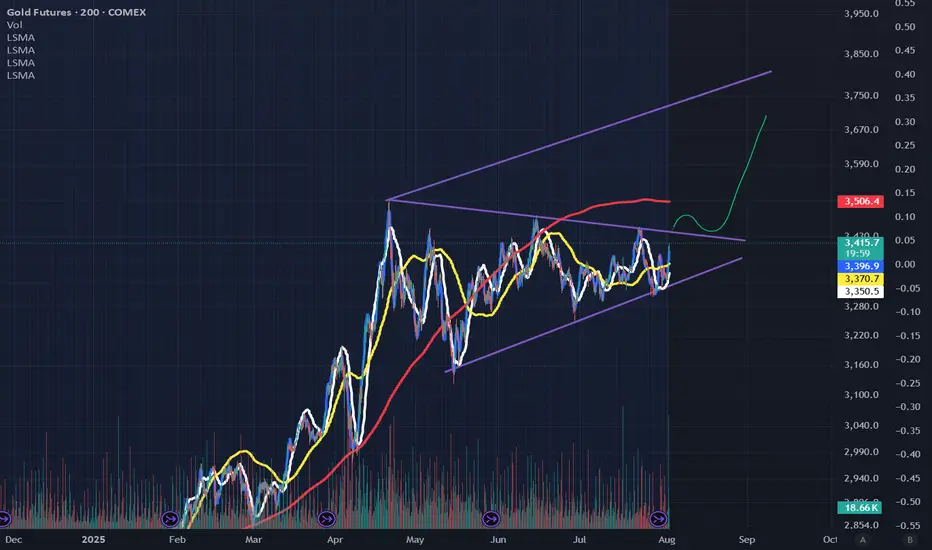
Gold completing a 4-month Bull Flag consolidation, 3800 next! We can see the classic bull flag consolidation pattern which has been going on ever since the stock market decided to go on a rager!
Even with that going on, smart money continues to buy gold on the dips as you should too.
Once Trump installs a phoney new BLS chief and moves to pressure the Fed by nominating a new governor after Kugler's departure the message will be clear:
1) the BLS and the Fed are no longer independent
2) the US dollar is going to tank
3) Gold is going to boom!
Good luck and happy trading!
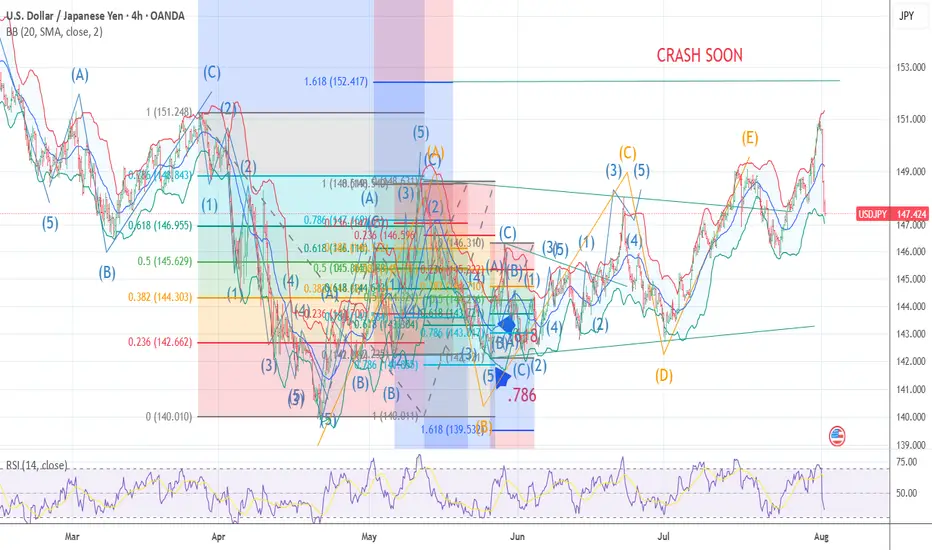
CARRY TRADE RISK IT IS SHOWING CRACKSThe chart posted in my work on TSXV:USS yen I have NOT CHANGED THE WAVE STRUCTURE AT ALL take notice of my statement CRASH COMING
Xrp - The final bullish breakout!💰Xrp ( CRYPTO:XRPUSD ) will create new all time highs:
🔎Analysis summary:
After a consolidation of an incredible seven years, Xrp is finally about to create new all time highs. With this monthly candle of +40%, bulls are totally taking over control, which means that an altcoin season is likely to happen. And the major winner will simply be our lovely coin of Xrp.
📝Levels to watch:
$3.0
🙏🏻#LONGTERMVISION
SwingTraderPhil
