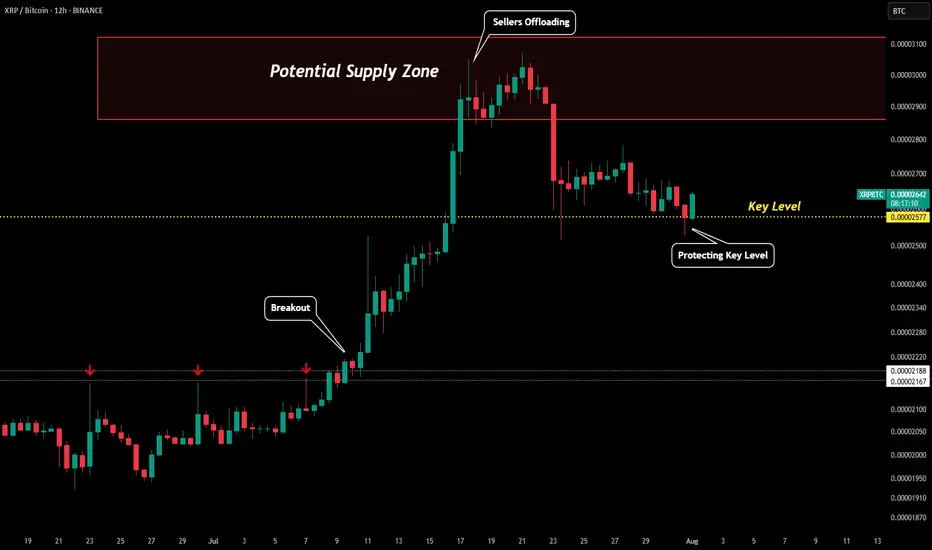
XRP/BTC - Perfect Prediction Please refer to our previous post:
After the XRP breakout we outlined that XRP/BTC was the most important pair to watch. Also, we outlined that the XRP/BTC pair was likely to push into our "potential supply zone" that ranges between around 0.0000285 and 0.000031.
This is exactly what happened with our XRP/BTC pair topping out around 0.0000307. Thus confirming resistance as sellers started offloading in this range. Once the pair broken down from the supply zone it tanked to our yellow dotted line "key level".
So far price has been respecting this key level with all candle bodies above. This has also been in alignment with the psychological $3 level. If XRP/BTC closes a 12H/1D candle body below the yellow dotted line the uptrend is likely not to stay in tact.
For now, with the pair respecting the yellow line a move back to test the bottom of our supply zone (0.0000285) is on the table.
Trend Analysis
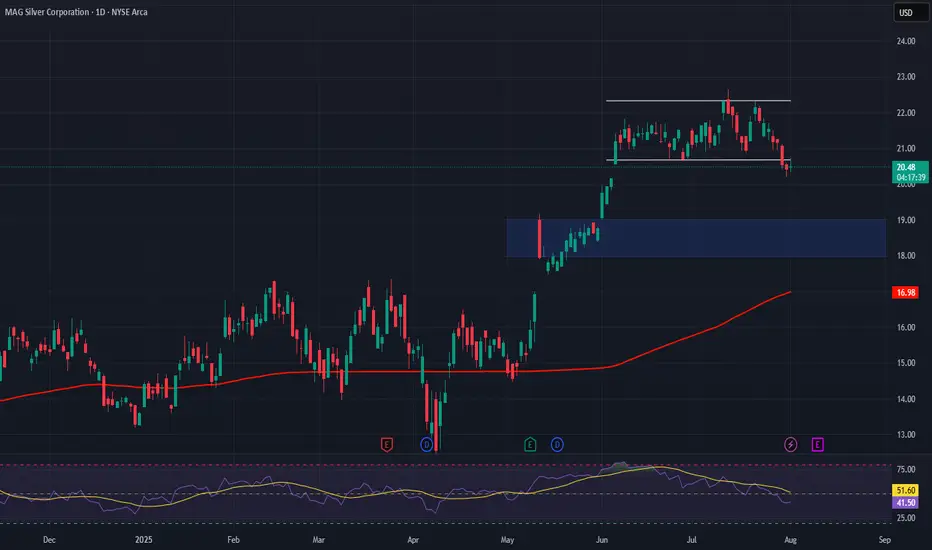
MAG Silver – A Pure-Play Winner in the Precious Metals RallyCompany Snapshot:
AMEX:MAG Silver is uniquely positioned as a high-beta play on silver and gold, with nearly all revenue tied to precious metals exposure—making it a standout in the current macro-driven metals bull run.
Key Catalysts:
High Leverage to Silver 🌐
With almost all income derived from silver and gold sales, MAG offers direct upside as investors flock to safe-haven assets amid inflation, rate uncertainty, and geopolitical risk.
Juanicipio Growth Engine ⛏️
Operated by top-tier partner Fresnillo, the Juanicipio project continues to scale efficiently, tapping into new high-grade zones that will further boost output and margins.
Financial Strength 💰
A debt-light balance sheet and healthy cash reserves give MAG financial flexibility, minimizing dilution risk and providing insulation during volatile market cycles.
Investment Outlook:
Bullish Entry Zone: Above $18.00–$19.00
Upside Target: $28.00–$29.00, driven by silver tailwinds, project scalability, and financial discipline.
🥇 MAG Silver stands out as a low-risk, high-reward name for investors seeking direct exposure to silver’s breakout.
#SilverStocks #Gold #MAGSilver #SafeHaven #PreciousMetals #Juanicipio #Fresnillo #CommodityRally #HardAssets #MiningStocks #InflationHedge #Geopolitics #MetalBulls
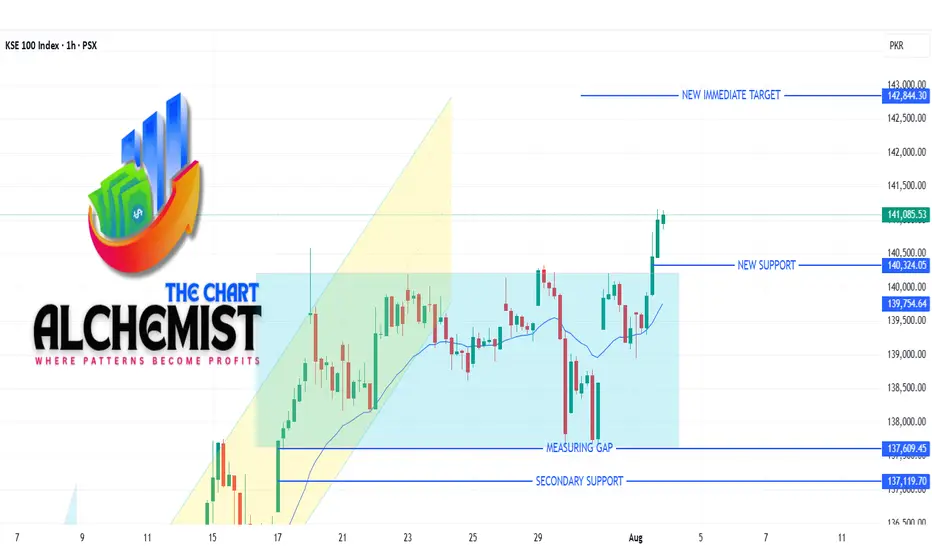
KSE 100 Technical Analysis 01-08-2025KSE 100 Technical Analysis | 01-08-2025
The KSE 100 index has formed a trading range between 136000 and 140200. After breaching the previous resistance at 13900, the index retested this level in the final hour of trading. We expect the index to rise from this level, cross the upper limit of the trading range, and move towards a new target.
Key Levels
- *Support*: 136000
- *Resistance*: 140200 (upper limit of the trading range)
- *Recent Breakout Level*: 139000 (successfully breached and retested)
Expected Movement
- Rise from current levels
- Breakout above 140200
- Target: 142775 (applicable after successful breakout)
Current Trend
- The index is still in a bullish trend, with potential for further upside.
2 Scenarios for BTCNow that the cup and handle formation has been reached and the correction finished, I think we have 1 more leg up.
It's also possible that we fall from here, but I think another fakeout upwards is likely as bearish divergence forms on the month, but isn't quite there yet (RSI needs 1 more higher high to confirm bearish divergence)
Either way, my short targets are the 0.618 fibs. I am expecting the typical -70-75% crash by 2027 before the next cycle begins

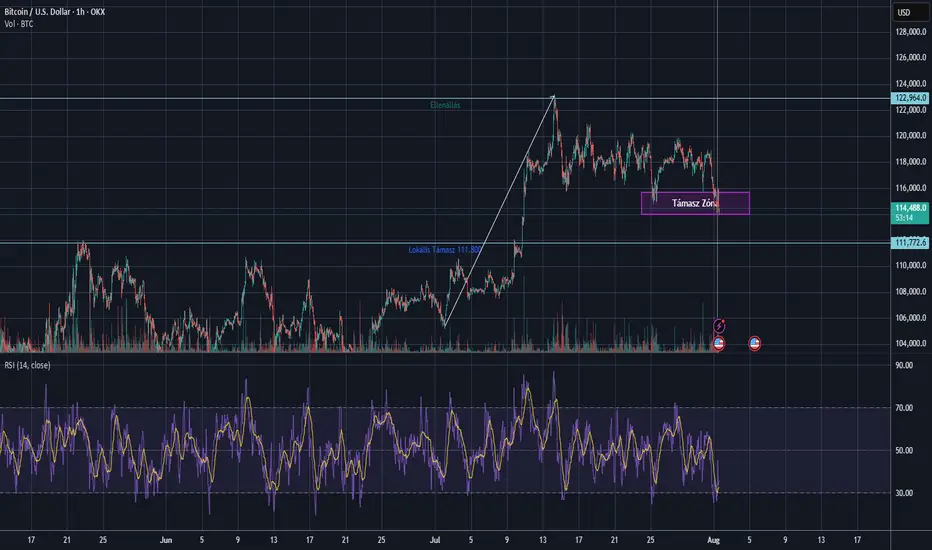
BTC Breaks Support – What's Next for Bitcoin?🧠 Bitcoin Technical Analysis – August 1st, 2025
📉 BTC/USD is under pressure, currently trading near $114,200, after dropping from the recent range highs. The chart shows a clear breakdown from a key consolidation zone between $114,000–\$115,500, marked as a crucial support zone.
🔍 Key Observations:
Major resistance remains at $123,000, where BTC topped mid-July.
A bullish trendline from early July has been broken — confirming momentum shift.
Local support sits at $111,800, a potential next landing zone if this breakdown continues.
The RSI (14) is now in oversold territory, below 30, signaling potential bounce or short-term relief — however, no bullish divergence is visible yet
---
🔎 Volume Spike & Momentum:
A noticeable volume spike has appeared alongside the breakdown, confirming strong selling pressure .
Short-term moving averages (e.g., 10 EMA) are now above price, adding to the b earish short-term bias.
🧭 Conclusion :
This region is critical for bulls — if BTC can reclaim the purple support box, it could invalidate the breakdown and trap aggressive shorts. Otherwise, \ $111,800 is the next area to watch for a reaction.
Let me know your thoughts below — Will this support hold or is \$110k next?
SILVER: Local Bullish Bias! Long!
My dear friends,
Today we will analyse SILVER together☺️
The recent price action suggests a shift in mid-term momentum. A break above the current local range around 36.920 will confirm the new direction upwards with the target being the next key level of 37.150 and a reconvened placement of a stop-loss beyond the range.
❤️Sending you lots of Love and Hugs❤️

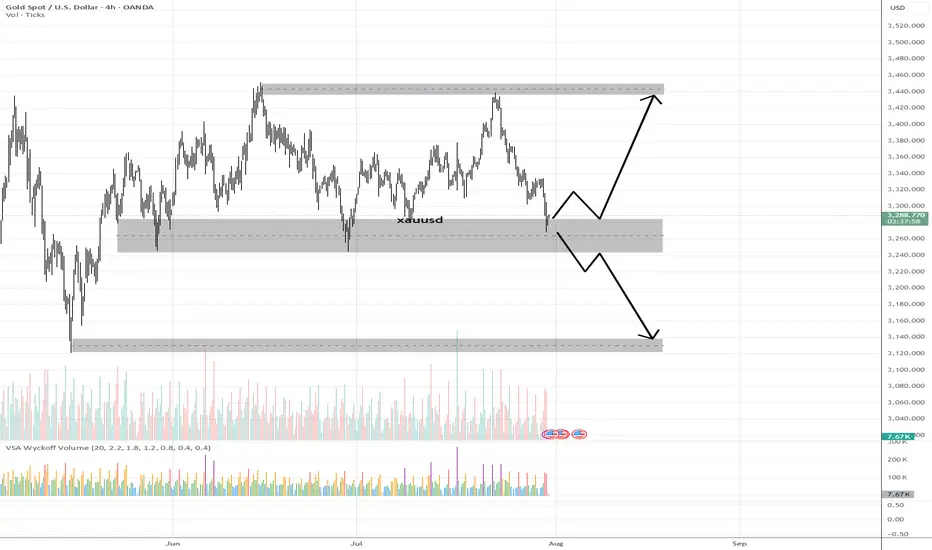
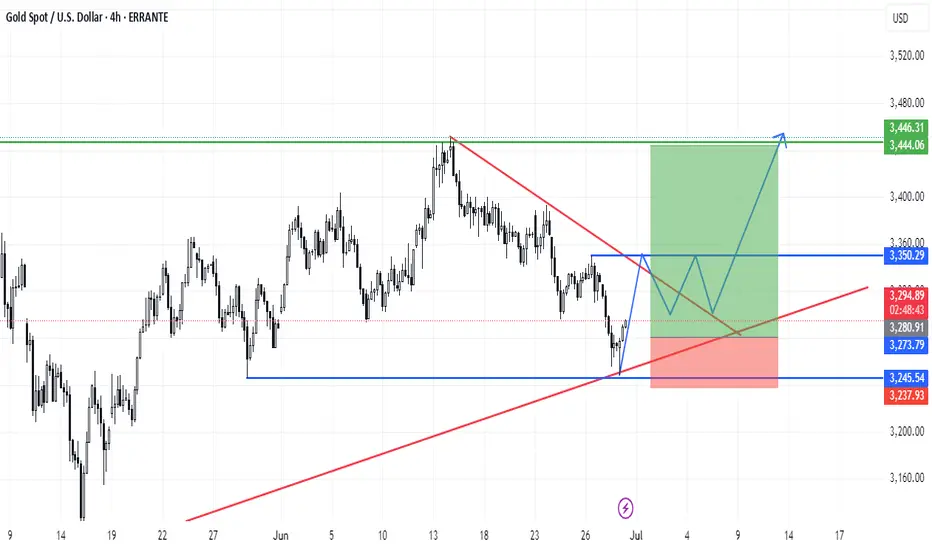
XAUUSD – Demand Zone Reaction & Potential Markup (VSA Analysis)💡 Idea:
Gold is testing a major 4H demand zone with early signs of smart money accumulation. VSA signals show supply exhaustion and potential for a bullish reversal toward upper resistance.
📍 Trade Setup:
Entry Zone: 3,265 – 3,285 (current demand zone)
Target 1: 3,380 – 3,400 (mid supply zone)
Target 2: 3,440 – 3,460 (major supply zone)
Stop Loss: Below 3,240 (to avoid false breakouts)
R:R Potential: ~3:1
📊 Technical Reasoning (VSA)
Stopping Volume Detected
On the recent drop into the demand zone, a wide spread down-bar on ultra-high volume appeared, followed by no further downside progress.
This is a classic stopping volume pattern where professional money absorbs selling pressure.
No Supply Confirmation
Subsequent candles inside the zone show narrow spreads on decreasing volume, indicating a lack of genuine selling interest.
Demand vs Supply Shift
Multiple attempts to break below 3,265 have failed, showing absorption of supply and positioning for markup.
If price rallies from here on increasing volume and wider spreads up, it would confirm demand dominance.
Structure Context
This demand zone has historically produced strong rallies.
Break above the minor resistance inside the zone could trigger a swift move toward Target 1, with momentum possibly extending to Target 2.
📌 Trading Plan:
Look for bullish confirmation bars with high volume before entry.
If price breaks below 3,240 on high volume, invalidate the long setup and watch for the next demand level around 3,140.
Partial profits can be taken at Target 1, and the remainder trailed toward Target 2.
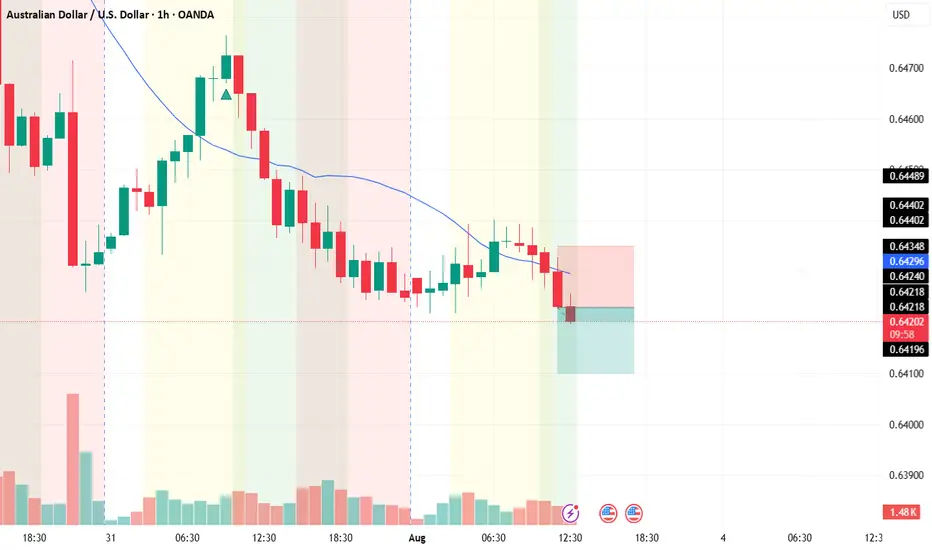
AUD/USDThis is a trade setup for AUD/USD, based on volume and trend analysis.
Entry Price: 0.64230
Stop-Loss (SL): 0.64350
Take-Profit (TP): 0.64100
The trade is intended to be executed instantly at the mentioned price, in alignment with both volume behavior and the current trend direction.
Disclaimer: This setup is shared purely for backtesting purposes and to document trade ideas. It is not financial advice. Always perform your own analysis before making any trading decisions.
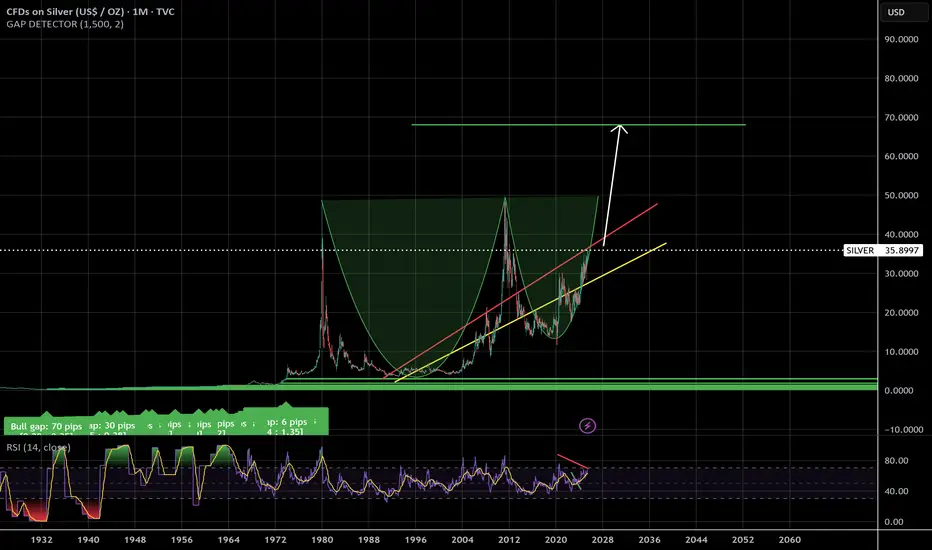
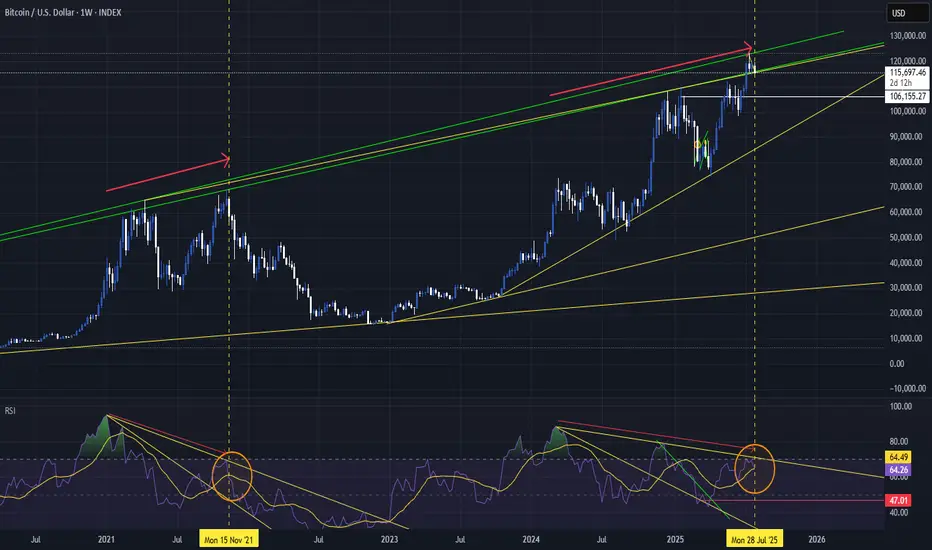
Could this be the end of the bull market? Caution requiredSo the green lines are the tops of the last 2 cycles.
We have wicked up to the top of the line, and got denied.
We have spent a week above the bottom GREEN line, suggesting that we want to hold it.
Weekly closes above the bottom line are an acceptance that the price is right and has movement potential to continue higher.
We can retest 106, hold above - and then see continuation higher. It is possible... but
IF you look at the RSI and compare to 2021, there is BEARISH DIVERGENCE that is clearly defined. This is a leading indicator, and often works out more than not.
We 100% need to get above the top yellow trend line to invalidate the bearish divergence.
Right now, RSI is testing the yellow moving average - this is the point last cycle where everything ended.
If price recovers, then i think we go higher (new ath again).
If Price does not, and RSI falls below the moving average, then i think its likely the bull cycle for btc is over..
BUT, its not all doom and gloom.
The RSI moving average has made a higher low, suggesting that the market is not finished its upwards momentum.
On a more fundamental understanding:
BTC has gone almost straight up from 16k to 121k. Its not healthy.
To get to higher highs, we need real adoption of btc.
I dont think BTC breaks and holds above 130k without some more kind of mainstream adoption.
We have institutional adoption - ETFS allow a constant buying pressure, pension funds have access to BTC now too! (I have a new btc exposed retirement annuity if anyone is keen... just dont think the % allowed is that reasonable at the moment).
Banks are starting to allow custody of BTC, meaning the average joe will be able to buy through their bank...
But i cant pay for my beers with btc, i cant use btc to settle debts with most merchants.
There is still more mainstream adoption to happen...
Countries are not piling into btc to make it a reserve asset in teh way i believe they will in teh future
The market will always move to hurt the most people.
Once everyone who wants to buy btc at the highs is done, then the price 100% will correct...
As btc matures, its volatility will drop. This means that the 80% retraces of the past are unlikely in my opinion.
There are big players wanting to buy for long term, this will make buy orders happen sooner than they have in the past.
As an indicator for the alt market - btc losing major psychological levels will create a risk off environment - aka more alt pain.
I had a look at the BTC.D, and on a quick inspection it looks like it could rise to even as high as 75%...
Which, as btc has a global use case as a store of value makes sense vs alt coins changing the world in the same time span.
If the price of BTC drops, alts will drop harder as they are riskier assets. Making BTC.D increase.
Alts are still close the lows, and they need a risk on environment to gain value.
The whole crypto market has changed compared to the old cycles.
Previously, the BTC believers would make huge money - and then at these peaks sell their btc to either tether and alt tokens.
This insane amount of money we received into the total market cap came from big institutions - blackrock etf etc, governments buying.
These players that made the money cant swop their btc to alt coins. They are locked into an etf where at most they can diversify into other traditional investments.
This is a real risk to total2+ receiving a real return...
But its not over, BTC will survive. We learn what we can to make sound financial decisions in the long term.
Stick with your long term plans. Dont but trash. Manage your risk. Manage your mental, dont be over exposed to risk when at the highs.
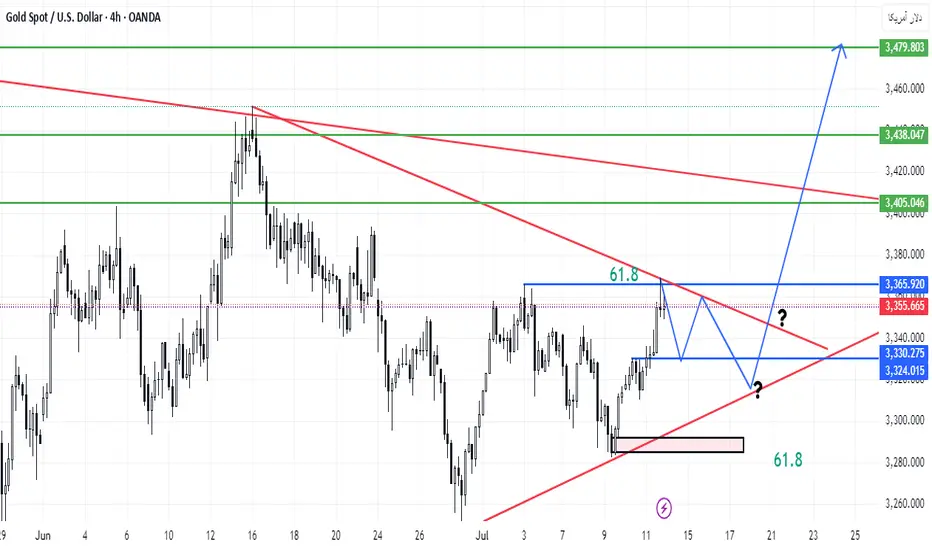
xauusdGold enters support by reaching daily trend line
If gold continues to hold support
Gold is expected to reach its previous high again
xauussWe will probably have a minor correction in this direction. We will wait for the trend line to break, if it breaks, the targets will be touched in order.
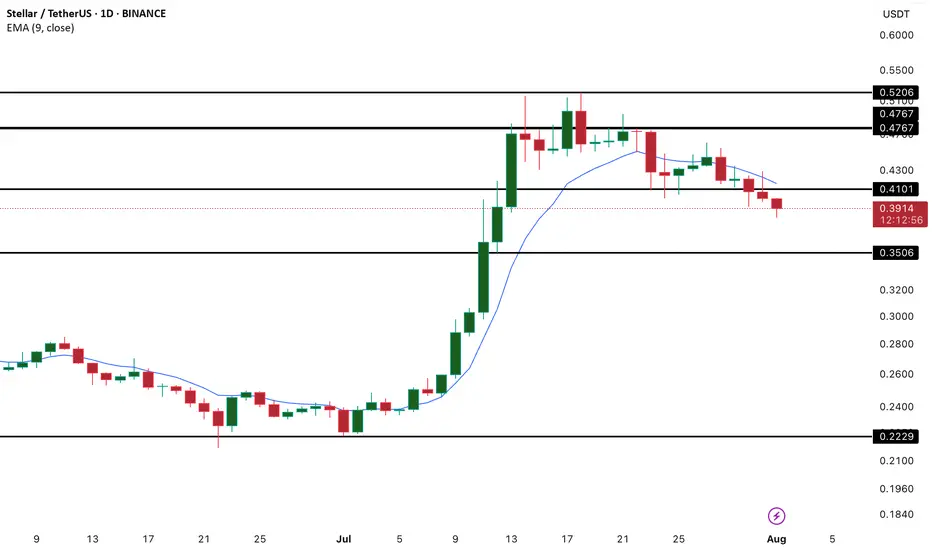
XLM/USD Analysis – Bearish Momentum Builds Below 20-Day EMA
XLM has taken a notable hit, with recent price action showing a sharp drop that has dragged the token below its 20-day Exponential Moving Average (EMA). Currently sitting at $0.40, the 20-day EMA now acts as a dynamic resistance level, capping potential upside in the short term.
This development signals a clear shift in short-term sentiment. The 20-day EMA, which reflects average pricing over the last 20 sessions with an emphasis on recent moves, typically supports bullish outlooks when the price remains above it. However, XLM's break below this level suggests growing sell-side pressure and a loss of bullish control.
With momentum weakening and bearish signals intensifying, traders may want to exercise caution, especially if the price fails to reclaim the EMA in the near term. Further downside could follow if buyers don't step in to reverse the trend.
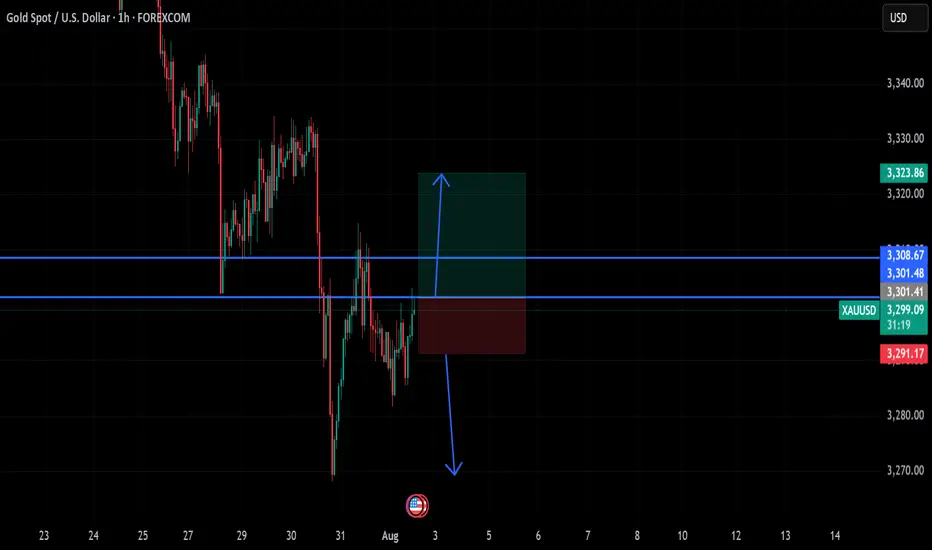
gold on third pattern breakout#XAUUSD have multiple test the third pattern, now price forming needs to breakout the 3308 before any further movement.
Buy entry 3301.4, TP 3308-3323.
Below 3291 holds a very strong bearish continuation, if breakout price will fall till 3269
XAUUSD Gold Trading Strategy August 1, 2025
Yesterday's trading session, gold prices recovered to the 3315 area and then continued to decrease to the 3281 area. Currently, gold prices are fluctuating quite unpredictably due to the impact of tariff news and investor confidence.
Basic news: The Federal Reserve FED continues to maintain the federal funds benchmark interest rate in the range of 4.25% - 4.50%, in line with policy since 2025. Chairman Powell did not give any signal about the next interest rate cut on September 16 - 17.
Technical analysis: After falling sharply to the 3269 area, gold prices are showing signs of recovery. In the current downtrend channel, there has been a higher bottom than the bottom at H1. We can see that if the bullish pattern at H1 is confirmed, combined with the reversal candlestick appearing at H4, the possibility of gold bouncing back to reach the resistance area of 3330, even 3350 is completely possible. In the weekend trading session, we will wait at the support zones to trade.
Important price zones today: 3280 - 3285 and 3269 - 3274.
Today's trading trend: BUY.
Recommended orders:
Plan 1: BUY XAUUSD zone 3283 - 3285
SL 3280
TP 3288 - 3300 - 3310 - 3330.
Plan 2: BUY XAUSD zone 3269 - 3271
SL 3266
TP 3274 - 3284 - 3300 - 3320.
Wish you a safe, favorable and profitable trading day.🥰🥰🥰🥰🥰

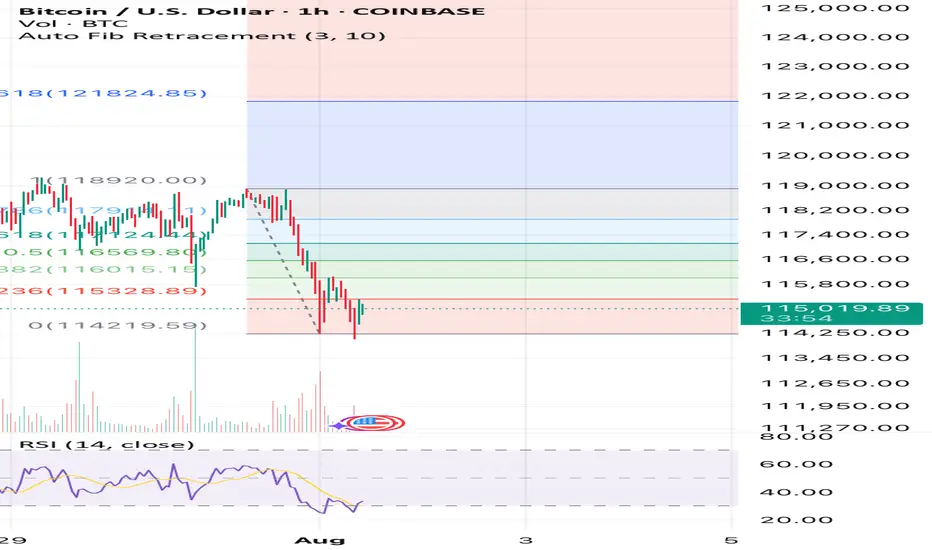
Bitcoin willIt hold if we stay above $115k ?? Fixing up last post I’ve deleted now as image was not good. Anyway simple RSI and Auto Fib Retrace with only general CRYPTOCAP:BTC market understanding backing this. This isn’t finacial advice at all. It’s pure speculation this post and anything related to it. I’m
Not a finacial advisor and I will not be held accountable for anyone’s actions that I didn’t do.
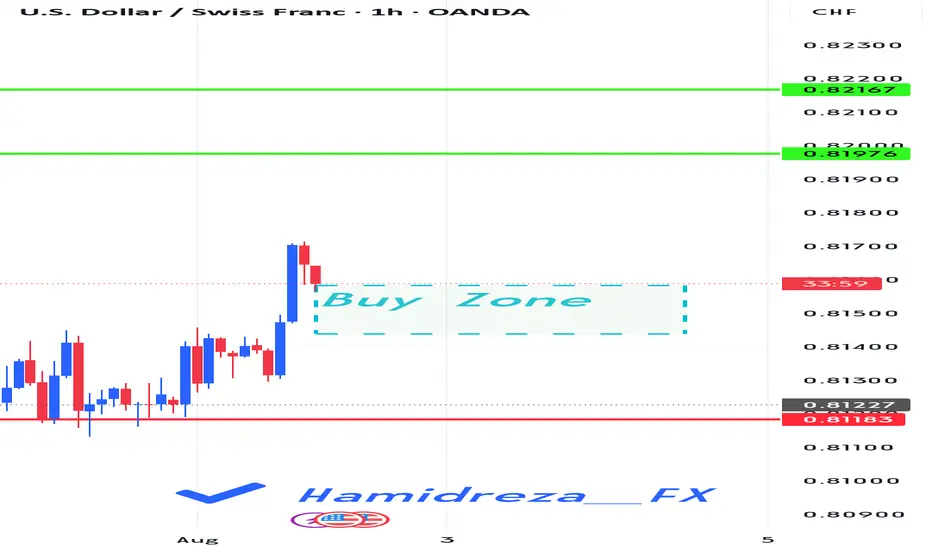
Will USDCHF remain bullish?
Hi dears
We are at your service with the analysis of the Swiss Franc against the US Dollar. It seems that we should continue to see the strengthening of the US Dollar. It is possible that we will see the growth of the African Dollar against the opposite currency pairs.
What do you think?
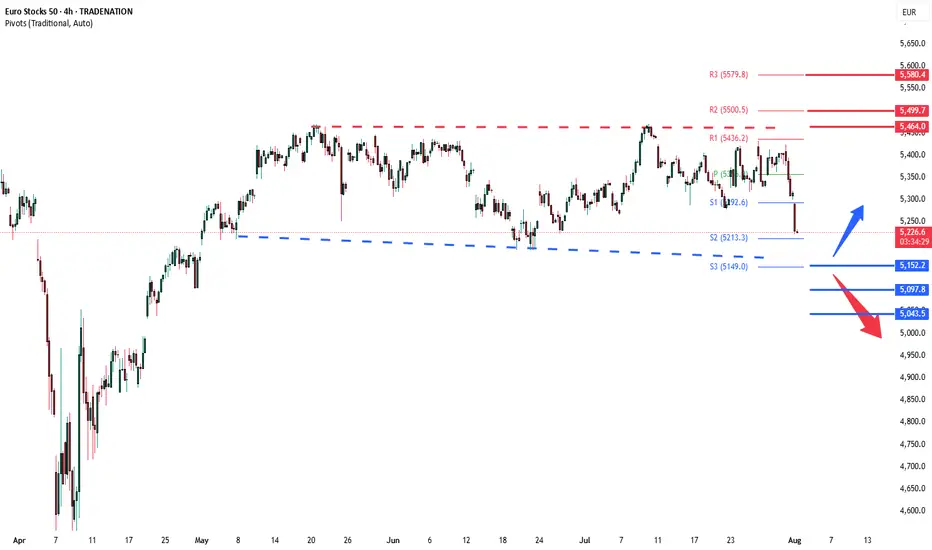
Stoxx sideways consolidation Key Support and Resistance Levels
Resistance Level 1: 5464
Resistance Level 2: 5500
Resistance Level 3: 5580
Support Level 1: 5152
Support Level 2: 5097
Support Level 3: 5044
This communication is for informational purposes only and should not be viewed as any form of recommendation as to a particular course of action or as investment advice. It is not intended as an offer or solicitation for the purchase or sale of any financial instrument or as an official confirmation of any transaction. Opinions, estimates and assumptions expressed herein are made as of the date of this communication and are subject to change without notice. This communication has been prepared based upon information, including market prices, data and other information, believed to be reliable; however, Trade Nation does not warrant its completeness or accuracy. All market prices and market data contained in or attached to this communication are indicative and subject to change without notice.
Classic Liquidity Trap on TRX -TRXUSDT-4HPrice hunted buy-side liquidity with a sharp fakeout move, trapping breakout traders.
After breaking structure (BOS) and forming internal liquidity, the short setup was confirmed.
Entry placed on the mitigation of the order block with clear risk defined above the fakeout.
Targeting sell-side liquidity for maximum R:R. Clean and calculated.

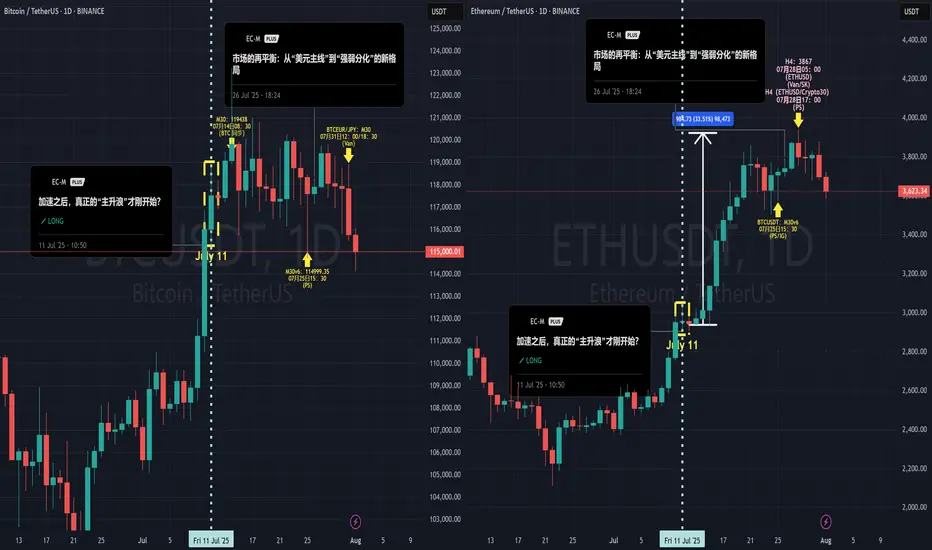
The Curtain Falls on the Script: Why I Believe It's Time to StopHello everyone, this is EC.
From late June through July, we experienced a full-fledged primary uptrend in crypto, driven by a weakening U.S. Dollar. From the script preview to the execution of the plan, every step has been clearly documented.
However, today, I want to share a different, more cautious perspective: I believe this script may be nearing its end.
I. Reviewing the Script and the "Bubble's" Manifestation
After our call on July 4th that the "main bull wave" was starting, the market perfectly delivered on our expectations. What was more interesting was the clear internal divergence we saw, which precisely confirms our thesis about the "bubble phase" from my June 20th article, "The Restlessness Before the Storm."
When the market's sentiment "balloon" is inflated to its limit, capital flows from the leader (BTC) to assets with higher elasticity (ETH).
The data shows that from July 11th until now, ETH took the baton and rallied approximately 35%, while BTC gained only around 6% in the same period. When BTC is already showing signs of fatigue while ETH is still in a solo rally, that in itself is a major signal that the bubble is nearing its end.
II. A Shift in the Winds: The Hand Inflating the Balloon is Loosening
I've chosen to end this script at this moment based on signal changes on two levels:
The "External Factor" Shift: The Potential Strengthening of the USD
As I pointed out in my July 28th analysis, "The Market's Rebalancing," the market has entered a phase of "strength-weakness divergence." This trend is now becoming more evident: the U.S. Dollar, cushioned by the extreme weakness of currencies like the Japanese Yen, has begun to show signs of a broad strengthening. Concurrently, U.S. and European stock markets are pulling back in sync, and global risk appetite is cooling.
The external environment that fueled the bubble (a weak USD) is beginning to falter.
The "Internal Factor" Signal: The Needle Point Inside the Balloon
The crypto market itself is also showing warning signs of resistance (see attached ETH daily chart). When the leading asset, ETH, begins to show signs of stagnation and distribution at its highs, it's like the balloon meeting the needle point. The exhaustion of internal momentum is a more direct warning than changes in the external environment.
III. Conclusion: Don't Be Greedy for the Last Dessert
When the core logic driving the rally (a weak USD) begins to waver, and the market simultaneously shows internal signs of exhaustion, my choice is to end this script and take profits off the table.
This doesn't mean I think crypto will crash immediately. But "no longer suitable to hold" implies that, in my view, the risk/reward ratio at the current level is no longer attractive. A grand feast is coming to an end, and being greedy for the last dessert is not a wise move. Shifting from "buying the dip" to "cautious observation" is the rational choice.
Thank you for your attention and for following along this past month.
#Crypto #BTC #ETH #TradingView #MarketAnalysis #RiskManagement
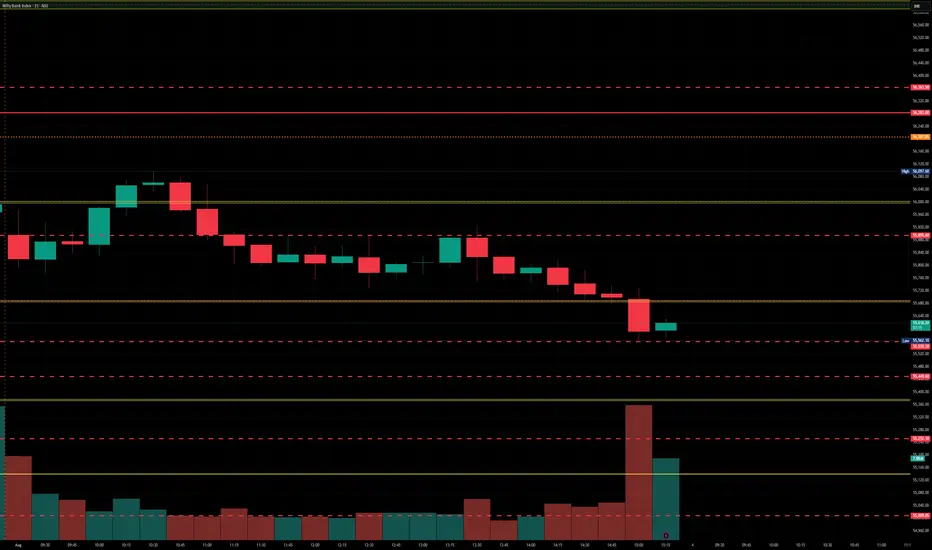
BankNifty levels - Jul 04, 2025Utilizing the support and resistance levels of BankNifty, along with the 5-minute timeframe candlesticks and VWAP, can enhance the precision of trade entries and exits on or near these levels. It is crucial to recognize that these levels are not static, and they undergo alterations as market dynamics evolve.
The dashed lines on the chart indicate the reaction levels, serving as additional points of significance. Furthermore, take note of the response at the levels of the High, Low, and Close values from the day prior.
We trust that this information proves valuable to you.
* If you found the idea appealing, kindly tap the Boost icon located below the chart. We encourage you to share your thoughts and comments regarding it.
Wishing you successful trading endeavors!
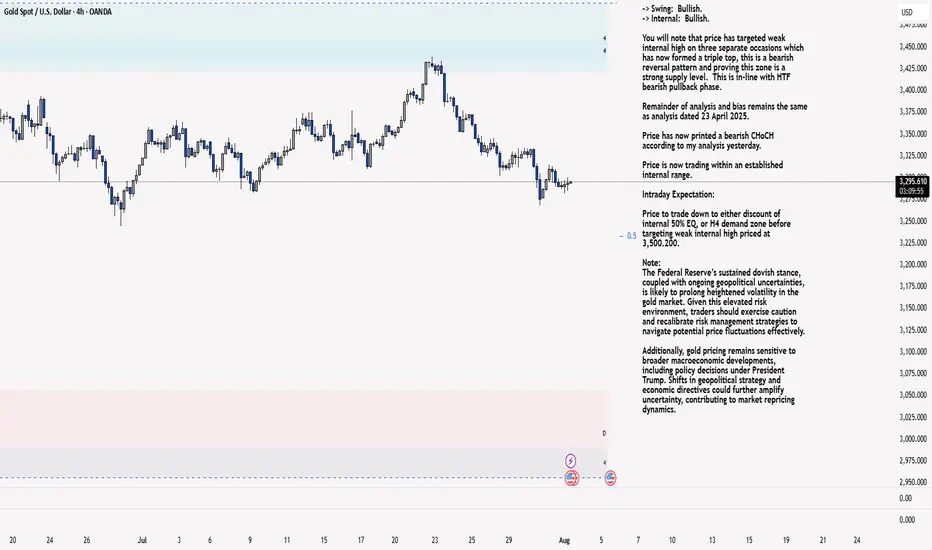
XAU/USD 01 August 2025 Intraday AnalysisH4 Analysis:
-> Swing: Bullish.
-> Internal: Bullish.
You will note that price has targeted weak internal high on three separate occasions which has now formed a triple top, this is a bearish reversal pattern and proving this zone is a strong supply level. This is in-line with HTF bearish pullback phase.
Remainder of analysis and bias remains the same as analysis dated 23 April 2025.
Price has now printed a bearish CHoCH according to my analysis yesterday.
Price is now trading within an established internal range.
Intraday Expectation:
Price to trade down to either discount of internal 50% EQ, or H4 demand zone before targeting weak internal high priced at 3,500.200.
Note:
The Federal Reserve’s sustained dovish stance, coupled with ongoing geopolitical uncertainties, is likely to prolong heightened volatility in the gold market. Given this elevated risk environment, traders should exercise caution and recalibrate risk management strategies to navigate potential price fluctuations effectively.
Additionally, gold pricing remains sensitive to broader macroeconomic developments, including policy decisions under President Trump. Shifts in geopolitical strategy and economic directives could further amplify uncertainty, contributing to market repricing dynamics.
H4 Chart:
M15 Analysis:
-> Swing: Bullish.
-> Internal: Bullish.
H4 Timeframe - Price has failed to target weak internal high, therefore, it would not be unrealistic if price printed a bearish iBOS.
The remainder of my analysis shall remain the same as analysis dated 13 June 2025, apart from target price.
As per my analysis dated 22 May 2025 whereby I mentioned price can be seen to be reacting at discount of 50% EQ on H4 timeframe, therefore, it is a viable alternative that price could potentially print a bullish iBOS on M15 timeframe despite internal structure being bearish.
Price has printed a bullish iBOS followed by a bearish CHoCH, which indicates, but does not confirm, bearish pullback phase initiation. I will however continue to monitor, with respect to depth of pullback.
Intraday Expectation:
Price to continue bearish, react at either M15 supply zone, or discount of 50% internal EQ before targeting weak internal high priced at 3,451.375.
Note:
Gold remains highly volatile amid the Federal Reserve's continued dovish stance, persistent and escalating geopolitical uncertainties. Traders should implement robust risk management strategies and remain vigilant, as price swings may become more pronounced in this elevated volatility environment.
Additionally, President Trump’s recent tariff announcements are expected to further amplify market turbulence, potentially triggering sharp price fluctuations and whipsaws.
M15 Chart:
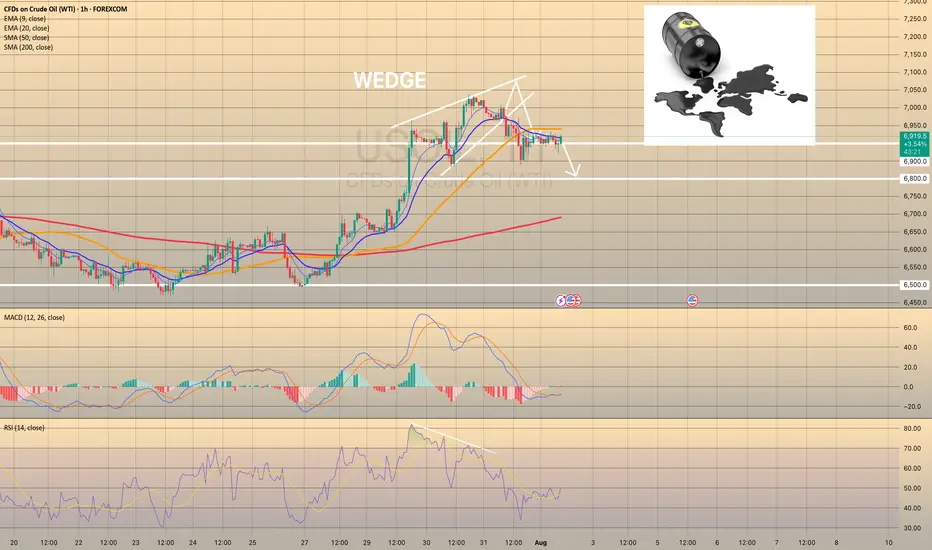
USOIL REACHED THE 6,900.00 SUPPORT LEVEL. WHAT'S NEXT?USOIL REACHED THE 6,900.00 SUPPORT LEVEL. WHAT'S NEXT?
As we told July 31, the price got reversed towards first support level of 6,900.00. Market participants are waiting for the OPEC+ meeting this week, expecting a significant output hike. Currently, the price sits slightly above the support level. Although, the asset trades above this level, considering the current weakness of the asset, further decline is expected. The 6,800.00 support level is the next target here.