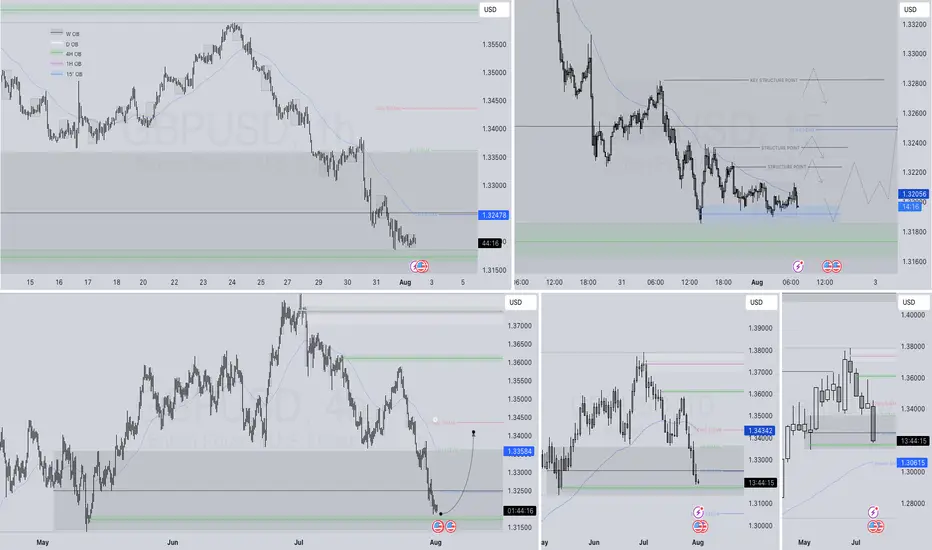
GBPUSD – DAILY FORECAST Q3 | W31 | D1 | Y25📊 GBPUSD – DAILY FORECAST
Q3 | W31 | D1 | Y25
Daily Forecast 🔍📅
Here’s a short diagnosis of the current chart setup 🧠📈
Higher time frame order blocks have been identified — these are our patient points of interest 🎯🧭.
It’s crucial to wait for a confirmed break of structure 🧱✅ before forming a directional bias.
This keeps us disciplined and aligned with what price action is truly telling us.
📈 Risk Management Protocols
🔑 Core principles:
Max 1% risk per trade
Only execute at pre-identified levels
Use alerts, not emotion
Stick to your RR plan — minimum 1:2
🧠 You’re not paid for how many trades you take, you’re paid for how well you manage risk.
🧠 Weekly FRGNT Insight
"Trade what the market gives, not what your ego wants."
Stay mechanical. Stay focused. Let the probabilities work.
FX:GBPUSD
Trend Analysis
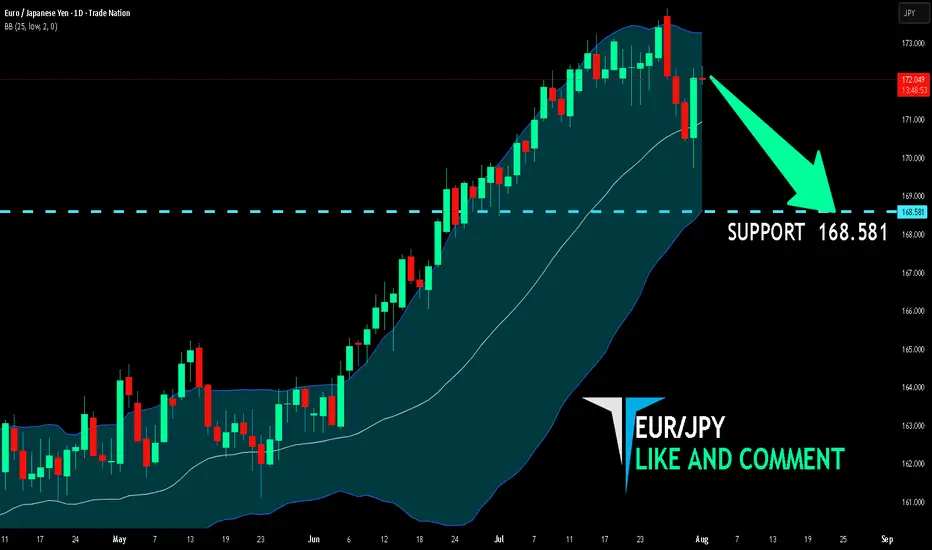
EUR/JPY BEARISH BIAS RIGHT NOW| SHORT
Hello, Friends!
We are now examining the EUR/JPY pair and we can see that the pair is going up locally while also being in a uptrend on the 1W TF. But there is also a powerful signal from the BB upper band being nearby, indicating that the pair is overbought so we can go short from the resistance line above and a target at 168.581 level.
Disclosure: I am part of Trade Nation's Influencer program and receive a monthly fee for using their TradingView charts in my analysis.
✅LIKE AND COMMENT MY IDEAS✅
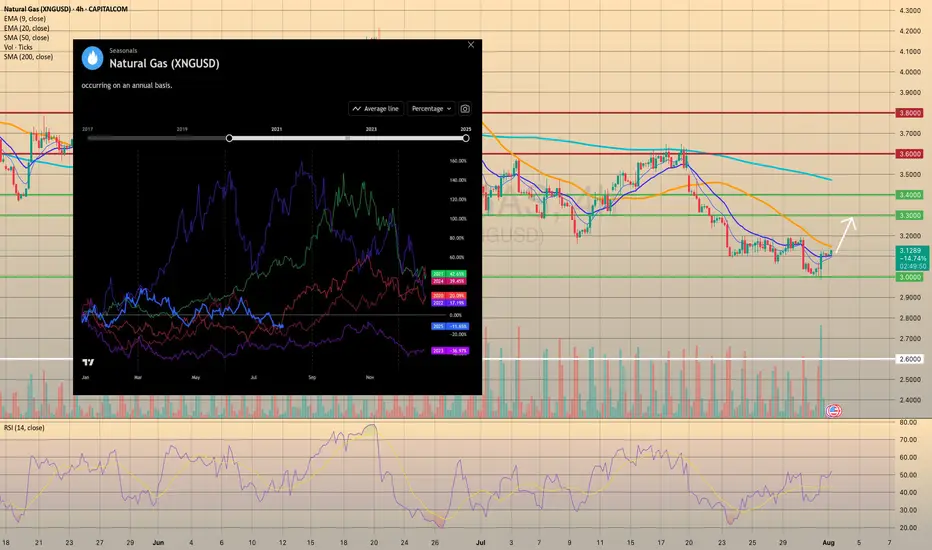
U.S. NATURAL GAS SUCCESSFULLY REBOUNDED FROM FIRM SUPPORT.U.S. NATURAL GAS SUCCESSFULLY REBOUNDED FROM FIRM SUPPORT.
Yesterday the natural gas storage report came out higher than expected. U.S. natural gas inventories increased by 48 billion cubic feet last week to 3,123 Bcf, increasing the surplus over the five-year average to 195 Bcf from 171 Bcf the week before, the EIA reports. The storage increase was bigger than the 24 Bcf average for the week, and above the 36 Bcf estimate. However, the price rised on 2.35% afterwards, supported by increased volume, which indicates the strength of the level. The upward movement towards the 3.3000 level is highly expected.
Additionally, seasonals suggest us that current prices may become the lowest till the end of the year. Historically, since August the natural gas prices increase in anticipation of a new heating season and higher energy demand (pic2).
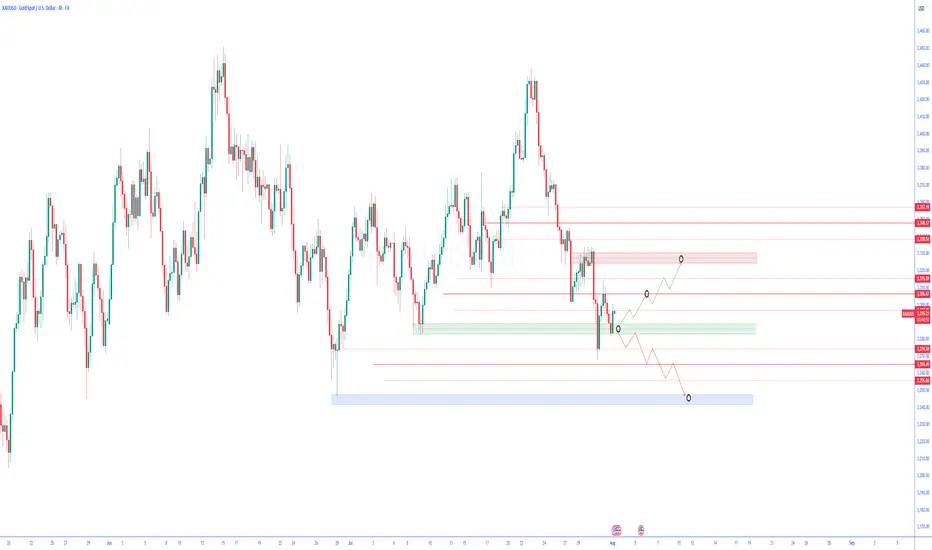
Technical Analysis of Gold Chart (XAU/USD) – 4-Hour TimeframeTechnical Analysis of Gold Chart (XAU/USD) – 4-Hour Timeframe
Following the heavy selling pressure seen in recent days, the price of gold has now reached a zone that has repeatedly shown reactions in the past. This green-colored support area can currently play a decisive role in the market’s next move.
Price Movement Outlook:
Scenario 1 – Bullish Correction Move:
If buyers manage to take control of the market in this zone, it is expected that gold will gradually pass through intermediate resistance levels and first enter the medium-term resistance area. If momentum is maintained, the price could then move toward higher highs. This move can be interpreted as a technical correction against the recent bearish wave and may attract short-term traders until reaching strong supply zones.
Scenario 2 – Continuation of the Downtrend:
Conversely, a confirmed break of this support with high volume and strong bearish candles could lead to a further decline in price toward previous lows. In this case, the blue-colored area at the lowest part of the chart would serve as the next demand zone.
Key Point:
The market is currently in a decision-making phase. Confirmation of reactions at this support area is extremely important in determining the market’s future direction. Therefore, entering the market prematurely without waiting for confirmation of price behavior could involve high risk.
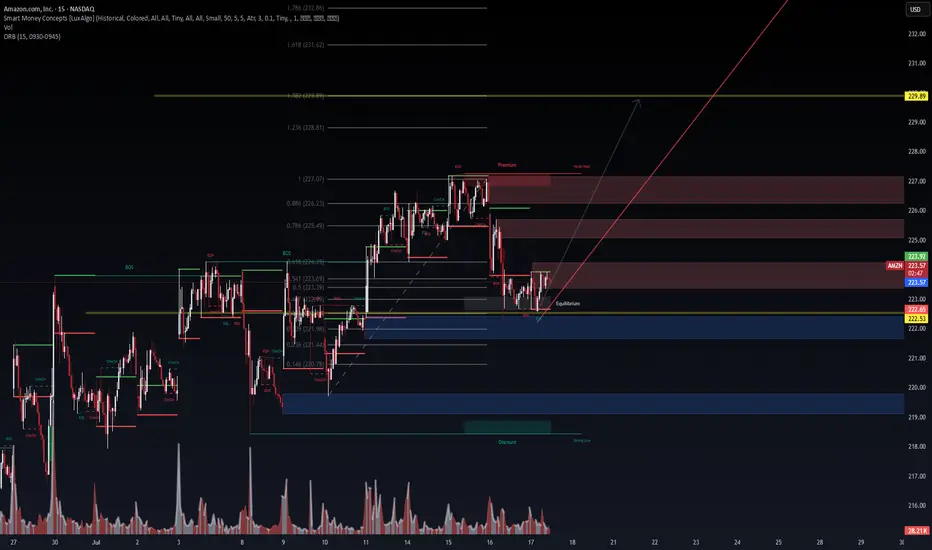
AMZN 15m – Institutional Demand Reclaim in Progress | VolanX Pro📈 AMZN 15m – Institutional Demand Reclaim in Progress | VolanX Protocol Alert
Amazon (AMZN) is staging a potential bullish reversal from a deep discount zone following a strong rejection near the 0.146–0.236 Fibonacci confluence at ~$220.78–221.44. We are now consolidating near the equilibrium zone (223) with signs of early accumulation.
📊 Technical Thesis:
Break of Structure (BOS) at 223.92 sets short-term bullish intent.
Reclaiming the ORB high and equilibrium.
Price rejected from deep demand (blue zone) and now printing EQH + BOS microstructures.
Premium liquidity sits above 227–229, with a magnet at FIB extension 1.618–1.786 = 231.62–232.86.
Volume profile shows declining sell pressure post-demand sweep.
📌 Key Levels:
Support: 222.53 | 221.44 | 220.78 (deep value zone)
Resistance: 226.23 (0.886 FIB) → 229.89 (FIB target zone)
Smart Money Premium: 226.5–229.8
🧠 VolanX Protocol Bias:
This is a long-biased setup, favoring institutional reaccumulation. If AMZN maintains above 223 with volume absorption, we anticipate a liquidity sweep through the premium zone, targeting 229.89.
🎯 Probabilistic Targeting:
60% → Retest 226.23 (EQH magnet zone)
30% → Breakout and reach 229.89 (measured move)
10% → Breakdown below 222.53 invalidates the setup
⚠️ Risk Note (VolanX Standard):
This post reflects strategic technical modeling, not financial advice. Trade your own system. View this as a signal integrity alignment, not a directive.
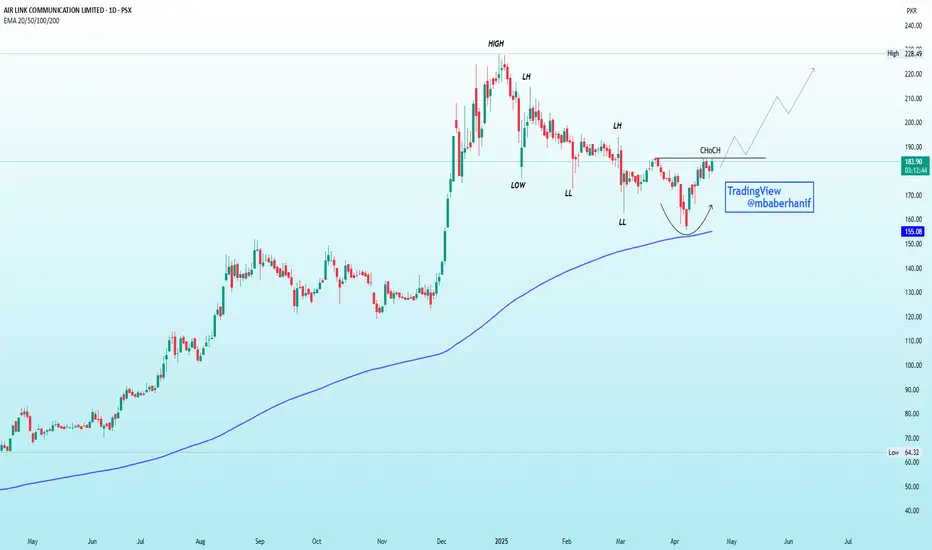
AIRLINK | An Imminent Reversal!!!Previous Trend: Bearish, confirmed by Lower Highs (LH) and Lower Lows (LL).
CHoCH (Change of Character): Bullish signal—price broke previous LH.
Pattern: Rounded bottom forming near the 200 EMA (~155), acting as strong support.
Volume: Slight pickup near bottom—early sign of accumulation.
Outlook: Bullish reversal likely. Break above CHoCH with volume confirms uptrend.
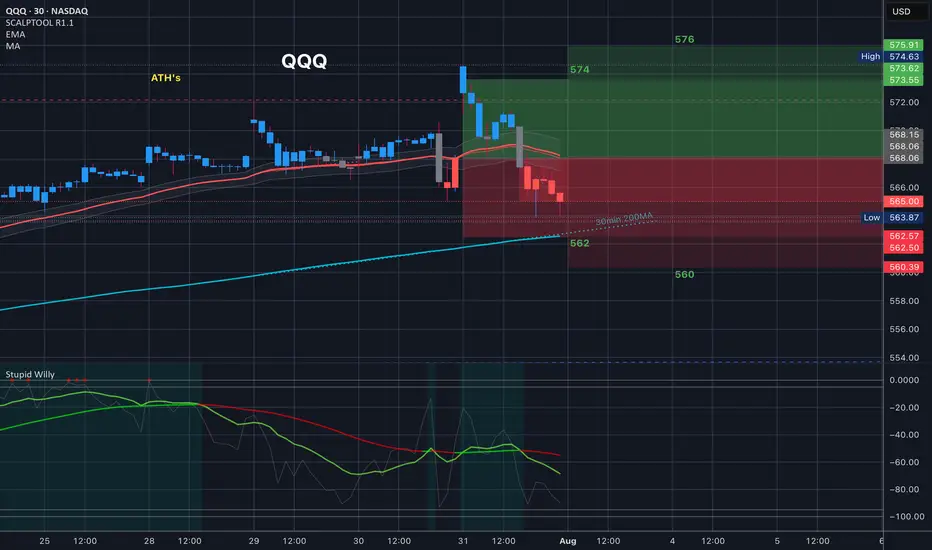
$QQQ Analysis, Key Levels & Targets574/576 Bear call spreads at open? Yes please. You know that those filled for 1.00 risk/1.00 reward - it was glorious.
Closed up 100%
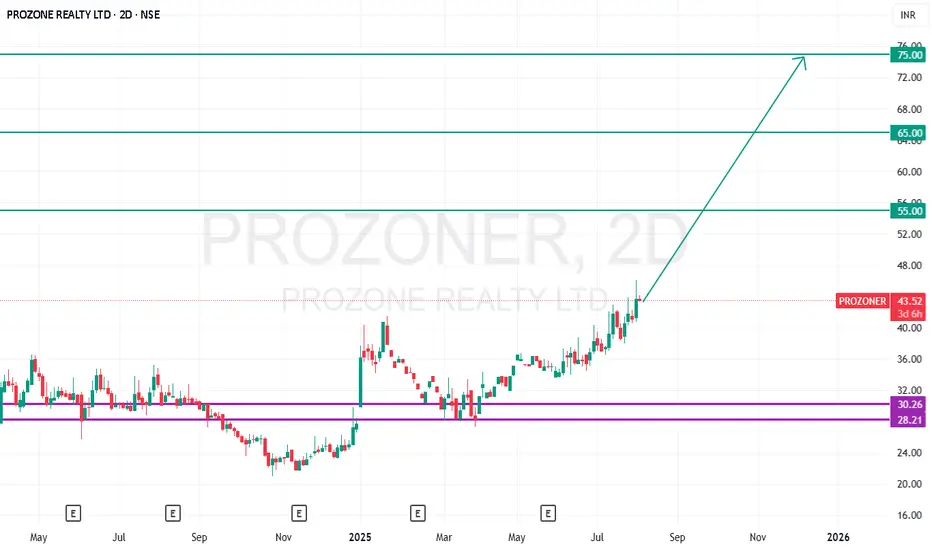
Prozone Realty - Long*Prozone - CMP - 43.40 / Positional Trade*
*Buy Range 41 to 44 ONLY / Stop Loss 36 in weekly candle closing*
*Target 1 - 55*
*Target 2 - 65*
*Target 3 - 75+*
Disclaimer: This is my view and for educational purpose only.
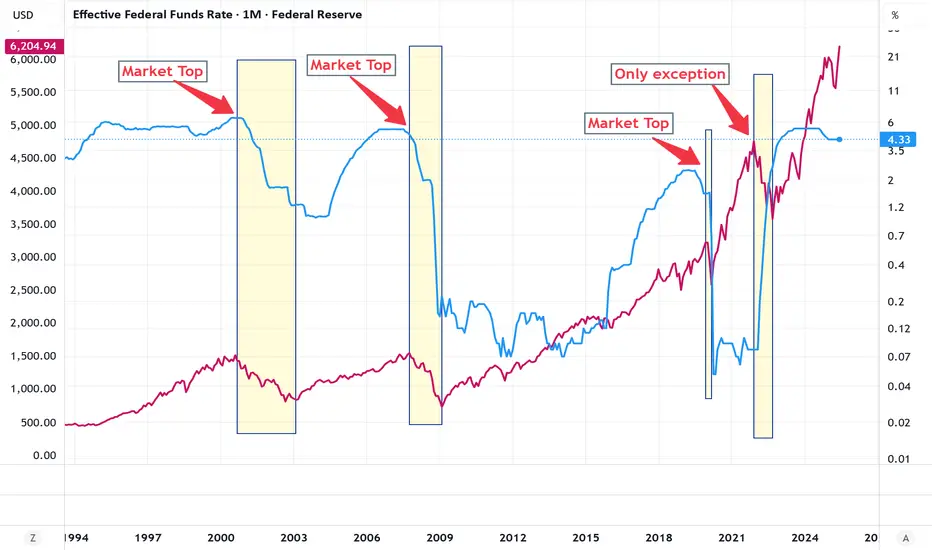
When the Fed cuts rates, it's bad news for Markets SPXIn 2000, 2007 and 2020, the markets crashed when the Fed started cutting rates or 1-2 months after.
Sell your stocks and crypto close to the time the Fed starts cutting rates.
History will repeat.
ATAI Bulls break to weekly higher highsNASDAQ:ATAI Bulls break to weekly higher highs, making 3.06 Monday's low now THE most important support level going forward.
Support: 4.04, 3.66, 3.61
Resistance: 4.29, 4.52

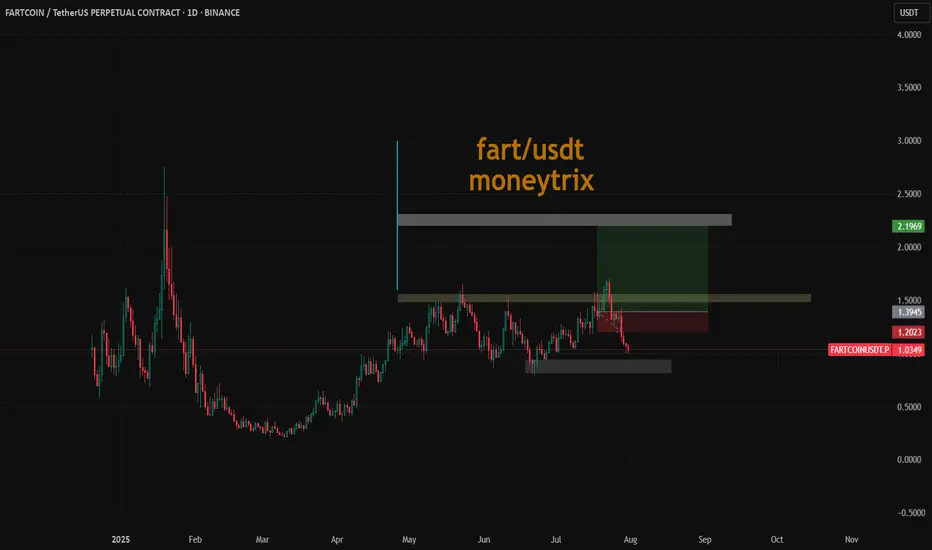
fart long entry soon as per analysisits not afinancial advice #dyor
evry thiong is mentioned on chart as u can see clearly
and this is strongly bullish until turn this below order block to breaker blok with heavy volume
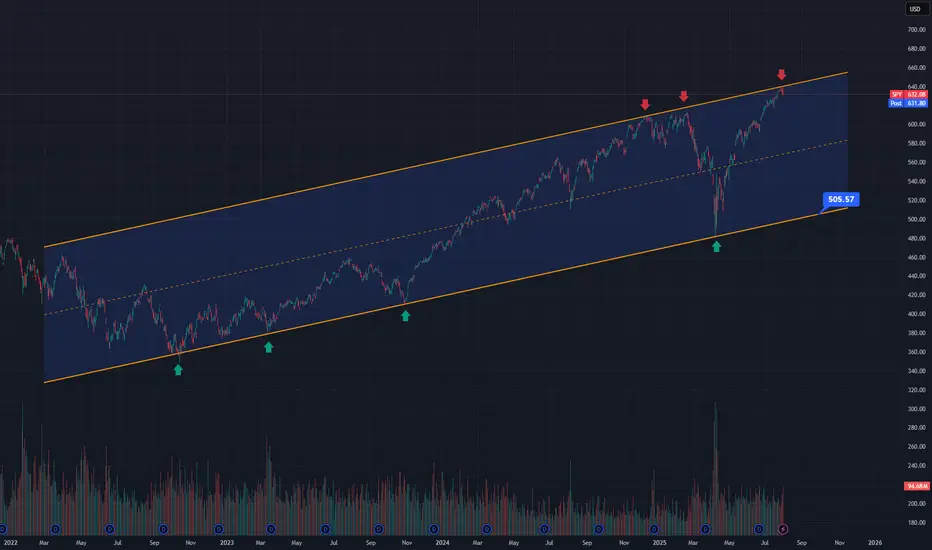
Next Leg down startingThe S&P 500 has been trading inside this rising channel for the last 3 and a half years. As you can see it has bounced off the bottom of the rising channel 4 different times and it is now back at the top of the channel. Price action gapped above the channel overnight but immediately sold off pre-market back inside the channel and completely reversed the move despite strong earnings from MSFT and META. This is very bearish and signals a move back down to the bottom of the channel once again and given that its already bounced off the bottom of the channel 4 different times, a 5th hit would have a high probability of breaking below the channel, which I would give a greater than 70% probability of playing out. If this happens, we will see much lower prices in this coming bear market.
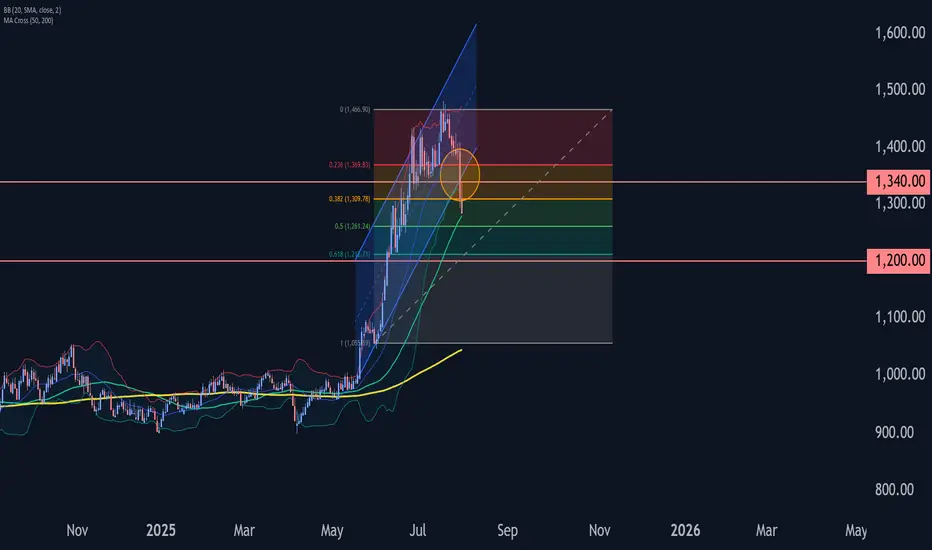
Platinum Wave Analysis – 31 July 2025- Platinum broke support zone
- Likely to fall to support level 1200.00
Platinum recently broke the support zone located between the key support level 1340.00 (low of the previous minor correction iv) and the support trendline of the daily up channel from May.
The breakout of this support zone accelerated the c-wave of the active ABC correction 4.
Given the bearish sentiment across the precious metals markets, Platinum can be expected to fall to the next support level 1200.00 (target for the completion of the active wave c).
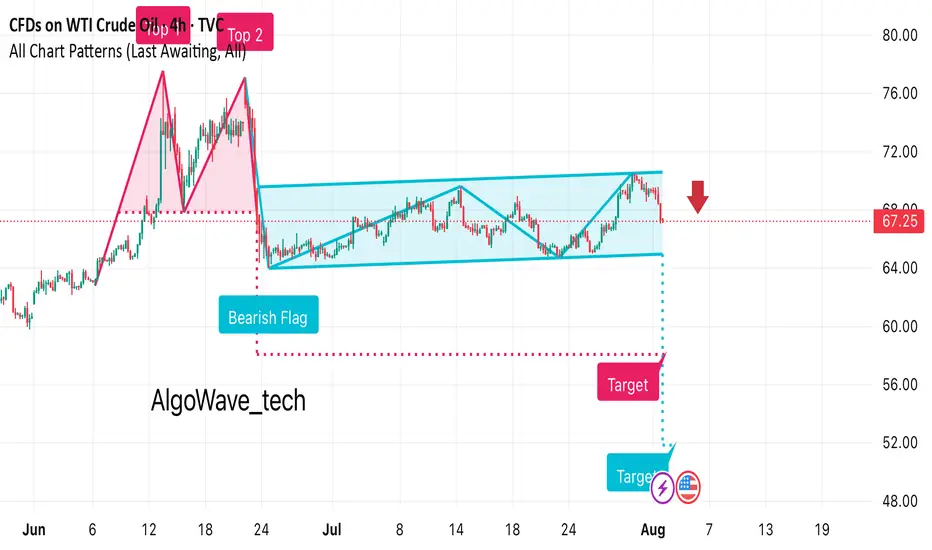
It looks like this chart for WTI Crude Oil is showing a bearish • Previous Move: There’s a strong downward leg before the flag formation, indicating bearish momentum.
• Flag Pattern: Price consolidates in an upward-sloping channel after the drop.
• Breakout: The chart suggests a bearish breakout below the channel, marked with a red arrow at around $67.25.
• Target Projection: The measured move target appears to be around the $53–54 range, based on the flagpole height.
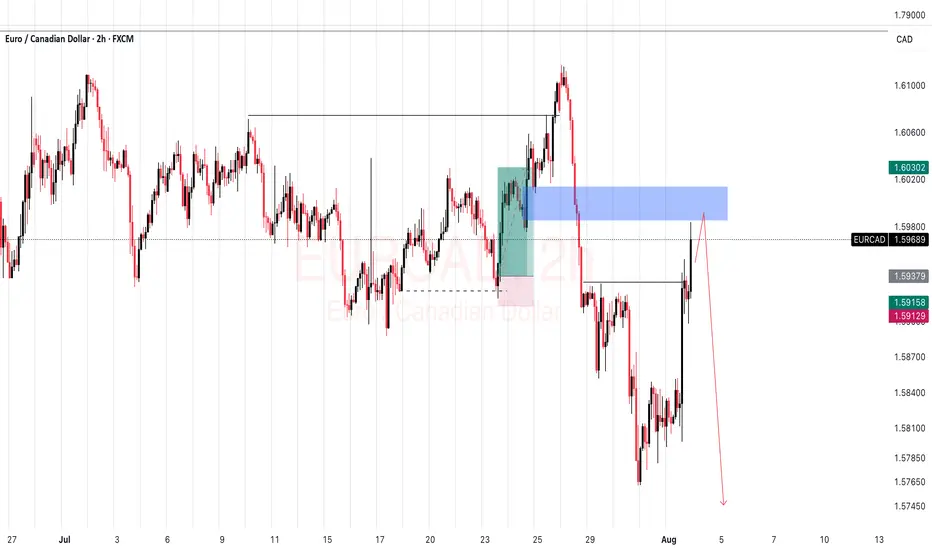
EURCAD SELL SETUPWe should see continuations on this EURCAD to the down side from this breaker blck by next week
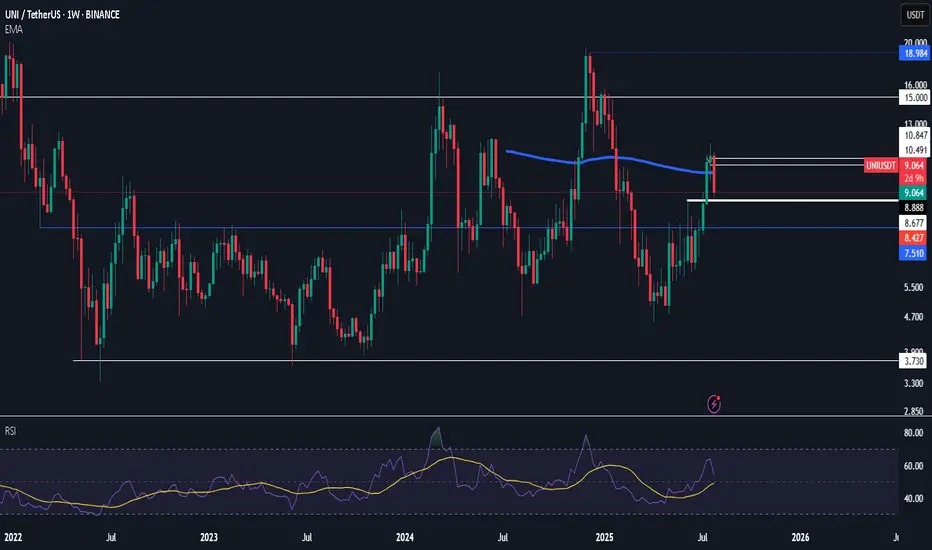
$uni stop a tad below white thick line
may or may not reverse this move by monday for now longing it and expecting dominance to roll over
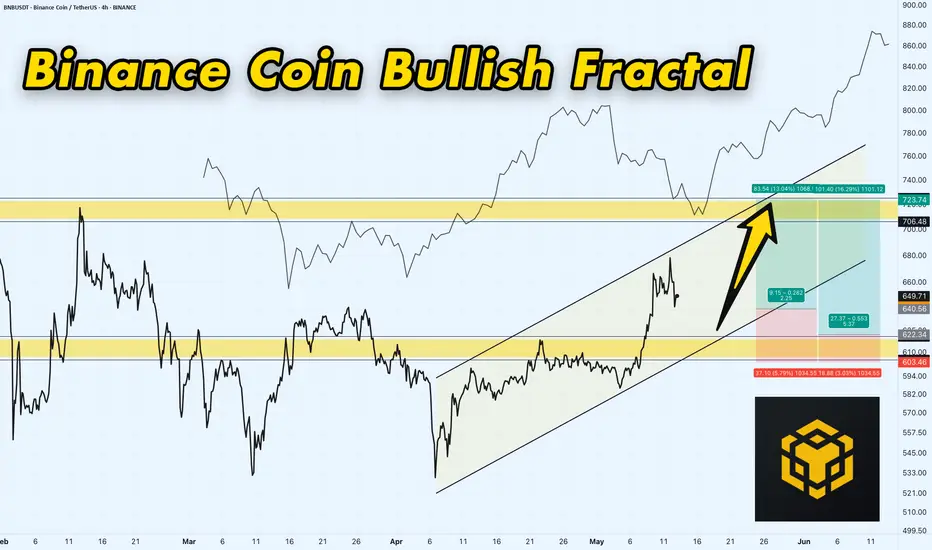
BNB/USDT 4H Chart: Rising Channel with Fractal Vibes!Hey traders! Binance Coin is showing some promising action that’s got me on the edge of my seat!
We’ve got a clear rising channel in play, with BNBUSDT moving beautifully in sync with a fractal line pattern shown above the chart — mirroring past price behavior like a roadmap! BNBUSDT is currently trading at $650 , I think price will continue bouncing between the channel’s support at $620-$600 and move upwards to the key resistance target at $700-$720 . A breakout above this resistance could send BNB soaring to new highs, potentially targeting $800 or beyond!
However, if BNB fails to break through, we might see a pullback to the channel support at $620-$600 .
Key Levels to Watch:
Resistance: $700-$720
Support: $620-$600
Breakout Target: $800+
Breakdown Risk: $600
Is BNB about to blast through $720, or will it retreat below support? Let’s hear your thoughts below!
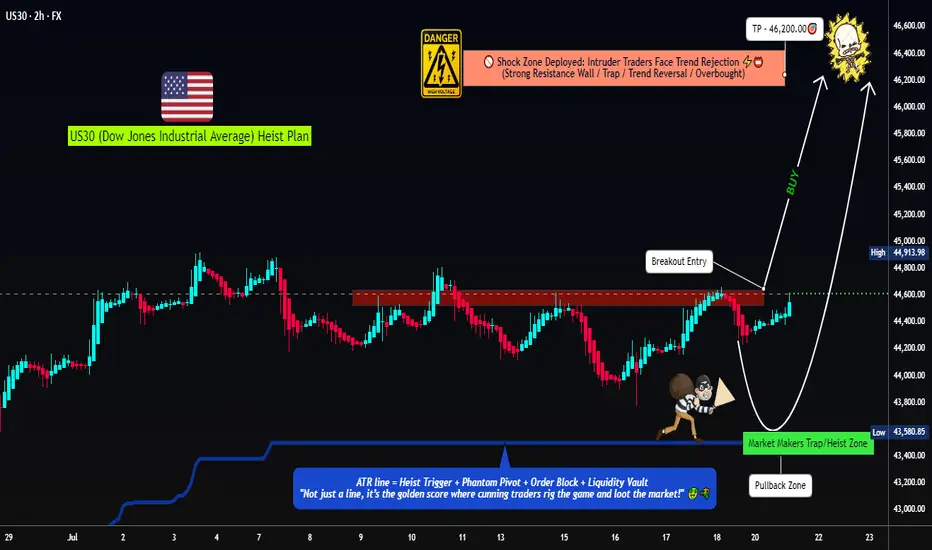
US30 Robbery Blueprint: Breakout, Pullback, Escape Setup💎 Dow Jones Robbery Blueprint: The US30 Vault Crack Plan 💎
(Maximized for reach — within TradingView title limit)
🌟Hi! Hola! Ola! Bonjour! Hallo! Marhaba!🌟
Dear Market Robbers & Money Movers 🕵️♂️💰🚨
This ain't your average analysis — it’s a Thief Trader-style 🔥tactical mission🔥 aimed at the mighty "US30/DJI" (Dow Jones Industrial Average). We're talkin' about a precision heist with a full blueprint: entry zones, trap setups, and escape exits. Read carefully — this ain’t for the faint-hearted traders! 🧠🦾
🧠 Entry Zones (The Break-In) 📈
🛠 ENTRY 1: Crack the wall near 44700.00 – that’s the resistance gate. Wait for confirmation.
🎯 ENTRY 2: Sneak in at the Market Makers’ Trap around 43500.00 – a dirty zone where retailers get baited. Perfect time to strike long!
🧱 DCA/Layering strategy recommended. Stack those buy orders like a thief layering explosives on a safe. 💣💸
🛑 Risk Levels (Escape Routes/Stop Loss)
🔊 "Listen up, vault raiders! Never drop your SL until breakout is confirmed. If you jump early, you might land in a bear trap! 🪤"
🔐 Stop Zones (Based on Strategy):
📌 Swing Buy SL (2H TF): Place at 44100.00 for the stealth buy.
🏦 Institutional SL (Swing Zone): Drop it around 43000.00
🔐 Max Risk SL (3H TF): If you're deep, your last stand is at 39200.00
☝️ SL depends on your position sizing, number of entries, and risk appetite. Trade like a thief, not a gambler.
🎯 Heist Target (Profit Exit)
🏁 Escape Point: 46200.00 — or exit before heat rises! Don’t be greedy. Rob and vanish. 💨💰
🔥 Market Mood: Why the Heist Is On
"US30/DJI" is bullish AF — thanks to:
📊 Macro-Economic Wind at Our Back
📈 Institutional momentum
📰 Strong sentiment and intermarket flows
Check your chart radar: Fundamentals + technicals aligning = green light for robbery! 🟢
⚠️ Tactical Reminder: News Can Jam the Plan
📵 Avoid new entries during major economic releases
🛡 Use trailing SLs to protect running trades
Stay alert, stay alive. 💡
❤️ Support the Robbery Crew
Hit that 💥BOOST💥 — your love fuels our next mission.
Join us and ride daily heist plans with Thief Trading Style 🏴☠️🚀💰
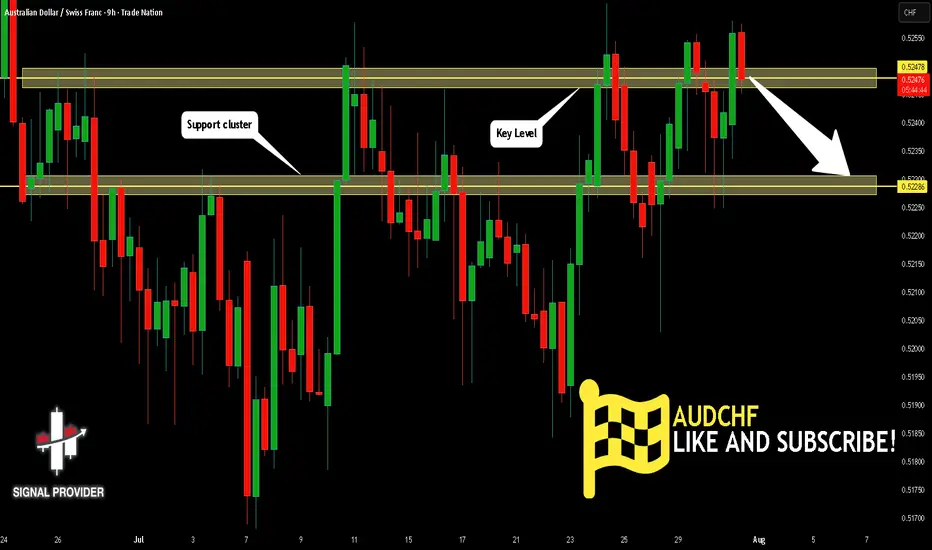
AUDCHF Will Go Down! Short!
Here is our detailed technical review for AUDCHF.
Time Frame: 9h
Current Trend: Bearish
Sentiment: Overbought (based on 7-period RSI)
Forecast: Bearish
The market is on a crucial zone of supply 0.524.
The above-mentioned technicals clearly indicate the dominance of sellers on the market. I recommend shorting the instrument, aiming at 0.522 level.
P.S
Please, note that an oversold/overbought condition can last for a long time, and therefore being oversold/overbought doesn't mean a price rally will come soon, or at all.
Disclosure: I am part of Trade Nation's Influencer program and receive a monthly fee for using their TradingView charts in my analysis.
Like and subscribe and comment my ideas if you enjoy them!
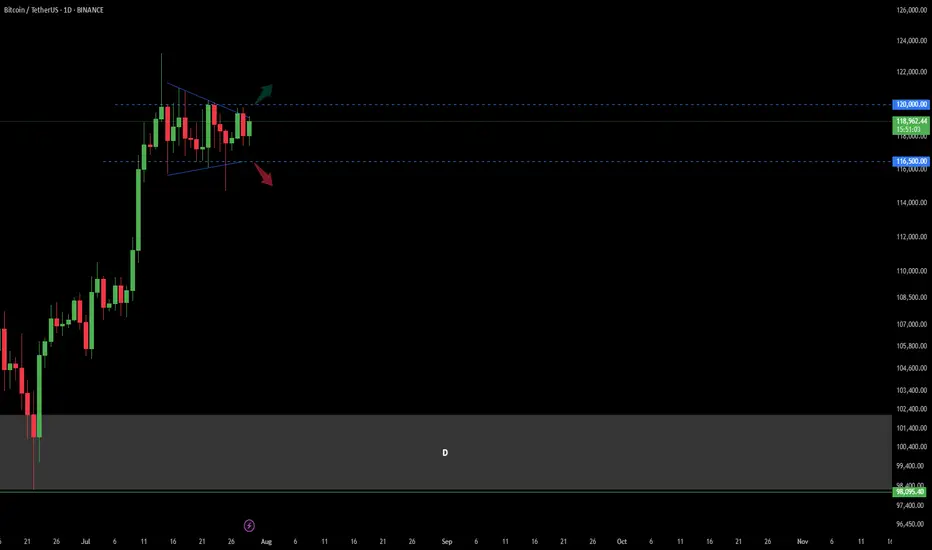
Bitcoin Trend Analaysis UP or DOWN?!Price capped in a wedge in Daily time frame.
There was a fake break from the bottom of this wedge last week and sharply got back to the top of it!
Now : break and confirm above 120 K in Daily would make the market BULLISH
break and confirm under 116.5 K in Daily would make the market BEARISH.
other wise market is still in a range mode...
HOW TO TRADE THE TREND WITH THE 8-STAGE "MARKET TREND MODEL"How to TRADE THE TREND ,
and decide WHEN TO GO LONG OR SHORT ,
using 8-STAGE MARKET LIFECYCLE ROADMAP
This way you will INCREASE YOUR WIN RATE ,
avoid getting stopped out by BEING COMPLETELY AGAINST THE MARKET ,
while seeing BIG MISSED MARKET OPPORTUNITIES
The Methodology is:
1. Simple & Systematic - so it is easy to learn
2. Works across all Markets
3. Works across all Timeframes
4. Can be combined with existing methodologies..

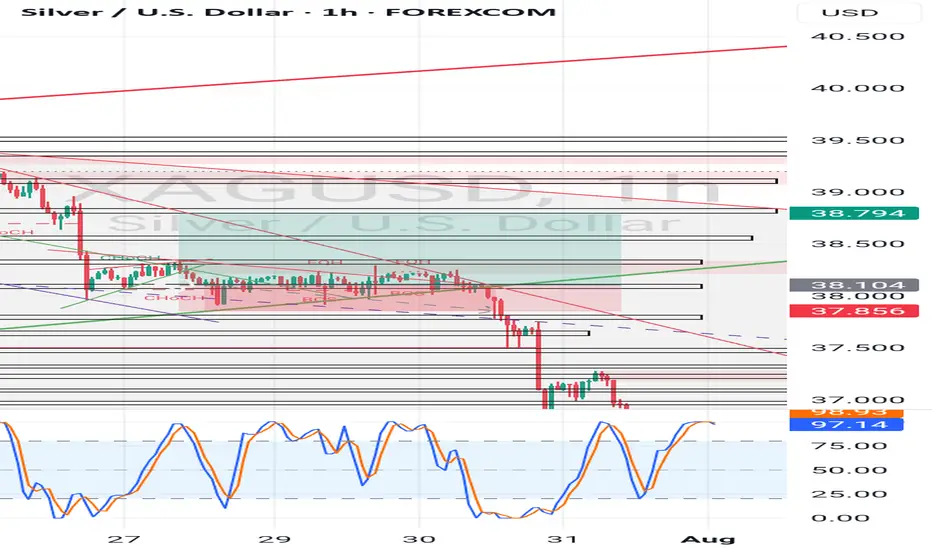
XAG USD LONG RESULT Silver price consolidated in the symmetrical triangle and on the major Support Trendline until it broke down and dumped hitting our sl.
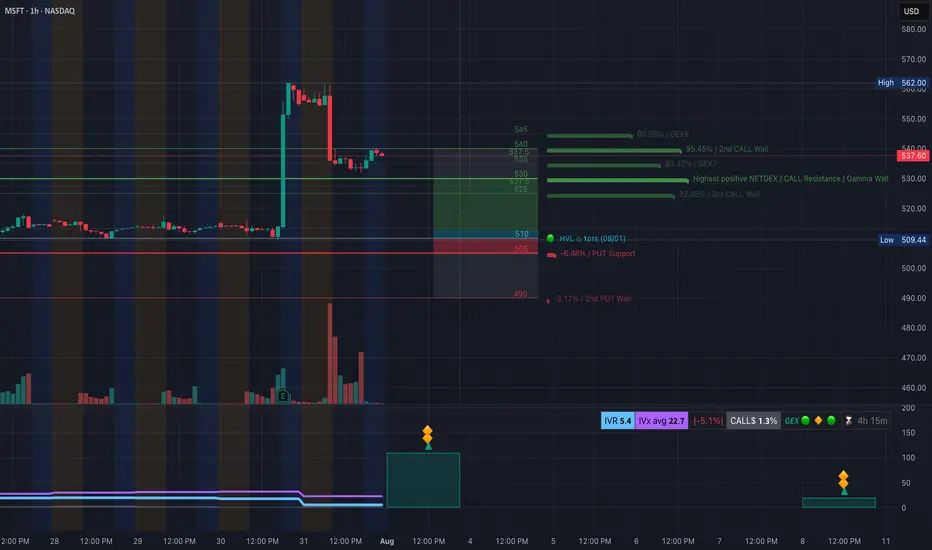
MSFT Post-Earnings Surge. 8/1MSFT Post-Earnings Surge — Consolidation Before Another Leg Up or First Sign of Exhaustion?
🔍 GEX & Options Flow Insight (1st Image Analysis)
Microsoft exploded higher after earnings, reaching the mid-$530s before pulling back slightly. It now sits between strong gamma support and a major Call Wall cluster, indicating a consolidation phase that could lead to either a continuation move or a deeper retracement.
* Call Walls & Resistance:
* 📍 $537.60 → Current price zone, right under minor gamma resistance
* 📍 $540.00 → 2nd Call Wall (95.45% GEX7)
* 🧱 $545–$562 → GEX8/extension zone for a bullish breakout target
* Put Support Zones:
* 🛡️ $530–$525 → Gamma pivot area; losing this would weaken bullish positioning
* 📉 $510.00–$505.00 → Strong HVL + PUT wall support
* 🚨 $490 → Second PUT wall = major breakdown trigger
* Volatility Insight:
* IVR 5.4, IVx Avg 22.7 → Low IV = cheaper premium for spreads
* Call flow 1.3% = Low aggressive bullish positioning
* GEX sentiment: 🟢🟡🟢 = Still supportive for consolidation with bullish lean
✅ Option Trading Suggestion:
Bias: Bullish consolidation, but near-term capped under $540 unless volume expansion
Strategy: Debit call spread for limited risk
* Entry Idea: Buy 540C / Sell 550C for Aug 2 or Aug 9 expiry
* Invalidation: Daily close under $525
* Target: $545 short-term, $562 on breakout
Why this works: MSFT is supported by gamma positioning above $525 and could make a clean push toward $545+ if earnings momentum continues. Spreads help protect from IV crush after earnings.
🧠 Technical Analysis (1H Chart) (2nd Image Analysis)
Market Structure & SMC:
* ✅ Clear BOS (Break of Structure) on earnings gap
* 🟢 Price is consolidating within the post-gap range
* ⚠️ Potential CHoCH forming if price fails $525, which would indicate weakness
Trendline Dynamics:
* Holding above short-term uptrend support line
* Still in a steep post-gap bullish channel
SMC Zones:
* 🟩 Demand / OB Zone: $530–$525 → High-probability bounce area
* 🟥 Supply Zone (Purple Box): $538–$545 → Overhead resistance from post-gap highs
🔄 Price Action & Key Levels
* Support:
* ✅ $530–$525 → First defensive zone
* ✅ $517–$513 → Secondary support
* 🚨 $510–$505 → Hard gamma floor
* Resistance:
* 🚩 $540 → 2nd Call Wall resistance
* 🚀 $545–$562 → Extension zone if breakout occurs
🧭 Scalping / Intraday Trade Setup
🟩 Bullish Setup:
* Entry: $530–$532 dip reclaim
* Target 1: $540
* Target 2: $545–$550 extension
* Stop: Close under $525
🟥 Bearish Pullback Setup:
* Entry: Rejection at $540
* Target 1: $530
* Target 2: $525
* Stop: Breakout above $540 with volume
🔁 Summary Thoughts
* MSFT has post-earnings momentum but is consolidating just below a Call Wall cluster.
* Holding $525–$530 keeps the bullish case alive toward $545+.
* Options are cheap enough for defined-risk bullish spreads, but caution if $525 breaks.
* Expect range-bound chop until a decisive breakout over $540 or a breakdown under $525.
🚨 Disclaimer:
This analysis is for educational purposes only and does not constitute financial advice. Always do your own research and manage your risk accordingly.