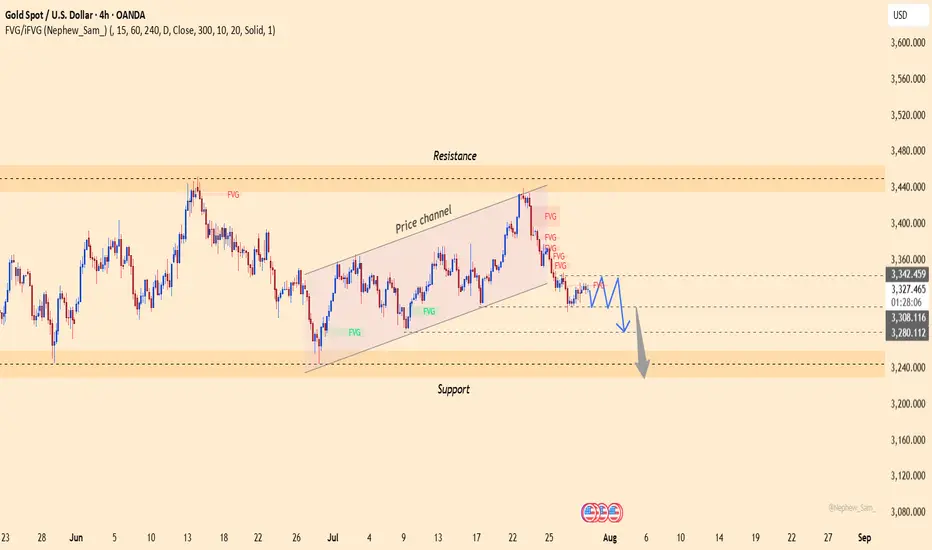
XAUUSD – Downtrend Continues as USD StrengthensGold remains under significant pressure as the U.S. dollar continues to gain strength following a series of positive economic data from the U.S. Specifically, GDP grew by 2.5%, beating expectations, while ADP Non-Farm Employment data also came in strong. This suggests the U.S. economy remains resilient, supporting the Fed's hawkish stance and keeping the dollar strong.
On the 4H chart, XAUUSD has broken below the previous ascending price channel and is now trading under the 3,340.400 resistance zone – an area packed with unfilled FVGs. The current price structure leans bearish, with any rebounds likely to be temporary pullbacks.
If USD strength continues, gold could drop further toward the support zone at 3,279.200 or even lower near 3,240.
Trading Strategy: Focus on SELL
Entry: Around 3,325 – 3,340.400 upon price rejection signals.
Target: 3,279.200 or lower.
Stop-loss: Above 3,342.459
Trend Analysis
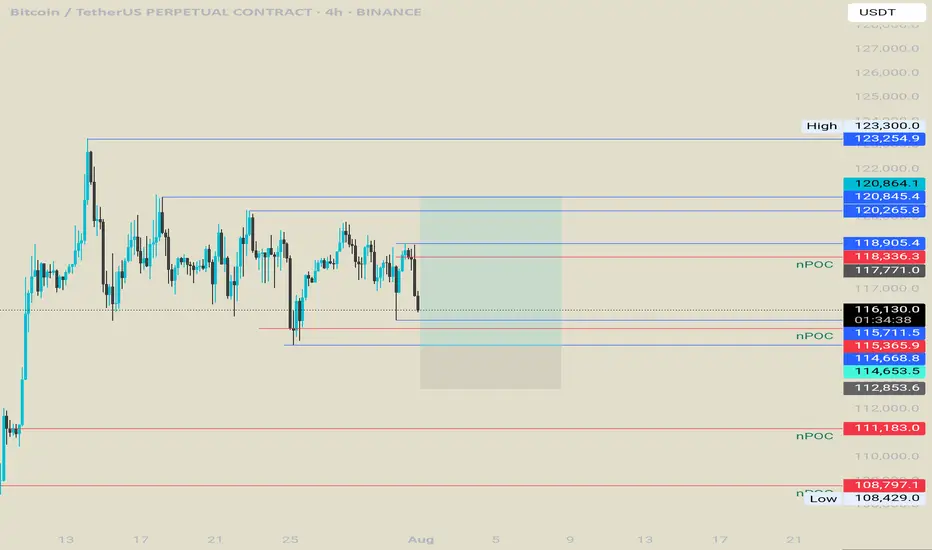
Bitcoin long from 114kWaiting for that npoc level to hit.
After that there is a 4h low , manipulate it , and we will try to catch a reversal.
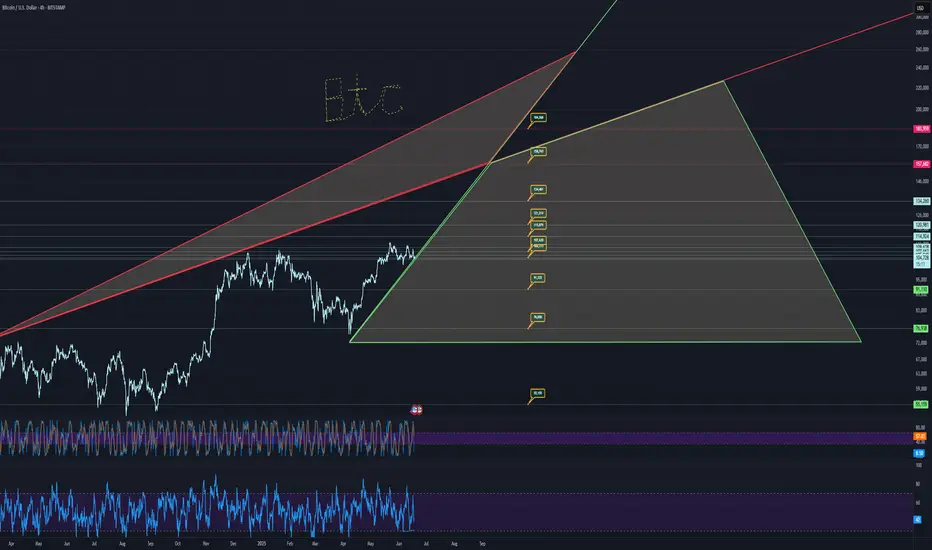
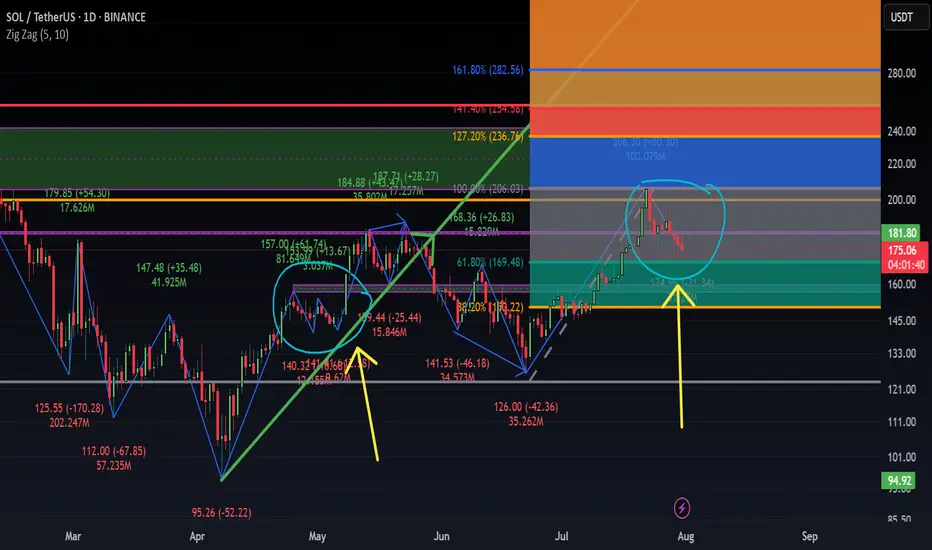
BTC USD 180K BIG HOW?Trends and price targets is how, but realistically, it looks like 134k in the short term.
Drop is wicked if it were to occur, takes price to literally 12k, which you want to go all in if that occurs.
55k is another drop zone.
Otherwise, it looks fairly bullish.
buy zone marked in green,
sell in red.
watch the trends
and price targets are pretty accurate usually.
good luck!!
Custom charts by request.
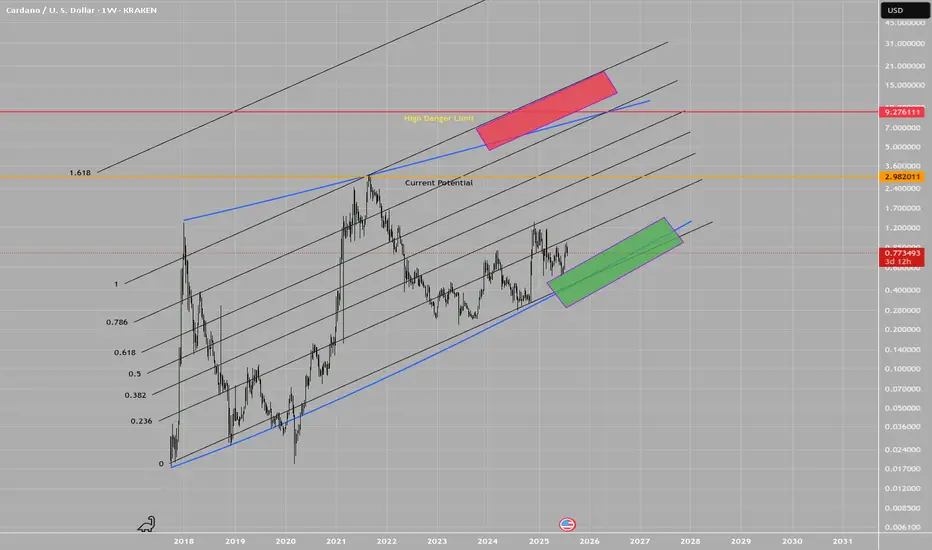
ADA, long term dubious speculationWARNING: This idea is highly dubious!
This is a logarithmic estimate of potential targets, in case Cardano moves in long logarithmic measures.
The real potential of this idea is strongly linked to the fundamentals evolution on time, i.e.: FED reducing the interest rate, for instance, but not only.
The plot features top and bottom limits drown by hand!, these are not perfect logarithmic measures, thus they certainly lacks of math accuracy. Beware.
There are zones in red and green, as transparent boxes, which depicts potential zones of buy and sell interest, of course, everything is in a log scale.
Everyone wish these kind of scenarios to be true. Only time and reality will show us the true face of it. In any case, in the total chaos of uncertainty that this market is, we try to make a sense of it.
Best of the lucks for everyone.
T.
DISCLAIMER: Do your own research! This idea is not a financial advice. All the information presented is highly speculative and cannot be taken as a reference in any circumstance.
BullishWaiting for price to sweep previous daily low the tap in the demand zone higher timeframe is bullish fotsi looking strong let’s see bois
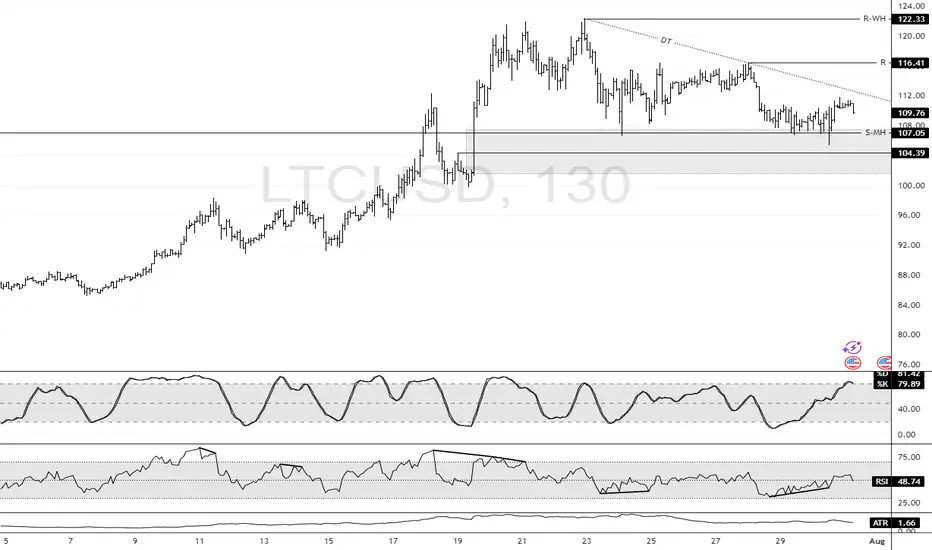
LTC: Bullish Structure Intact Above $104.3 SupportFenzoFx—Litecoin swept liquidity below $107.0 during today’s session and is currently trading near $110.0, supported by a descending trendline.
Technically, key support stands at $104.3. As long as this level holds, the bullish outlook is preserved. A break above the descending trendline could propel LTC toward the previous highs at $116.4 and potentially $122.3.
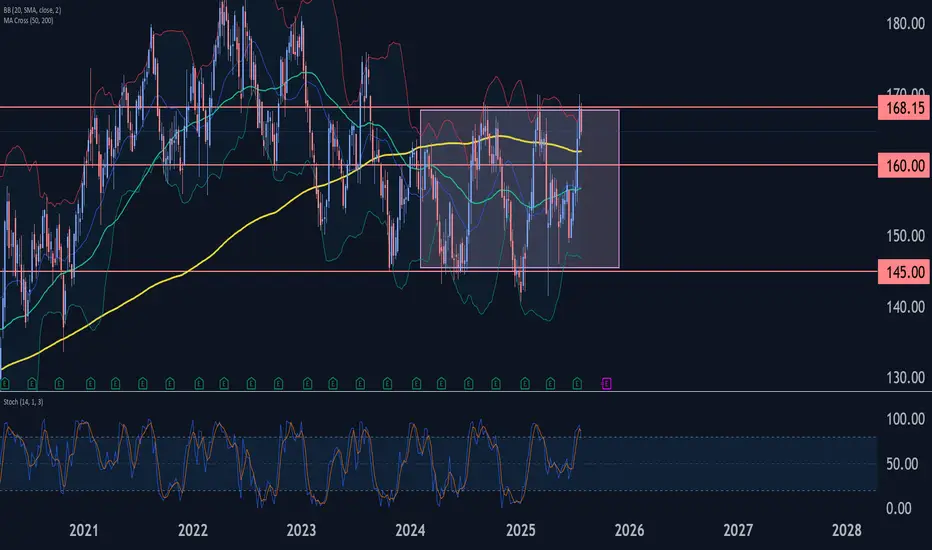
Johnson & Johnson Wave Analysis – 31 July 2025 Johnson & Johnson reversed from the resistance zone
- Likely to fall to support level 160.00
Johnson & Johnson recently reversed down from the strong resistance zone located between the long-term resistance level 168.15 (upper border of the weekly sideways price range from 2023) and the upper weekly Bollinger Band.
The downward reversal from this resistance zone stopped the earlier intermediate impulse wave (3).
Given the strength of the resistance level 168.15 and the overbought weekly Stochastic, Johnson & Johnson can be expected to fall to the next support level 160.00.
31.07.25 Morning ForecastPairs on Watch -
FX:GBPAUD
FX:AUDCAD
FX:AUDCHF
A short overview of the instruments I am looking at for today, multi-timeframe analysis down to what I will be looking at for an entry. Enjoy!

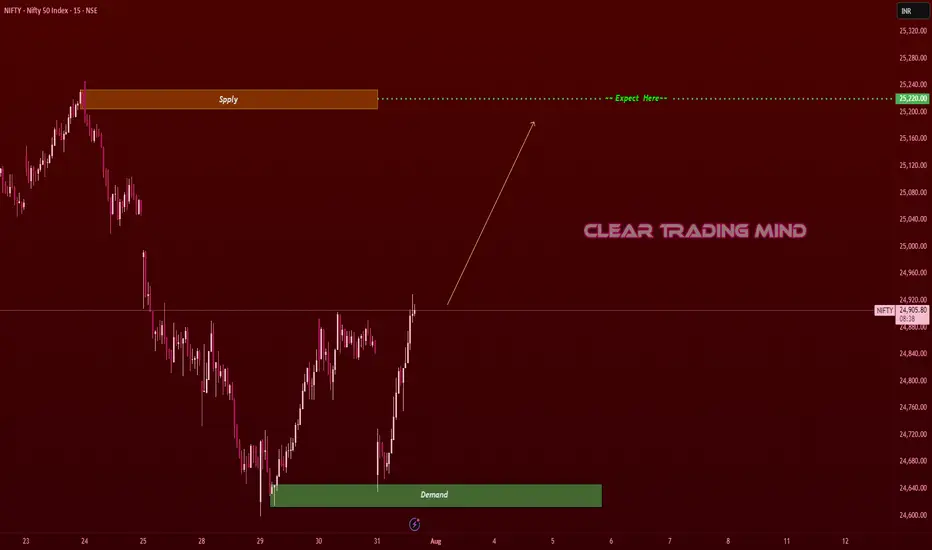
From Demand to Glory: Nifty’s Bullish March to 25,220 Nifty Bullish Outlook
-Current Price: 24,905 (approx)
- Key Demand Zone: 24,620 – 24,660
- Key Supply Zone: 25,200 – 25,240
Technical View
- Strong Demand Bounce: Nifty reversed sharply from the demand zone (24,620–24,660),
indicating strong buying interest.
- Trend Breakout Potential: Price is approaching resistance near 24,920; a breakout could push
towards the supply zone at 25,220 (target).
- Momentum Structure: Higher lows formed after the demand zone test, showing bullish
strength.
News & Data Supporting Bullish Bias
- India’s Q1 GDP Growth: The latest estimates show strong economic growth, supporting equity
market sentiment.
- FIIs Turning Buyers: Foreign Institutional Investors (FIIs) have been net buyers over the past
few sessions, supporting index upside.
- Global Market Tone: US and Asian equities are stable, and crude oil prices are moderating,
supporting risk appetite.
- RBI Policy Outlook: Market expects no immediate rate hikes, keeping liquidity positive for
equities.
Expectation
If Nifty sustains above 24,900, we expect a bullish move towards 25,220 in the short term.
Stop-loss: Below 24,780 (to manage risk).
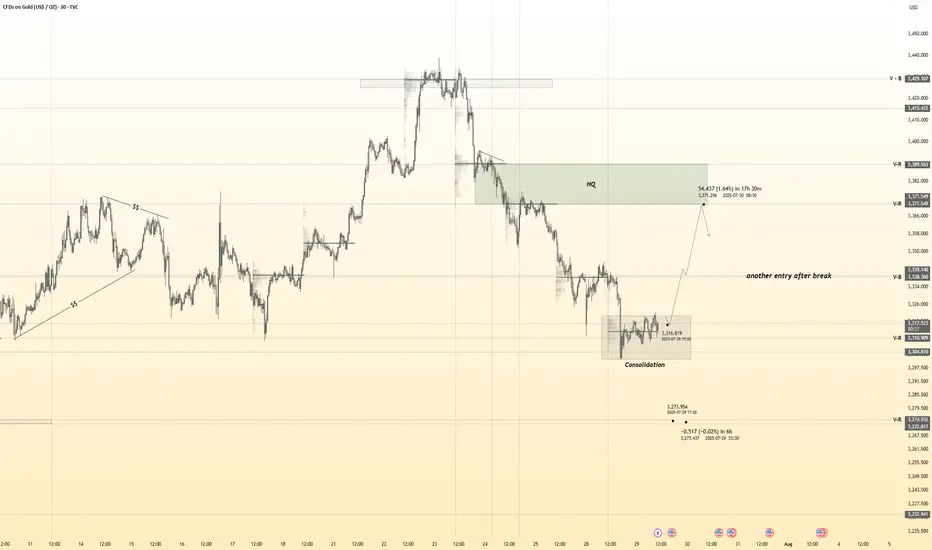
Gold 30Min Engaged ( Bullish Reversal Entry Detected )Time Frame: 30-Minute Warfare
Entry Protocol: Only after volume-verified breakout
🩸Bullish Reversal - 3318
➗ Hanzo Protocol: Volume-Tiered Entry Authority
➕ Zone Activated: Dynamic market pressure detected.
The level isn’t just price — it’s a memory of where they moved size.
Volume is rising beneath the surface — not noise, but preparation.
🔥 Tactical Note:
We wait for the energy signature — when volume betrays intention.
The trap gets set. The weak follow. We execute.
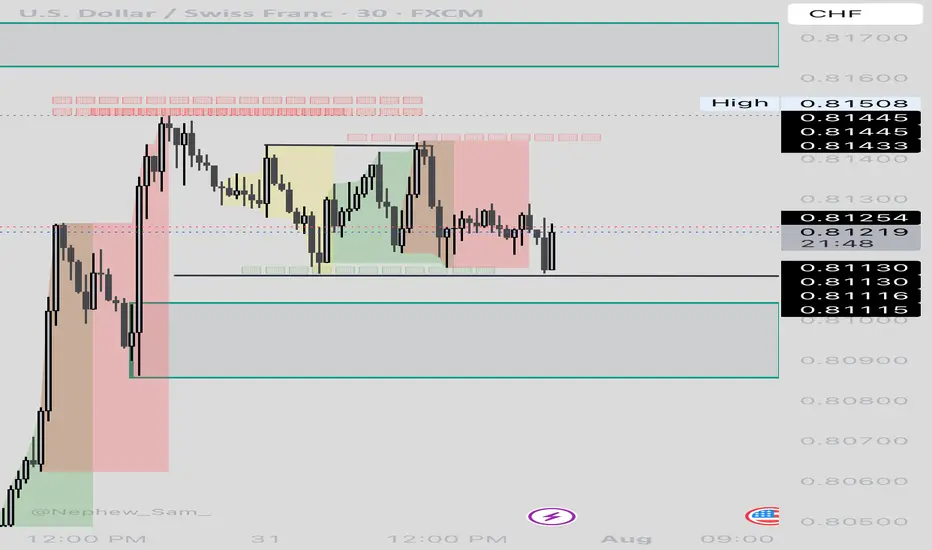
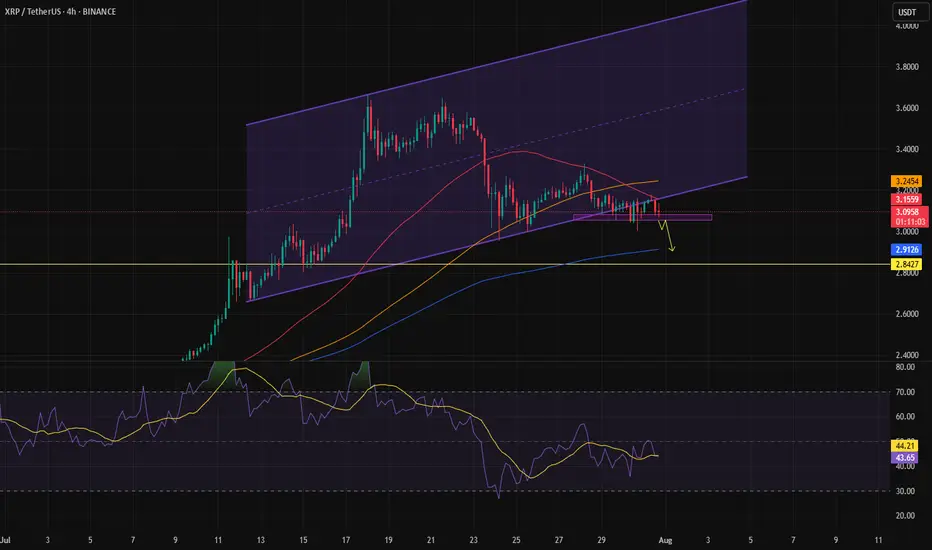
dump or price reversal?It's been a while that the price has been struggling with the bottom of the channel, trying to bounce back, but so far there's no sign of strength. This could lead the price to drop down to the yellow line area.
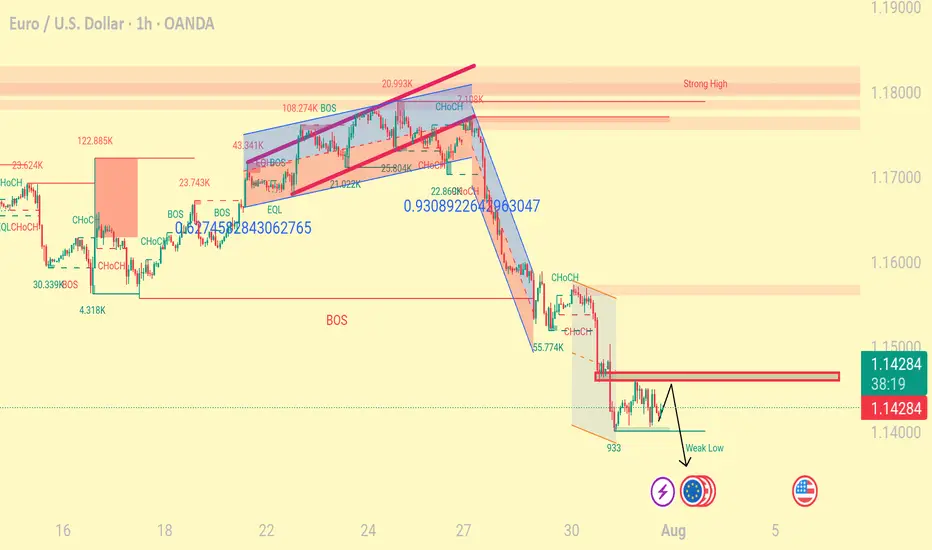
Eurusd techinical analysis.Eurusd techinical analysis next move posibale at h1 time frame not finchinal advice.
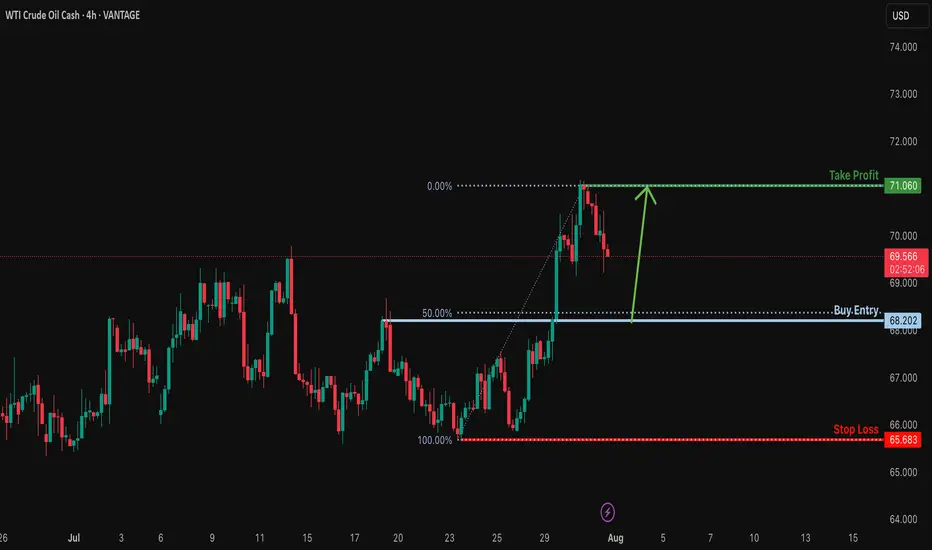
Bullish bounce off 50% Fibonacci support?USOUSD is falling towards the support levle which is a pullback support that aligns with the 50% Fibonacci retracement and could bounce from this level to our take profit.
Entry: 68.20
Why we like it:
There is a pullback support that lines up with the 50% Fibonacci retracement.
Stop loss: 65.68
Why we like it:
There is a multi swing low support.
Take profit: 71.06
Why we like it:
There is a swing high resistance.
Enjoying your TradingView experience? Review us!
Please be advised that the information presented on TradingView is provided to Vantage (‘Vantage Global Limited’, ‘we’) by a third-party provider (‘Everest Fortune Group’). Please be reminded that you are solely responsible for the trading decisions on your account. There is a very high degree of risk involved in trading. Any information and/or content is intended entirely for research, educational and informational purposes only and does not constitute investment or consultation advice or investment strategy. The information is not tailored to the investment needs of any specific person and therefore does not involve a consideration of any of the investment objectives, financial situation or needs of any viewer that may receive it. Kindly also note that past performance is not a reliable indicator of future results. Actual results may differ materially from those anticipated in forward-looking or past performance statements. We assume no liability as to the accuracy or completeness of any of the information and/or content provided herein and the Company cannot be held responsible for any omission, mistake nor for any loss or damage including without limitation to any loss of profit which may arise from reliance on any information supplied by Everest Fortune Group.
ton/usdt clear bullsih pattren dyor HERE u can get lot of help from here
TON/USDT a graphically bullish chart pattern and fundamentals are good
long term hodl good and futures 2-4x lev is enough for entire cucle here we can see a 70% potential in this
dis: im not finanicail advisor

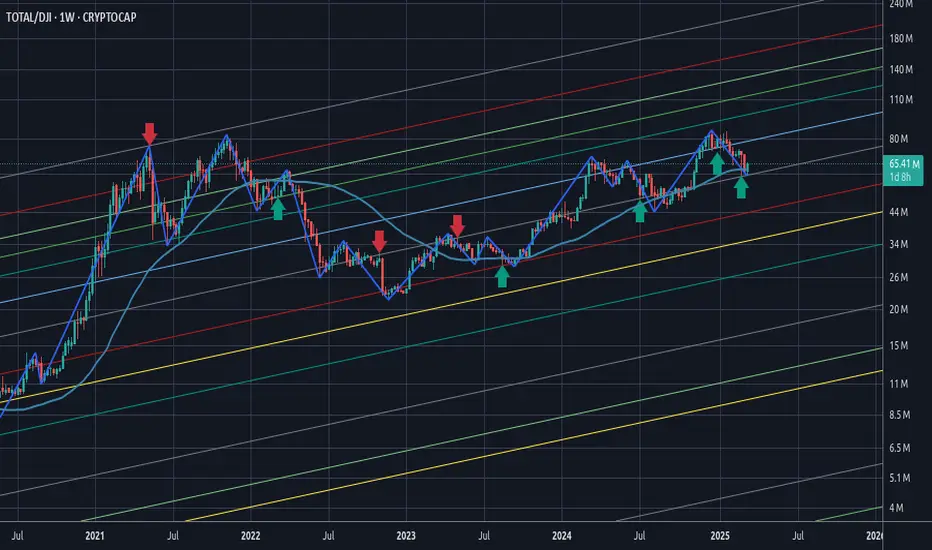
Money Flow - 2### Money Flow Spread from DJI to Cryptocurrency: A Fibonacci Perspective
The financial markets operate in an interconnected ecosystem where capital flows between asset classes based on macroeconomic trends, investor sentiment, and risk appetite. One such dynamic involves the movement of funds from traditional markets like the **Dow Jones Industrial Average (DJI)**—a barometer of blue-chip stocks—to emerging asset classes such as **cryptocurrencies**. This phenomenon can often be analyzed using **Fibonacci retracements and extensions**, which serve as powerful tools for identifying key support, resistance, and potential price targets during shifts in market momentum.
#### 1. **Market Sentiment and Capital Rotation**
- The DJI represents large-cap equities that are heavily influenced by institutional investors, central bank policies, and global economic conditions. When these factors trigger volatility or uncertainty in traditional markets, investors may seek alternative investments with higher growth potential or hedging properties.
- Cryptocurrencies, known for their decentralized nature and high volatility, attract speculative capital during periods when confidence in traditional assets wanes. For instance:
- During bearish trends in the DJI, characterized by falling prices and increased selling pressure, some investors might reallocate portions of their portfolios into cryptocurrencies like Bitcoin (BTC) or Ethereum (ETH).
- Conversely, bullish trends in the DJI could signal improved risk appetite, prompting a portion of crypto gains to rotate back into equities.
#### 2. **Fibonacci Retracements: Identifying Key Levels**
- Fibonacci retracement levels are derived from the Fibonacci sequence and are widely used in technical analysis to predict areas of support and resistance. These levels (e.g., 23.6%, 38.2%, 50%, 61.8%) help identify potential turning points in price action.
- In the context of money flow from the DJI to cryptocurrencies:
- A significant decline in the DJI could lead to a pullback to Fibonacci retracement levels (e.g., 38.2% or 61.8%). At these junctures, traders may reassess their positions and consider diversifying into cryptocurrencies.
- Similarly, after a sharp rally in cryptocurrencies, prices might retrace to Fibonacci levels before continuing upward. Investors exiting equities due to underperformance might view these retracements as entry points for digital assets.
#### 3. **Fibonacci Extensions: Projecting Price Targets**
- While retracements focus on corrective moves within a trend, Fibonacci extensions project potential price targets beyond the initial move. Common extension levels include 127.2%, 161.8%, and 261.8%.
- In scenarios where money flows out of the DJI and into cryptocurrencies:
- If the DJI experiences a prolonged downtrend, its losses could coincide with outsized gains in cryptocurrencies. Fibonacci extensions can help forecast how far crypto prices might rise amid this influx of capital.
- For example, if Bitcoin breaks above a key resistance level following a surge in inflows from equities, traders might use Fibonacci extensions to estimate future price milestones (e.g., $100,000 or $200,000).
#### 4. **Psychological Drivers Behind the Transition**
- Fibonacci levels resonate with traders because they align with natural human tendencies toward symmetry and proportion. This psychological aspect amplifies their relevance when analyzing cross-market dynamics.
- As money exits the DJI and enters cryptocurrencies, Fibonacci-based trading strategies provide a framework for understanding how participants perceive value across different asset classes. For instance:
- Institutional investors exiting equities might anchor their decisions around Fibonacci-derived thresholds, ensuring disciplined entry and exit points in volatile crypto markets.
- Retail traders, who dominate much of the cryptocurrency space, also rely on Fibonacci tools to time their trades, creating self-reinforcing patterns that influence overall market behavior.
#### 5. **Case Study Example**
- Imagine a scenario where the DJI drops sharply due to rising interest rates or geopolitical tensions. The index falls from 35,000 to 30,000—a decline of approximately 14%. Traders observe Fibonacci retracement levels at 38.2% ($31,900) and 61.8% ($33,100), expecting temporary bounces at these levels.
- Simultaneously, Bitcoin rallies from $20,000 to $30,000 as investors seek refuge in digital gold. Using Fibonacci extensions, analysts project further upside to $38,200 (127.2%) or even $48,500 (161.8%), attracting additional capital from equity markets.
#### 6. **Conclusion**
- The interplay between the DJI and cryptocurrencies highlights the fluidity of modern financial markets. By leveraging Fibonacci retracements and extensions, traders can better anticipate shifts in money flow and position themselves strategically.
- Whether driven by macroeconomic headwinds, technological innovation, or evolving investor preferences, the migration of capital from traditional indices like the DJI to digital assets underscores the growing convergence of old and new finance. Fibonacci analysis serves as a bridge, offering insights into both the timing and magnitude of these transitions.
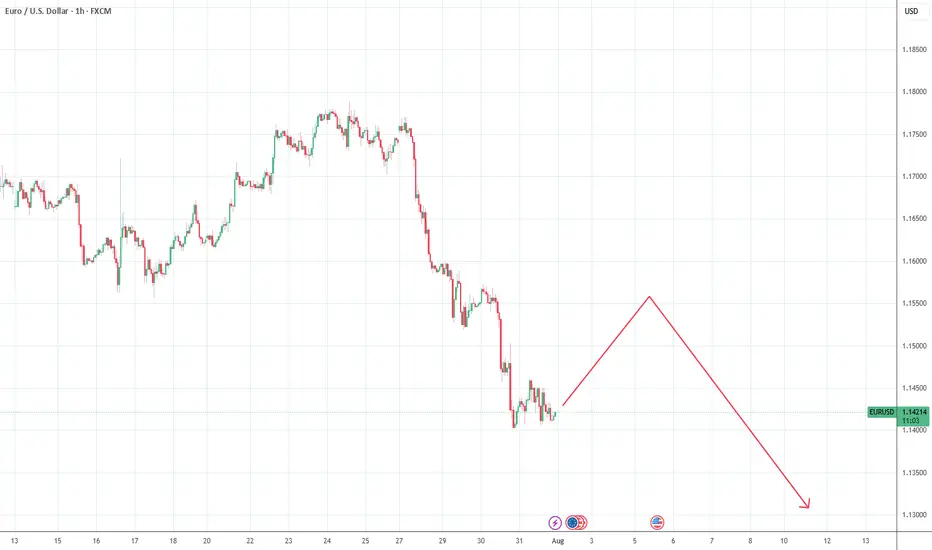
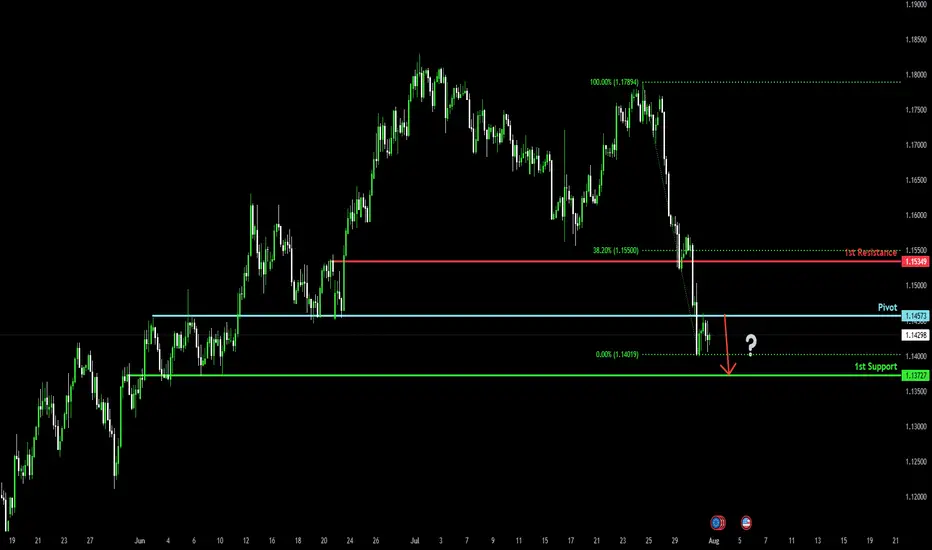
Bearish drop?The Fiber (EUR/USD) has rejected off the pivot and could potentially drop to the 1st support, which acts as an overlap support.
Pivot: 1.1457
1st Support: 1.1372
1st Resistance: 1.1534
Risk Warning:
Trading Forex and CFDs carries a high level of risk to your capital and you should only trade with money you can afford to lose. Trading Forex and CFDs may not be suitable for all investors, so please ensure that you fully understand the risks involved and seek independent advice if necessary.
Disclaimer:
The above opinions given constitute general market commentary, and do not constitute the opinion or advice of IC Markets or any form of personal or investment advice.
Any opinions, news, research, analyses, prices, other information, or links to third-party sites contained on this website are provided on an "as-is" basis, are intended only to be informative, is not an advice nor a recommendation, nor research, or a record of our trading prices, or an offer of, or solicitation for a transaction in any financial instrument and thus should not be treated as such. The information provided does not involve any specific investment objectives, financial situation and needs of any specific person who may receive it. Please be aware, that past performance is not a reliable indicator of future performance and/or results. Past Performance or Forward-looking scenarios based upon the reasonable beliefs of the third-party provider are not a guarantee of future performance. Actual results may differ materially from those anticipated in forward-looking or past performance statements. IC Markets makes no representation or warranty and assumes no liability as to the accuracy or completeness of the information provided, nor any loss arising from any investment based on a recommendation, forecast or any information supplied by any third-party.
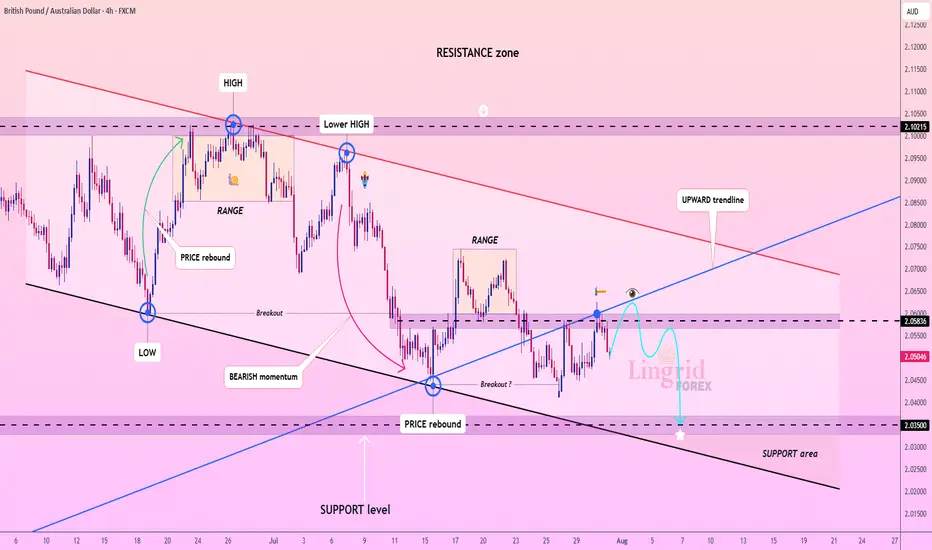
Lingrid | GBPAUD Bearish Pressure. Potential ShortThe price perfectly fulfilled my previous idea . FX:GBPAUD rebounded from support and has climbed into a tight resistance zone near 2.05836, but momentum remains weak near the downward trendline. The price structure shows a sequence of lower highs and a tight range below resistance, suggesting sellers are still in control. A rejection at this level would confirm another failed breakout attempt. If confirmed, the pair could revisit the 2.03500 support area with bearish continuation pressure.
📌 Key Levels
Sell trigger: Rejection at 2.05836 and break of 2.05000
Sell zone: 2.05800–2.06000
Target: 2.03500
Invalidation: Strong break and close above 2.06000
💡 Risks
Bullish breakout above trendline resistance
Fundamental surprise (UK/AU economic data)
Shift in broader risk sentiment or AUD weakness
If this idea resonates with you or you have your own opinion, traders, hit the comments. I’m excited to read your thoughts!
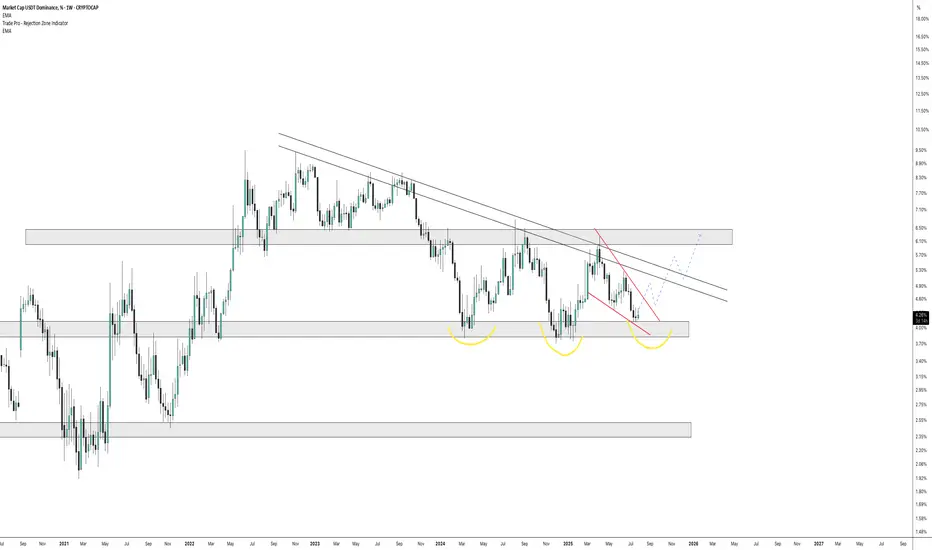
Major Bearish is scenario is comingUSDT dominance has reached a strong support level, forming an Inverted Head and Shoulders pattern. The last leg of the pattern touched the support with an ABC pullback, creating an inverted wedge.
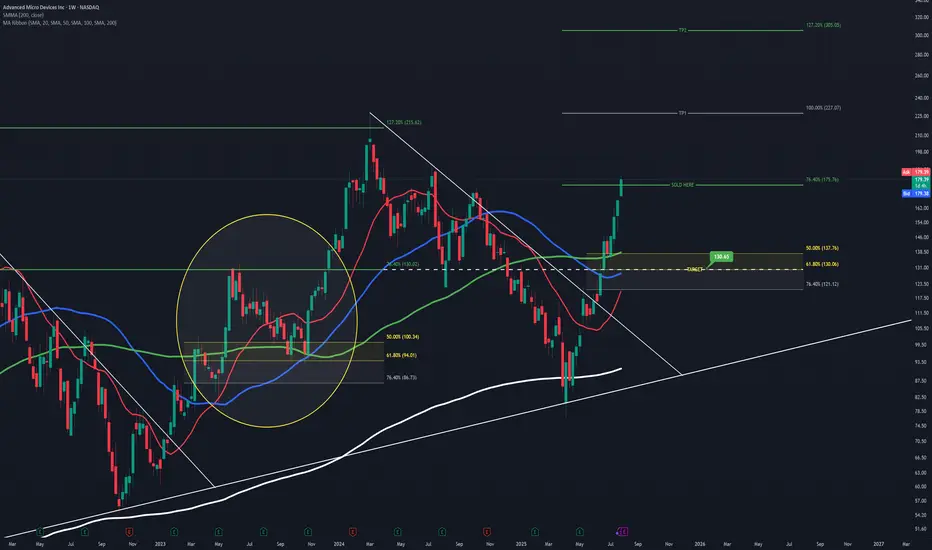
AMD Projection and Entry PointThis is speculation just like before, which played out very well so this is me having another shot at it.
Going off of the prior cycle AMD went through and comparing it to the one it's currently in, you can see a lot of similarities.
Learning from it's past and seeing how it likes to react to certain Fib levels, you can see that the 76.40% has been respected as a major level of resistance which resulted in its short retracement back in June '23 , It also acts as a very strong level of support as shown in August '24.
Assuming AMD rejects at the current 76.40% level again, using the prior 76.40% you can see it aligns perfectly with the golden ratio I have setup as my buy entry.
It all lines up too perfectly that in my mind, I'm certain it will play out. But of course it's all speculation, and the markets do as they please.
Fibonacci Arcs in Stock TradingFibonacci Arcs in Stock Trading
Fibonacci arcs, derived from the renowned Fibonacci sequence, offer a compelling blend of technical analysis and market psychology for traders. By mapping potential support and resistance areas through arcs drawn on stock charts, these tools provide insights into future price movements. This article delves into the practical applications of Fibonacci arcs in trading, their interplay with market psychology, and best practices for effective use.
Understanding Fibonacci Arcs
The Fibonacci arc indicator is a unique tool in technical analysis derived from the famed Fibonacci sequence. It’s crafted by drawing arcs at the key Fibonacci retracement levels - 38.2%, 50%, and 61.8% - from a high to a low point on a stock chart. Each curve represents potential support or resistance areas, offering insights into the stock’s future movements.
The art of arc reading, meaning interpreting these curves, is crucial for traders. When a stock approaches or intersects with an arc, it reflects a significant reaction level. For instance, if a stock price touches or nears an arc, it could face arc resistance, indicating a potential halt or reversal in its trend.
Applying Fibonacci Arcs in Trading
In the stock market, these arcs serve as a guide for traders seeking to anticipate future price movements. When applied correctly, they can provide critical insights into potential support and resistance levels. Here's a step-by-step look at how you may use them effectively:
- Identifying High and Low Points: Begin by selecting a significant high and low point on the stock's chart. In an uptrend, it’s the most recent swing high to a previous swing low, and vice versa. These are the anchor points.
- Drawing the Arcs: Once the points are selected, draw the arcs at the Fibonacci retracement levels of 38.2%, 50%, and 61.8%. They radiate from the chosen low point to the high point (or vice versa), cutting across the chart.
- Interpretation: Watch how the stock interacts with these lines. When the price approaches an arc, it might encounter resistance or support, signalling a potential change in trend or continuation.
- Timing Entries and Exits: Traders can use the arcs in the stock market as a tool to time their trading decisions. For instance, a bounce could be a signal to enter a trade, whereas the price breaking through might suggest it's time to exit.
Fibonacci Arcs and Market Psychology
The effectiveness of Fibonacci arcs in trading is deeply intertwined with market psychology. They tap into the collective mindset of traders, who often react predictably to certain price levels. The Fibonacci sequence, underlying this tool, is not just a mathematical concept but also a representation of natural patterns and human behaviour.
When a stock nears a curve, traders anticipate a reaction, often leading to a self-fulfilling prophecy. If many traders make an arc stock forecast, they might sell as the price approaches a certain point, causing the anticipated resistance to materialise. Similarly, seeing support at an arc can trigger buying, reinforcing the tool’s power.
This psychological aspect makes Fibonacci arcs more than just technical tools. They are reflections of the collective expectations and actions of market participants, turning abstract mathematical concepts into practical indicators of market sentiment and potential movements.
Best Practices
Incorporating Fibonacci arcs into trading strategies involves nuanced techniques for better accuracy and efficacy. Here are some best practices typically followed:
- Complementary Tools: Traders often pair this tool with other indicators like moving averages or RSI for a more robust analysis.
- Accurate Highs and Lows: It's best to carefully select the significant high and low points, as the effectiveness of the curves largely depends on these choices.
- Context Consideration: Understanding the broader market context is crucial. Traders usually use Fibonacci arcs in conjunction with fundamental factors to validate their analysis.
- Watch for Confluence: Identifying areas where Fibonacci levels converge with other technical signals can provide stronger trade setups.
- Practice Patience: Traders typically avoid making hasty decisions based solely on Fibonacci levels. It's usually better to wait to see additional confirmation from the price action.
Advantages and Limitations of Fibonacci Arcs
Fibonacci arcs are a popular tool in technical analysis, offering distinct advantages and some limitations in analysing stock movements. Understanding these can help traders leverage the tool more effectively.
Advantages
- Intuitive Nature: The Fibonacci sequence is a natural pattern, making the tool intuitive for traders to understand and apply.
- Dynamic Support and Resistance Levels: They provide dynamic levels of support and resistance, unlike static lines, adapting to changing market conditions.
- Versatility: Effective in various market conditions, the arcs can be used in both trending and sideways markets.
Limitations
- Subjectivity in Selection: The effectiveness largely depends on correctly identifying the significant high and low points, which can be subjective.
- Potential False Signals: Like all technical tools, they can generate false signals, especially in highly volatile markets.
- Requires Complementary Analysis: To maximise effectiveness, these curves are usually used alongside other technical indicators, as they are not infallible on their own.
The Bottom Line
Fibonacci arcs are invaluable tools in stock analysis, providing insights into market trends and potential price movements.
This article represents the opinion of the Companies operating under the FXOpen brand only. It is not to be construed as an offer, solicitation, or recommendation with respect to products and services provided by the Companies operating under the FXOpen brand, nor is it to be considered financial advice.