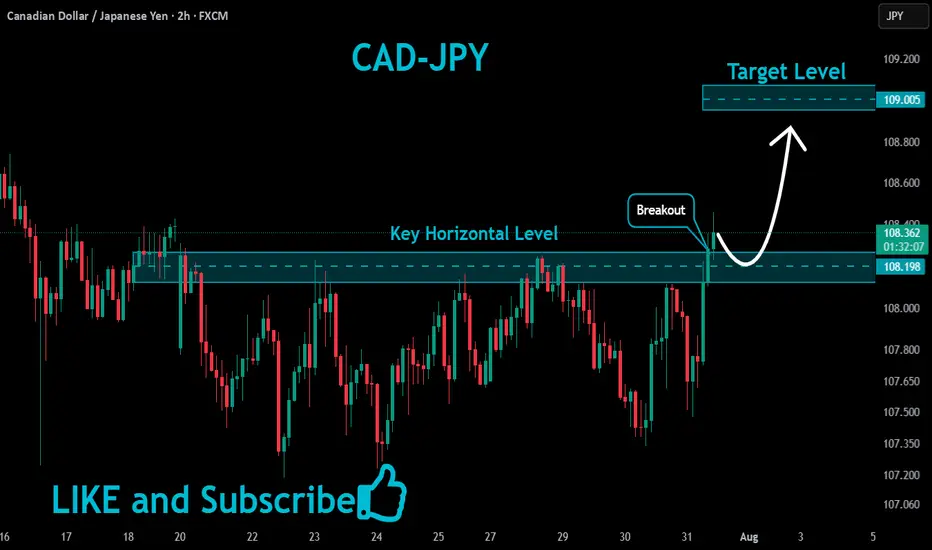
CADJPY Will Keep Growing!
HI,Traders !
#CADJPY keep growing and
The pair made a bullish breakout
Of the key horizontal level
Of 108.198 and the pair is
Already retesting the new
Support and we will be
Expecting a further
Bullish move uP !
Comment and subscribe to help us grow !
Trend Analysis
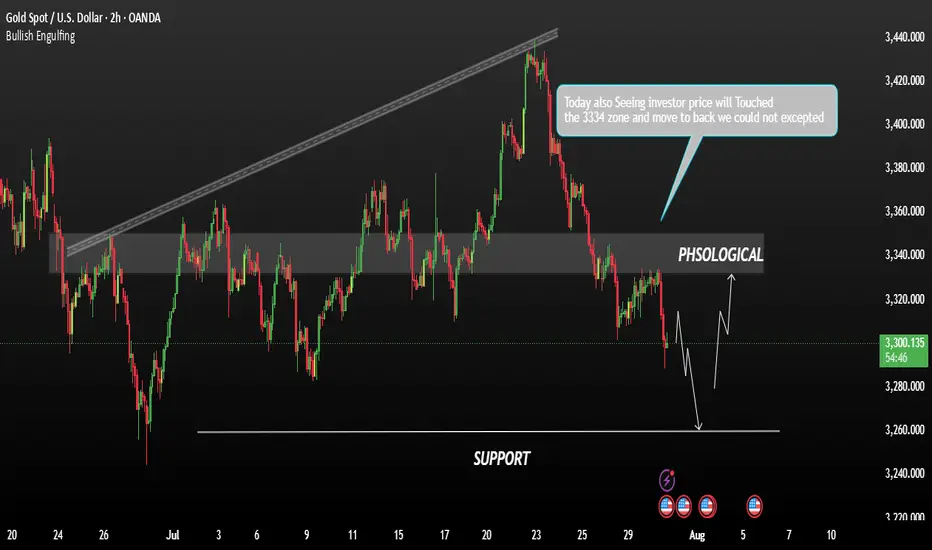
Follow master candle for today's SELL strategy✏️ OANDA:XAUUSD has continued a strong downtrend. Yesterday's D1 candle closed with a 60-price decrease, forming a master candle that determines the market trend. With the market having a master candle, pay attention to the 25% or 50% candle zones to trade in the direction of the trend. Today's main trading strategy will be to SELL according to the master candle. The BUY strategy will only be implemented when the 3313 zone is broken.
📉 Key Levels
Support: 3285-3270-3250
Resistance: 3301-3312-3333
SELL Trigger. Rejection 3301, 3312
Target 3250
Leave your comments on the idea. I am happy to read your views.
XAUUSD – Bearish Outlook Ahead of FOMCGold is currently under bearish pressure as markets await the highly anticipated FOMC meeting, scheduled to begin in less than an hour. Investors are closely watching the Fed's interest rate decision and the release of the meeting minutes, which could trigger sharp volatility across the forex and commodities markets.
Technical Outlook:
From a technical perspective, the price action suggests a potential continuation of the bearish trend. If the FOMC event leads to a stronger U.S. dollar or a hawkish tone from the Fed, gold prices may decline further.
Resistance Zone; 3315 / 3330
Support Levels: 3282 / 3260
You May find more details in the Chart.
Trade wisely Best Of Luck Buddies.
Ps: Support with like and comments for better insights Thanks for understand.
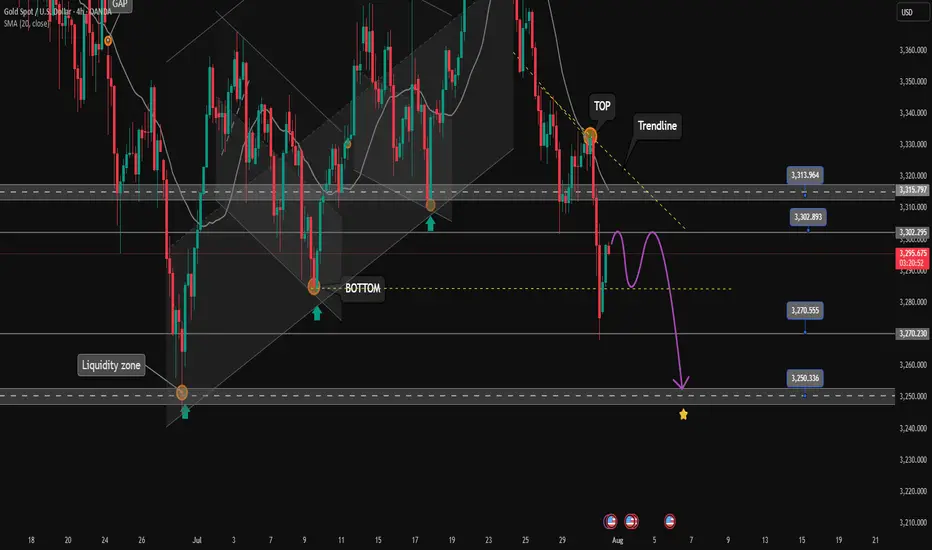
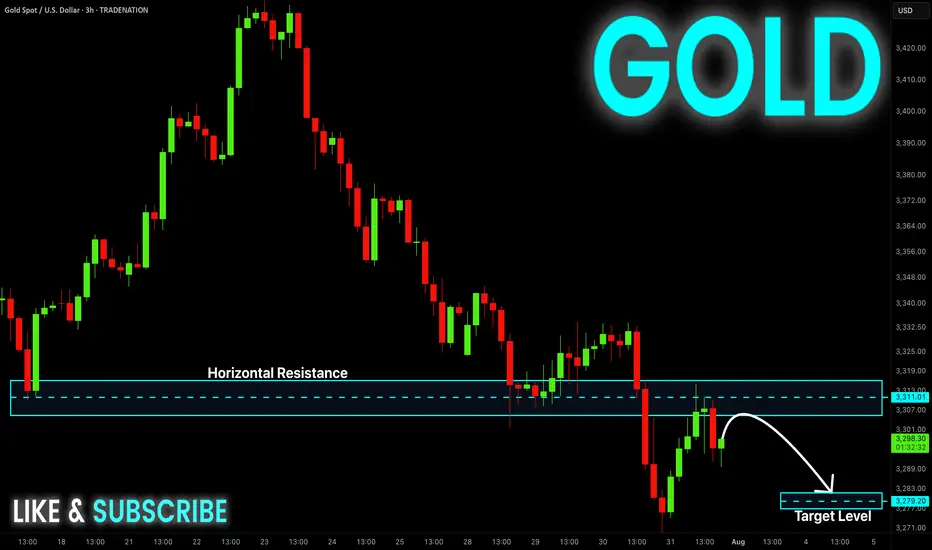
GOLD Local Short! Sell!
Hello,Traders!
GOLD made a retest
Of the horizontal resistance
Of 3313$ and we are already
Seeing a bearish reaction and
We will be expecting a further
Bearish move down
Sell!
Comment and subscribe to help us grow!
Check out other forecasts below too!
Disclosure: I am part of Trade Nation's Influencer program and receive a monthly fee for using their TradingView charts in my analysis.
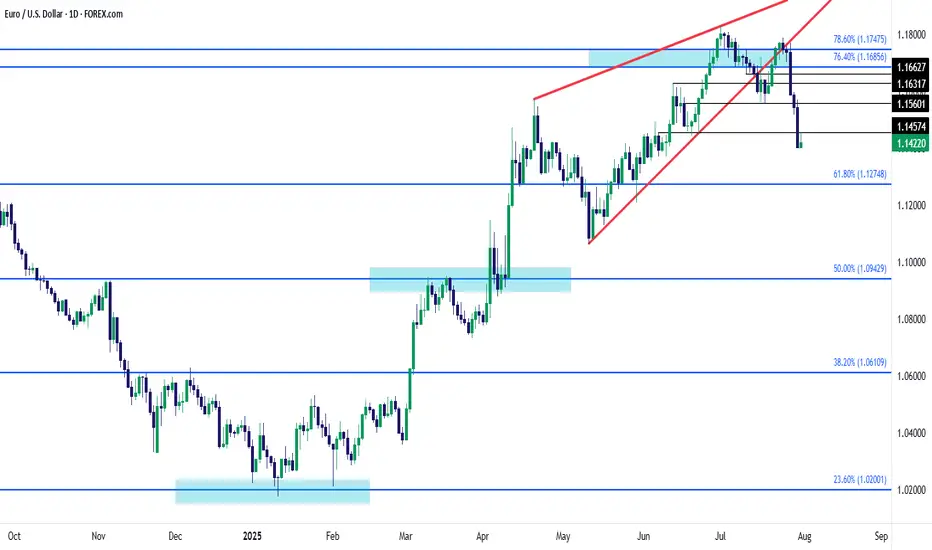
EUR/USD Rising Wedge Break Now Oversold on H4Markets have moved quickly this week and it's been a very bearish outlay for EUR/USD since last Thursday's ECB rate decision. The pair set a lower-high around that announcement and then the day after saw bears make another push, with a key hold at a Fibonacci level plotted at 1.1748. I've been highlighting that level since before the Q3 open and so far, that's the spot that bulls have failed to leave behind.
The quandary now is just how quickly this move has come on. The USD is working on its strongest month since April of 2022 and that prior instance was driven by the Fed starting a rate hike cycle, which clearly isn't happening here. Also complicating the matter is the fact that RSI on the four-hour chart has already pushed into oversold territory, making the prospect of chasing-lower a daunting item.
We've already seen an instance of prior support coming in as resistance with the hold of the daily high at 1.1457. With NFP tomorrow, perhaps the more attractive scenario would be a larger pullback which could then highlight resistance potential at either 1.1500 or 1.1560. - js
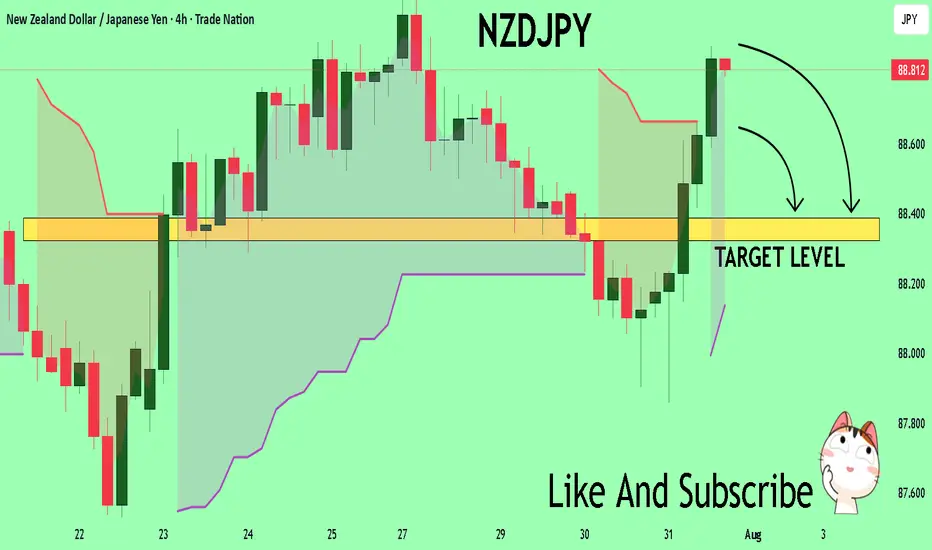
NZDJPY The Target Is DOWN! SELL!
My dear friends,
Please, find my technical outlook for NZDJPY below:
The price is coiling around a solid key level - 88.806
Bias - Bearish
Technical Indicators: Pivot Points Low anticipates a potential price reversal.
Super trend shows a clear sell, giving a perfect indicators' convergence.
Goal - 88.388
About Used Indicators:
The pivot point itself is simply the average of the high, low and closing prices from the previous trading day.
Disclosure: I am part of Trade Nation's Influencer program and receive a monthly fee for using their TradingView charts in my analysis.
———————————
WISH YOU ALL LUCK
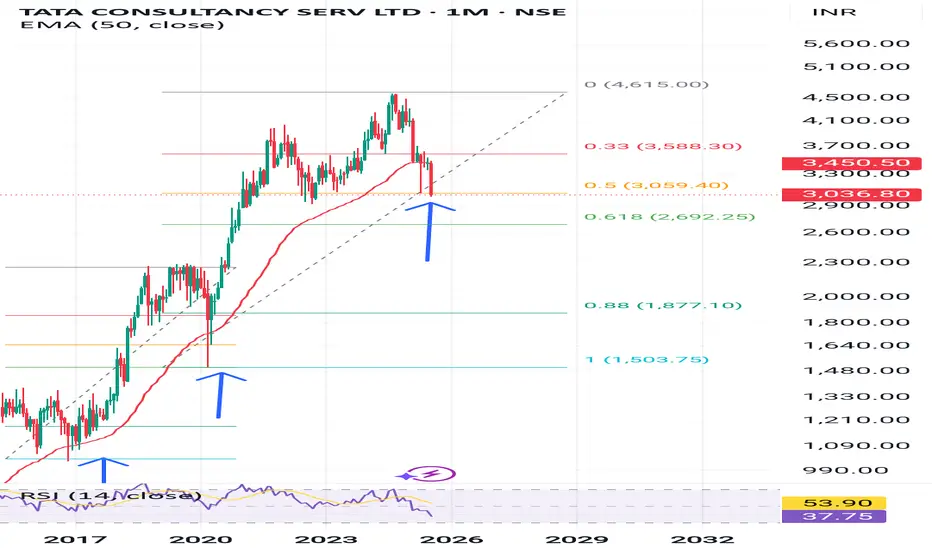
TCS nearing fibonachi support of 2700Historical Analysis of TCS for those who belive in fibonachi levels
Precious retracement of TCS happened exactly till golden ratio 61.8
This time it had already retraced till 50% level.
So buy now or wait till 61.8 levels।
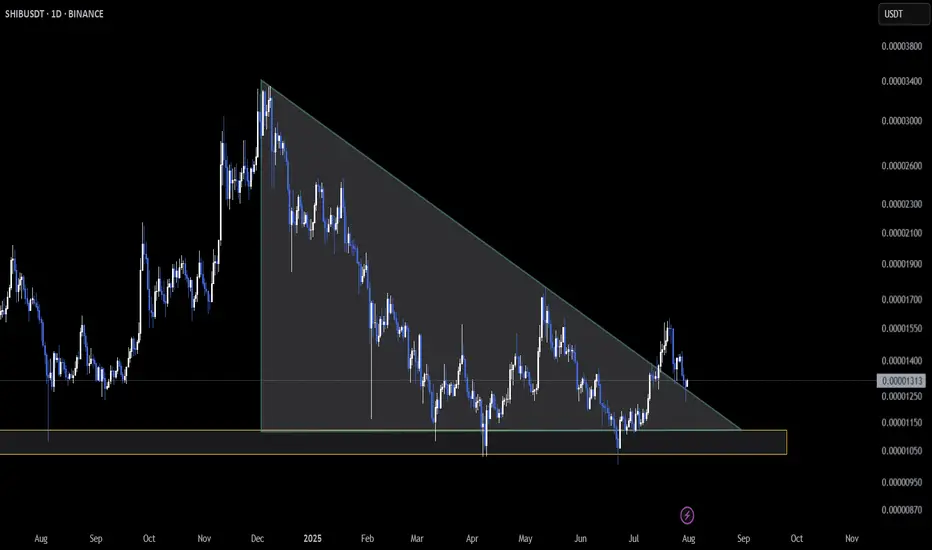
SHIB Retests Triangle Support as Pressure Mounts🔥 CRYPTOCAP:SHIB is locked into a key zone on the daily chart — price is retesting the base of a descending triangle structure 🛡️
So far, support is holding, but the range is tightening. A strong bounce here could kick off a recovery move 📈
⚠️ On the flip side, a breakdown would confirm bearish continuation and shift momentum to the downside.
👀 This is a must-watch level — clean structure, high stakes.
Do you see SHIB bouncing from here or breaking below?
Not financial advice.
IREDA - Break out stockHi, as per the technical it break the resistance and retracement under progress. as per the Day chart it could be Bull run, let see. This is my view and kindly consider only for educational purpose. Kindly update your comment to improve the accuracy!

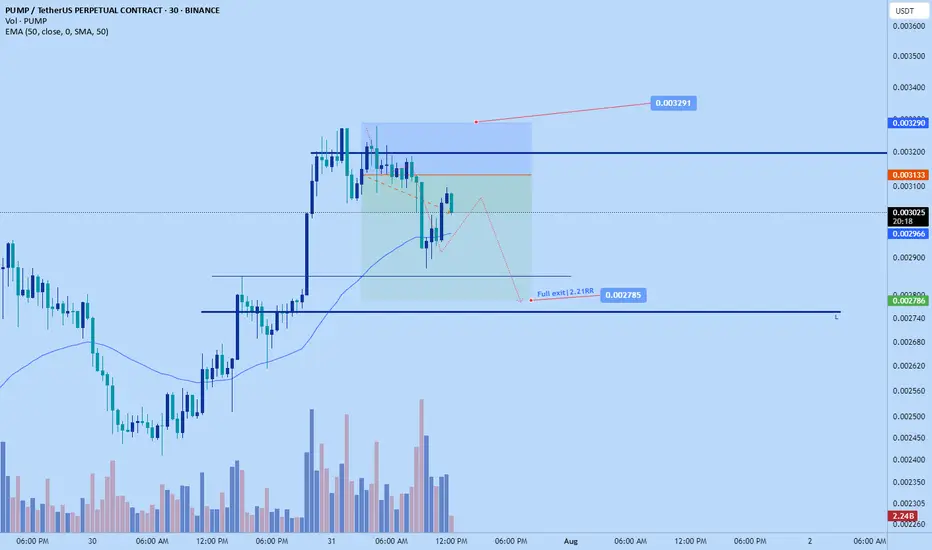
Pumpdotfun short to $0.002785Thought I shared this earlier. Shorted pumpdotfun . Aiming for $0.002785
It pumped up a bit...no pun intended but structrally its relatively high and likely to correct down again before continuation up.
DTT strategy applied, learn more about it on my x profile.
Sl: $0.003291....if want to hop on now can use 0.032 sl, a bit tigher to give roughly 1-2 RR and still provide good invalidation.
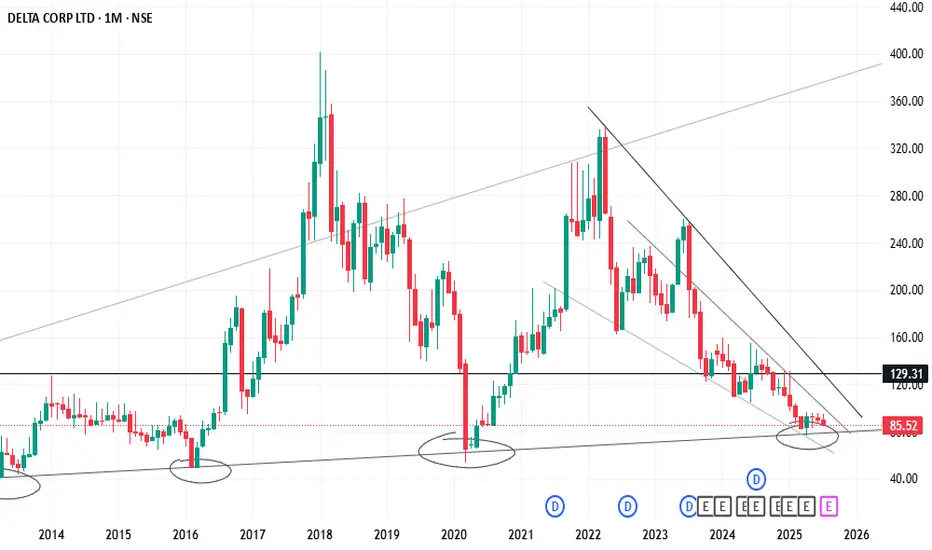
delta corp - Long term supportThis is purely education purpose.. As per the chart it took long term support, as per the previous scenario's it could be move towards resistance and target would be 350+++.. i kindly request your comments on the below
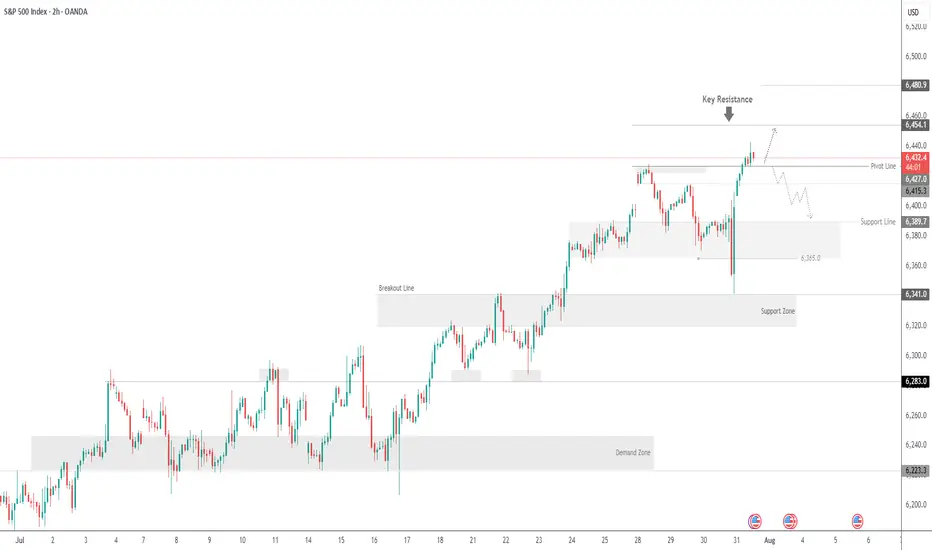
SPX500 Hits New Highs but Fed Caution Limits MomentumSPX500 Overview
Market Context:
The Fed's reluctance to commit to a rate cut in the upcoming September meeting has forced markets to reassess their outlook. This hesitation pushed Treasury yields and the US dollar higher in late trading, weighing on equities.
As it stands, the probability of a rate cut appears to be pushed further out on the timeline, introducing short-term headwinds for risk assets.
Technical Outlook:
SPX500 printed a new all-time high and maintains bullish momentum after stabilizing above the previous ATH at 6427. As long as the price holds above this level, the bullish continuation toward 6454 remains likely, with a further extension to 6480 possible.
A bearish correction would only be confirmed by a break below 6415.
Resistance Levels: 6454, 6480
Support Levels: 6415, 6389
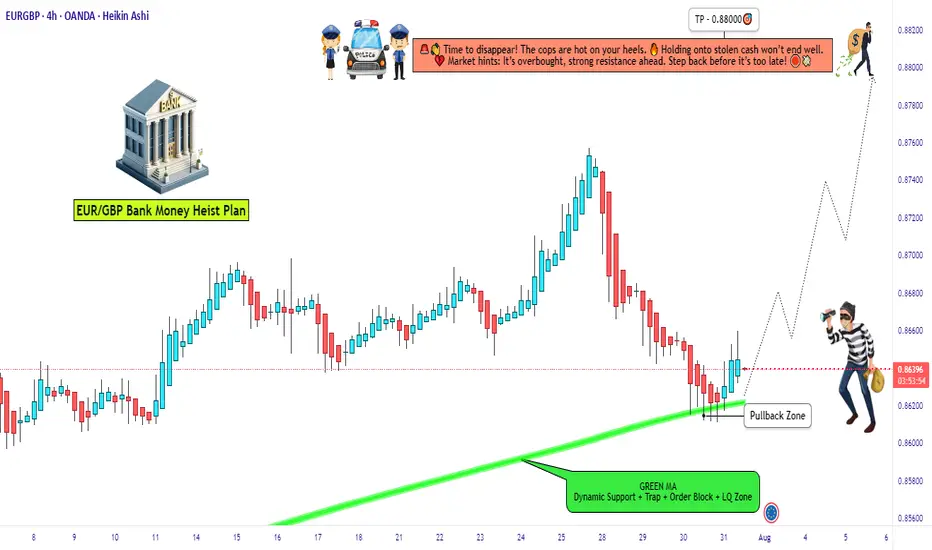
EUR/GBP Thief Trade: Swipe Profits Before Overbought Trap!🦹♂️ EUR/GBP "THE CHUNNEL HEIST" – BULLISH LOOT IN PROGRESS! 🚨💰
(Thief Trading Strategy – Escape Before the Cops Arrive!)
🎯 DEAR MARKET PIRATES & PROFIT SNATCHERS,
Based on our 🔥Thief Trading Style Analysis🔥, we’re executing a bullish heist on EUR/GBP ("The Chunnel"). The vault is wide open—time to swipe the loot before the high-risk resistance police barricade (aka overbought trap) shuts us down!
📜 THE MASTER PLAN:
✔ Entry (📈): "The Bullish Vault is Unlocked!"
Buy Limit Orders (15-30min TF) near recent swing lows/highs.
Thief’s DCA Trick: Layer entries like a pro robber—multiple limit orders for max loot.
✔ Stop Loss (🛑): "Hide Your Stash Wisely!"
SL at nearest 4H candle wick (0.86000)—adjust based on your risk appetite & lot size.
Remember: A good thief always has an escape route!
✔ Target (🎯): 0.88000 (or escape earlier if the cops get suspicious!)
🔎 SCALPERS & SWING BANDITS – LISTEN UP!
Scalpers: Stick to LONG-ONLY heists! Use trailing SL to protect profits.
Swing Thieves: If you’re low on cash, join the slow robbery—DCA & hold!
📡 WHY THIS HEIST IS HOT:
Bullish momentum in play (but BEWARE of overbought traps!).
Fundamental Drivers: Check COT Reports, Macro Data, & Sentiment.
🚨 TRADING ALERT: NEWS = POLICE RAID RISK!
Avoid new trades during high-impact news.
Trailing SL = Your Getaway Car! Lock profits before volatility strikes.
💥 BOOST THIS HEIST – STRENGTHEN THE GANG!
👉 Smash the LIKE & BOOST button to fuel our next market robbery!
👉 Follow for more heists—profit awaits! 🚀💰
🦹♂️ Stay Sharp, Stay Ruthless… See You on the Next Heist!
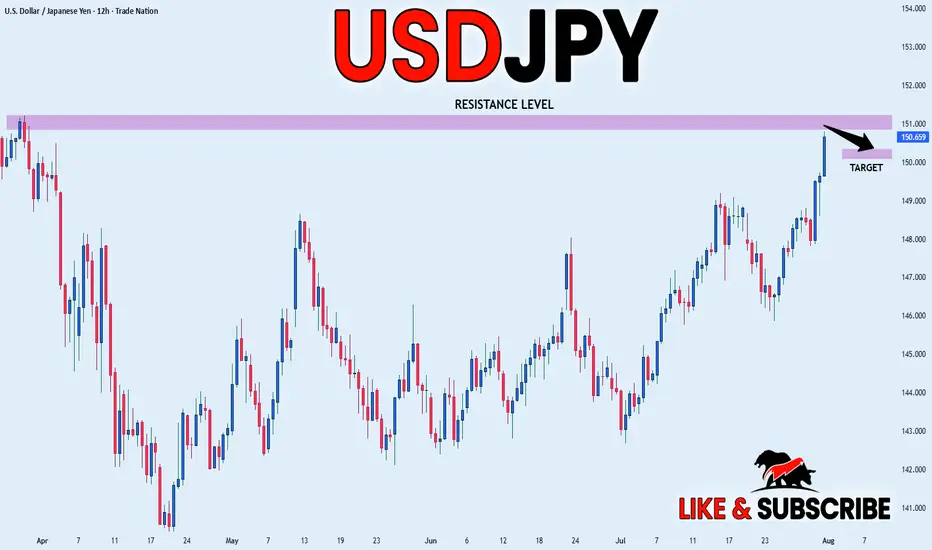
USD_JPY RESISTANCE AHEAD|SHORT|
✅USD_JPY is going up now
But a strong resistance level is ahead at 151.232
Thus I am expecting a pullback
And a move down towards the target of 150.368
SHORT🔥
✅Like and subscribe to never miss a new idea!✅
Disclosure: I am part of Trade Nation's Influencer program and receive a monthly fee for using their TradingView charts in my analysis.
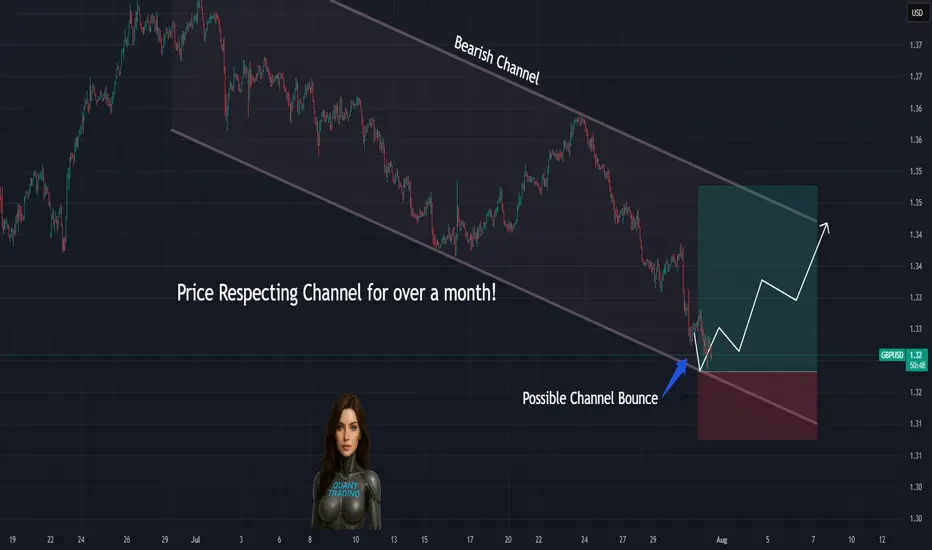
Price Doing Exactly What We Predicted… so farGBPUSD tapped the exact bottom of our marked channel and bounced — just as forecasted.
📌 Price respected structure to the pip
📌 Stoch RSI curling up right as expected
📌 Channel still in play, eyes on midline next
⏱️ Timeframe: 1H
#gbpusd #forex #chartprediction #backtest #channeltrading #technicalanalysis #tradingview
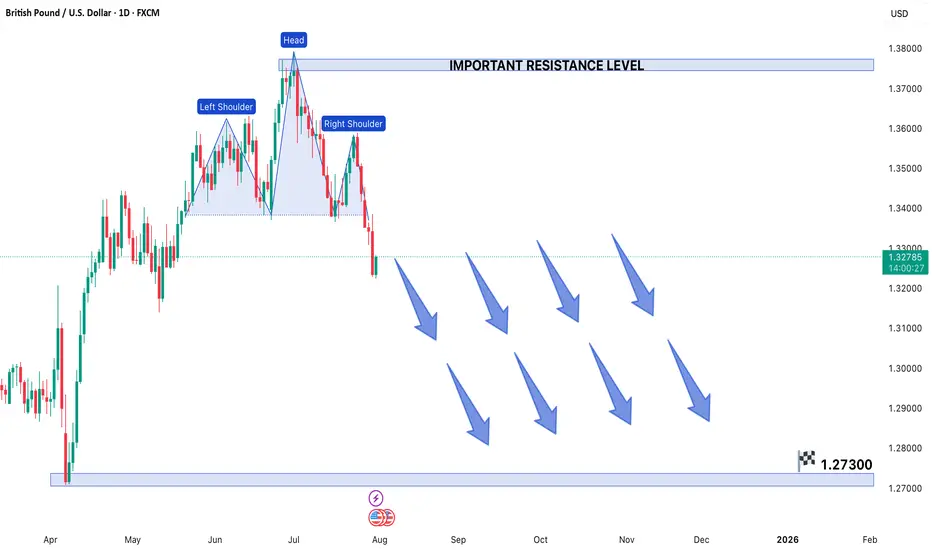
GBPUSD FORMS HEAD & SHOULDER PATTERN IN 1D TIME FRAME CHARTGBP/USD Forms Head and Shoulders Pattern - Bearish Breakdown Expected
The GBP/USD currency pair has developed a clear Head and Shoulders (H&S) reversal pattern on the 1-DAY chart, signaling potential weakness ahead. This technical formation - characterized by a central peak (head) flanked by two lower highs (shoulders) - suggests the recent uptrend may be exhausting as sellers gain control.
Current Market Structure
Price action remains confined within a bearish framework, making consistent lower highs and lower lows since failing at the pattern's right shoulder. The pair now tests critical support near the neckline of the H&S formation. A confirmed break below this level would validate the pattern and likely accelerate downward momentum.
Key Levels to Watch
- *Downside Target*: 1.27300 emerges as the next major support if bearish momentum sustains
- Resistance Zone: The 1.37900 level now acts as formidable overhead resistance
- Neckline Break: A daily close below current support would confirm the H&S pattern
Trading Implications
The technical setup favors:
1) Maintaining short positions while price holds below the right shoulder high
2) Watching for increased volume on breakdown moves to confirm bearish conviction
3) Considering long positions only if buyers reclaim 1.37900 resistance
Risk Factors
Traders should monitor:
- UK inflation data and BoE policy signals
- Fed interest rate expectations
- General USD strength across currency markets
This pattern projects approximately 900 pips of potential downside if fully realized. However, traders should wait for confirmed breakout momentum rather than anticipating the move, as false breakdowns remain possible in current market conditions. Proper position sizing and stop-loss placement above recent swing highs remains essential for risk management.
Note: Forex trading involves substantial risk. Always conduct your own analysis before entering positions.
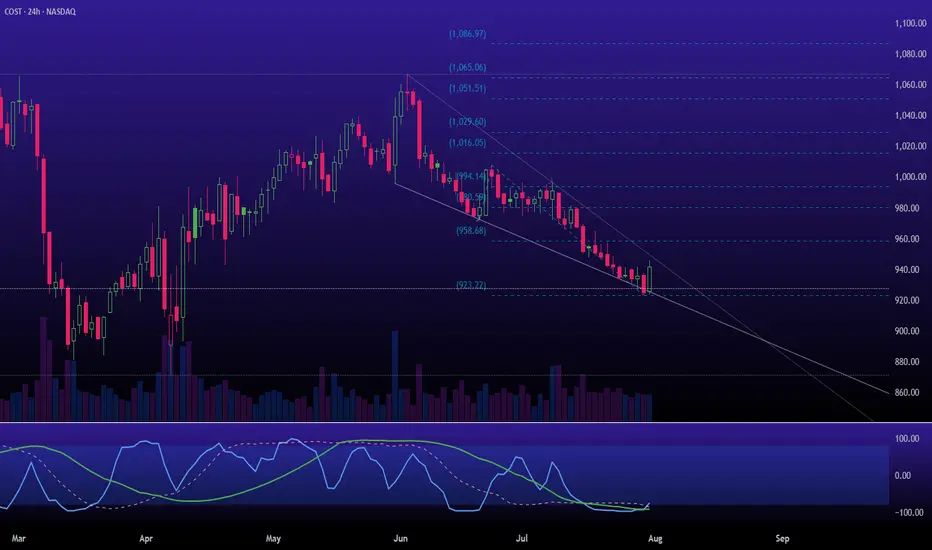
$COST is transiting from the Markup to the Accumulation (A)The squeezing and oversold momentum readings suggest the markdown is losing steam and "stopping action" may be occurring. We could be witnessing the area where a Selling Climax or preliminary support forms. I'm not looking for a new all-time high, but a trip to test resistance seems likely.
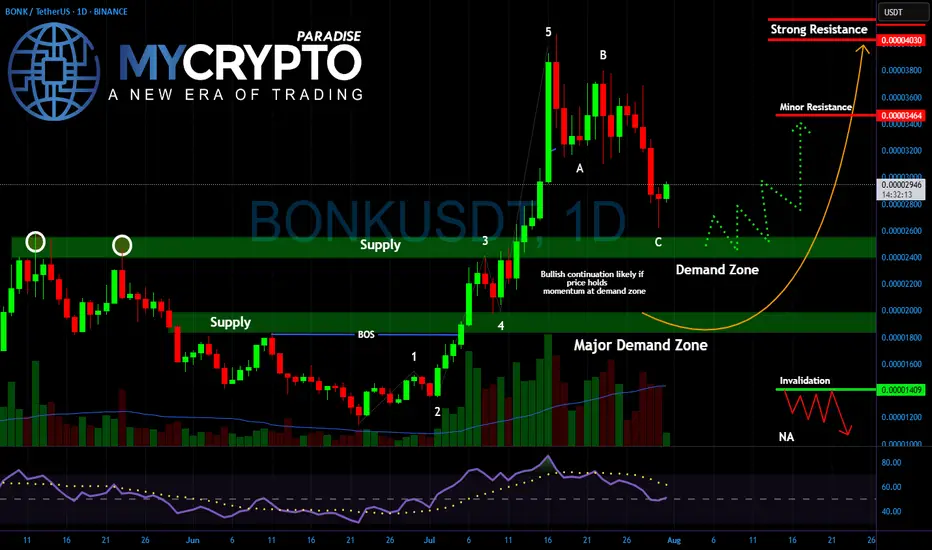
BONK About to Break Out or Break Down?Yello Paradisers! Are you ready for the next explosive move in #BONK? After nailing the last rally and spotting the impulsive 5-wave structure early, we’re now entering a critical phase — and what happens next could decide whether BONK flies or collapses.
💎The recent pullback has followed a clean A-B-C corrective structure, landing perfectly into the key demand zone between 0.00002600 and 0.00002200. This zone now acts as the battlefield between smart money buyers and weak-handed sellers. Price action is slowing down, volume is drying up, and RSI is resetting all classic signs of a potential bullish continuation. But if buyers fail to step in with conviction, the market could easily sweep lower to test the major demand zone closer to 0.00001800.
💎As long as price holds this area and confirms a reversal with follow-through momentum, we could see #BONK heading back toward 0.00003460 as the first stop, and possibly a retest of the 0.00004030 resistance. However, if price closes below 0.00001409, that would invalidate the bullish setup and confirm a deeper corrective phase.
Patience and strategy win the game, Paradisers! The market is designed to shake out weak hands before the real move happens.
MyCryptoParadise
iFeel the success🌴
$90 in next 6-12 months?I am buying this dip and expected it to hit 90 in 6-12 months based on tech analysis. All the best. Not a financial advise.

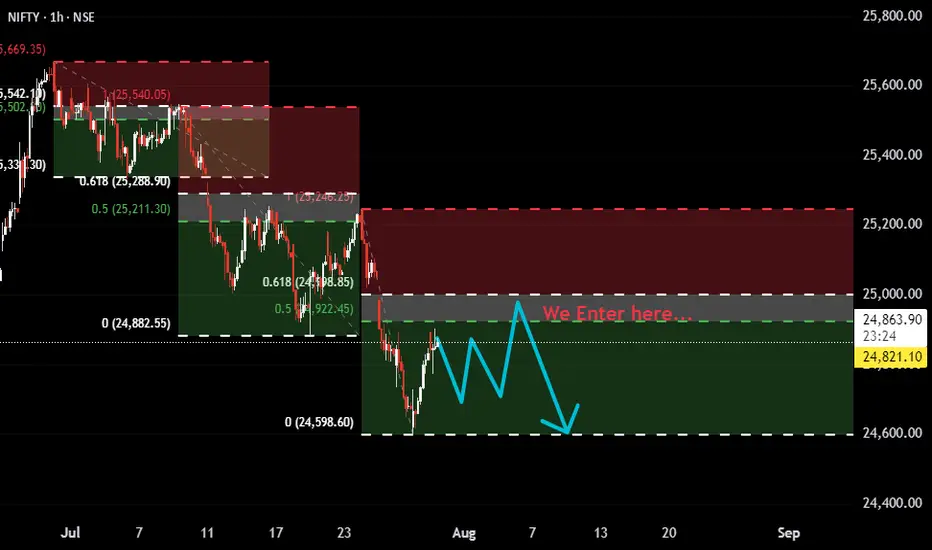
Nifty Bearish Setup: Watching 50–61.8% Fib Zone for Short EntryThis is more of an observation-based post rather than a trade setup.
It appears that Nifty, in its current bearish trend, is consistently respecting the 50–61.8% Fibonacci retracement zone before continuing downward. We’ve seen multiple pullbacks stall and reverse from this zone — making it a key area to watch.
🔸 If you're looking to short, avoid entering too early.
🔸 Let price pull back into the 50–61.8% zone, wait for structure or weakness to develop (e.g., reversal candles, BOS on lower timeframe), and then consider action.
🔸 Trying to catch tops or jumping in too soon can lead to poor entries and stop hunts.
This zone seems to be where sellers are stepping in with conviction.
Staying patient and respecting the structure can offer better entries and risk management.
⚠️ Disclaimer:
This is for educational and observational purposes only. I am not SEBI registered. Always do your own analysis before taking any trades.
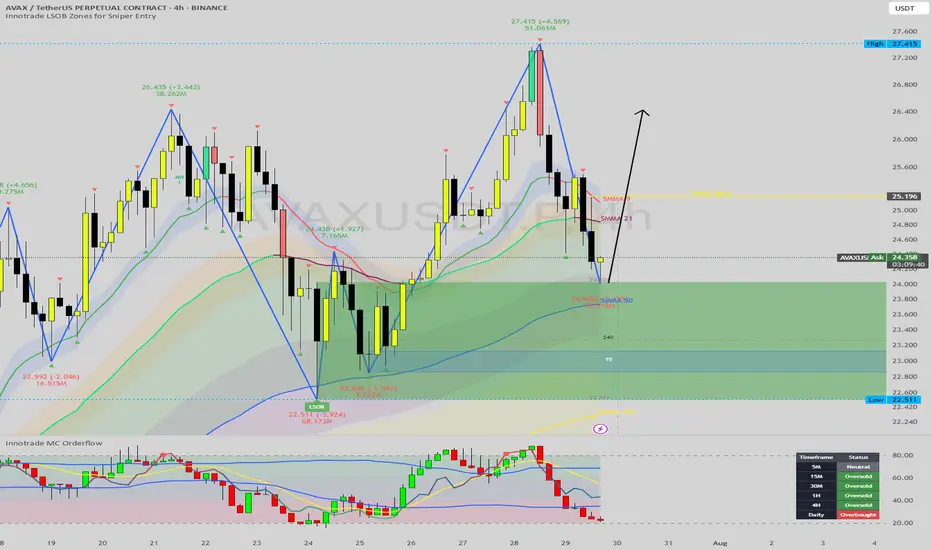
AVAX at the Golden Pocket: A High-Confluence Long Setup EmergesHello, traders. Today, we're analyzing Avalanche (AVAX), which has undergone a healthy and necessary correction after a powerful impulsive move upwards. Price has now pulled back to a critical decision point that is loaded with a confluence of technical support signals.
This analysis will break down, step-by-step, why the current price zone represents a high-probability area for a bullish reversal, potentially kicking off the next major leg up. This is an educational walkthrough demonstrating how to stack technical factors to build a strong trade thesis.
The Analysis: Stacking the Technical Confluences
A high-probability trade is rarely based on a single signal. It's built on multiple, independent factors all pointing in the same direction. Here is the confluence we are seeing on the AVAX 4H chart:
1. The Bullish Market Structure:
First, the context. The overarching trend for AVAX is clearly bullish. Our Zig-Zag indicator confirms a strong pattern of higher highs and higher lows. The current dip is, therefore, considered a corrective pullback within a larger uptrend, meaning we should be looking for buying opportunities, not fighting the trend.
2. The Golden Pocket (Fibonacci Retracement):
We've drawn a Fibonacci retracement from the beginning of the last impulsive leg up (
22.54)
Price has now pulled back precisely into the "golden pocket" between the 61.8% and 78.6% levels. This zone is a classic, high-probability area for trend continuation entries, as it often represents a point of equilibrium before the dominant trend resumes.
3. The Bullish LSOB (Liquidity Sweep Order Block):
The most significant signal in this area is the large green LSOB zone. This institutional footprint was formed after a sweep of a prior low and represents a major area of buying interest. The fact that the golden pocket lies directly within this LSOB provides a powerful layer of confirmation. Price has now entered this zone, effectively mitigating the imbalance and reaching a key area of demand.
4. Dynamic & Static Support Confluence:
Octo MA: The EMA 100 is flowing directly through the LSOB, providing a strong layer of dynamic support.
Daily Open: The Daily Open is situated just above, acting as an initial magnet and a potential first target for a bounce from this zone.
5. Momentum Exhaustion (Oscillator Analysis):
This is the final, critical piece of the puzzle. Our MC Orderflow oscillator in the sub-chart shows that selling momentum is deeply exhausted, with the lines pushing into the green oversold territory.
Critically, the Dashboard confirms this across multiple timeframes (5M, 15M, 30M, 1H, and 4H are all flashing "Oversold"). This is a powerful signal that sellers are losing control and the market is primed for a reversal, providing excellent timing for a potential entry.
The Potential Trade Plan
Based on this strong confluence, here is a potential trade plan:
Entry Zone: The current area between $23.50 and $24.80 (the LSOB / Golden Pocket) is the ideal entry zone.
Stop Loss: A logical stop loss can be placed just below the low of the LSOB and the 100% Fibonacci level, around $22.40. This invalidates the entire setup if hit.
Potential Targets:
Target 1: The Daily Open / 38.2% Fib level at ~$25.40.
Target 2: A retest of the recent swing high at $27.41.
Target 3 (Extension): If the trend resumes with strength, longer-term targets can be found at the 127.2% or 161.8% Fibonacci extension levels.
Conclusion
We have a powerful alignment of bullish market structure, a golden pocket retracement, a major institutional LSOB zone, dynamic MA support, and clear momentum exhaustion. This stack of confluences presents a compelling case for a long position on AVAX.
Disclaimer:
This content is for educational purposes only and does not constitute financial or investment advice. Trading carries a high level of risk. Please do your own research and consult with a professional financial advisor before making any investment decisions. You are solely responsible for any trades you take.