LTC long turm Accroding to VSFA+ A.o.A All
Accroding to VSFA+ Strategy, LTCusdt long trum dump expected
Trend Analysis

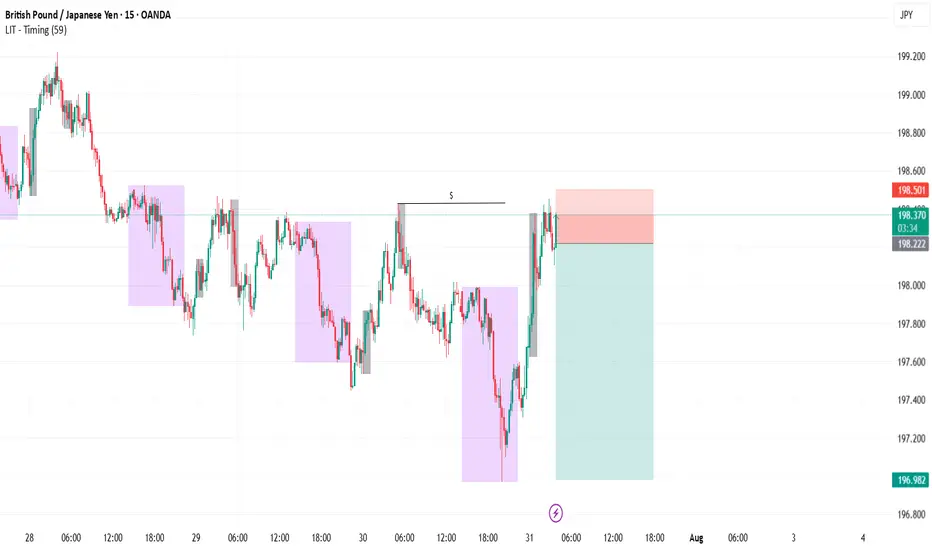
GBPJPY SellExternal structure is now bearish and the internal structure did a liquidity grab. Price should continue lower and go towards asia low to complete daily cycle.
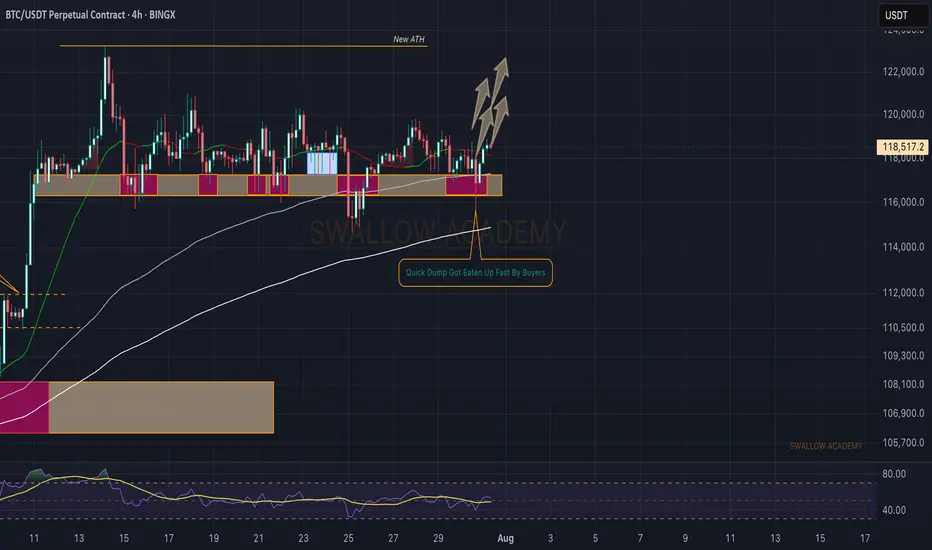
Bitcoin (BTC): Failed Dump | Buyers Still in Control Bitcoin recently had another wave of selling, where buyers once again showed their dominance near the local $116K zone and pushed the price of BTC back up.
We remain bullish, as we see the buyside dominance above the 116K area, so our target is still the current ATH; let's see.
Swallow Academy
Amazon (AMZN) Shares Rise Ahead of Earnings ReportAmazon (AMZN) Shares Rise Ahead of Earnings Report
Today, 31 July, Amazon is set to release its quarterly earnings after the close of the regular trading session. Available data show that Amazon (AMZN) shares are exhibiting bullish momentum, reflecting positive market expectations:
→ In July, AMZN shares have outperformed the S&P 500 index (US SPX 500 mini on FXOpen);
→ Yesterday, following the end of the regular session, AMZN shares surged by approximately 3% in after-hours trading.
The rise in AMZN comes amid strong earnings reports from other tech giants, such as Microsoft (MSFT) and Meta Platforms (META). For example, MSFT shares rose by more than 8% in post-market trading. Their success has likely fuelled optimism that Amazon’s upcoming report will also impress.
All of this has brought noticeable changes to the technical outlook for the AMZN stock price.
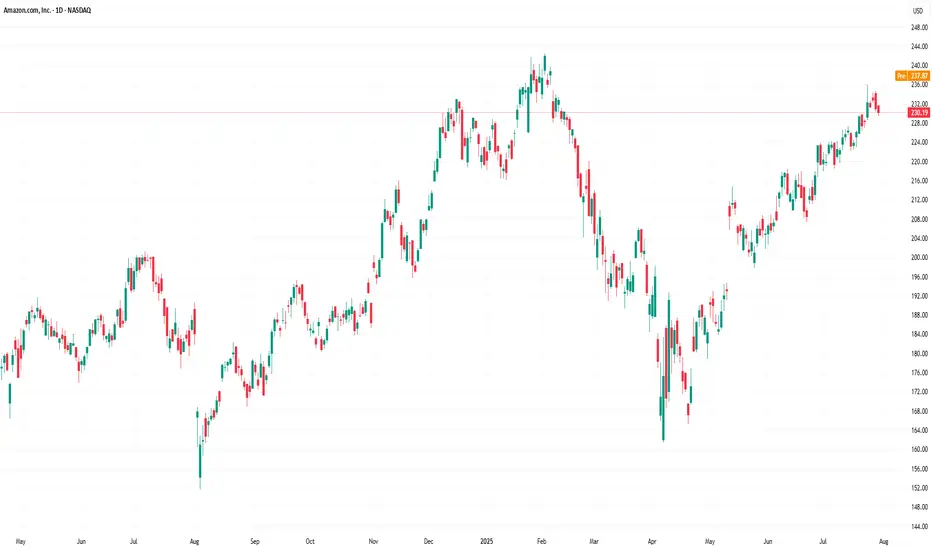
Technical Analysis of the Amazon (AMZN) Chart
Following the release of the previous earnings report, price movements have formed an upward channel, as indicated by the Regression Trend tool. However, in recent days, a series of bearish signals emerged:
→ On Thursday, AMZN broke above the $230 level (marked by an upward arrow), but the session closed well below the highs – a sign of selling pressure;
→ Friday and Monday’s sessions produced candles with small bodies, indicating market indecision;
→ On Tuesday, bears took the lead (marked by a downward arrow), with a relatively long candle closing near the session low.
Thus, the chart gave reason to assume that optimistic sentiments were waning. However, today’s session is likely to open near the $237.30 level, effectively negating the bearish interpretation of the previous five candles and shifting momentum back in favour of the bulls.
In this context:
→ Support could be provided by the $230 level as well as the median of the Regression Trend channel;
→ Key resistance could be found at the previous high of $242.23 and the psychological level of $250.
Whether AMZN can surge to a new all-time high will largely depend on the company’s performance in AI – a theme that remains highly relevant in 2025.
This article represents the opinion of the Companies operating under the FXOpen brand only. It is not to be construed as an offer, solicitation, or recommendation with respect to products and services provided by the Companies operating under the FXOpen brand, nor is it to be considered financial advice.
Microsoft Soars to Record High Following Strong Earnings ReportMicrosoft Stock (MSFT) Soars to Record High Following Strong Earnings Report
As the chart illustrates, Microsoft (MSFT) shares surged sharply after the close of the regular trading session – an immediate market reaction to the company’s strong quarterly results.
According to available data, MSFT's post-market price jumped to $555 per share, exceeding its previous all-time high by more than 8%.
Why Did MSFT Share Price Rise?
The quarterly report provided several reasons for optimism, including:
→ Earnings per share (EPS) came in at $3.65, beating analysts’ expectations of $3.37 by over 8%. Revenue also exceeded forecasts, totalling $76.4 billion versus the projected $73.9 billion.
→ Microsoft’s cloud revenue rose by 27% to $46.7 billion, while Azure’s annualised revenue exceeded $75 billion, driven by growing demand for AI-related services.
In response to these results, Barclays analysts quickly raised their price target for Microsoft shares from $550 to $625.
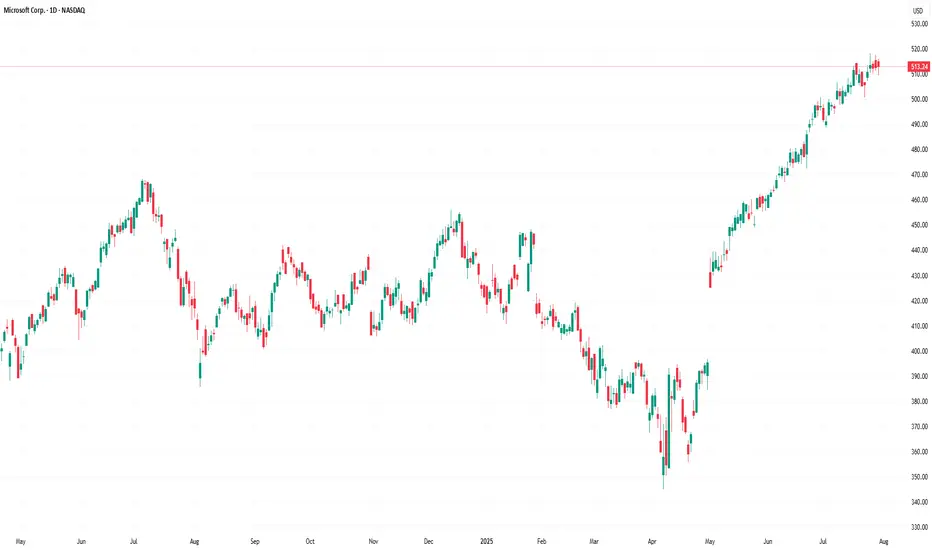
Technical Analysis of MSFT Chart
It is worth noting that the previous quarterly report was also strong, resulting in the formation of a large bullish gap on 1 May, followed by a sustained upward trend (highlighted by the purple trendline S). Importantly, the gap in the $395–425 range remains unfilled.
Yesterday’s report is also likely to result in a large bullish gap at the market open today, though this time, the market context could lead to a different scenario.
The key factor here is the long-term ascending channel (shown in blue), which reflects MSFT’s price movements throughout 2024–2025. After the previous strong report, the share price moved from the median to the upper boundary of the channel without setting a new record high. However, following the most recent report, the price has surged deep into overbought territory, potentially setting a multi-month high on the RSI and achieving a significant breakout to a new record.
As a result, once the initial excitement around the earnings subsides – and the desire of investors to close long positions intensifies – MSFT could undergo a correction from the upper boundary of the channel. In this scenario, the following support levels could come into play:
→ The psychological level of $550 in the short term;
→ The S trendline, as a possible support during a deeper correction.
This article represents the opinion of the Companies operating under the FXOpen brand only. It is not to be construed as an offer, solicitation, or recommendation with respect to products and services provided by the Companies operating under the FXOpen brand, nor is it to be considered financial advice.
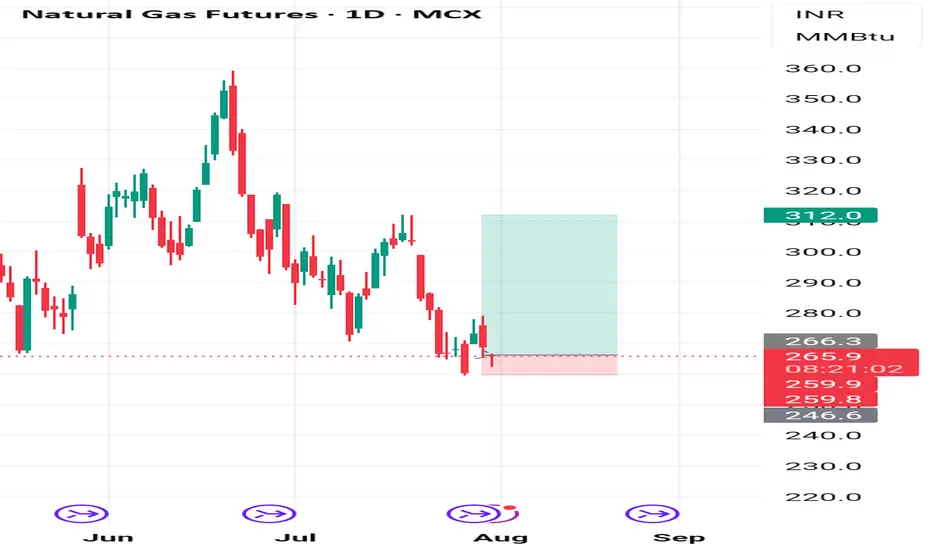
NatGas short term long opportunity Natgas MCX future may go upside target of 300+ from Cmp - 265 , SL - 259. If Buyer Accumulate and sustain level of 265 . Time horizon - 4-6 weeks
Trading balanceTrading balance The price of the asset has rebounded from the balance zone. With the prospect of growth into the resistance zone.
AUDUSD Will Keep Falling!
HI,Traders !
#AUDUSD keeps falling down
And the pair made a strong
Bearish breakout of the key
Horizontal key level of 0.64796
And the breakout is confirmed
So we are bearish biased and
We will be expecting a further
Bearish move down !
Comment and subscribe to help us grow !

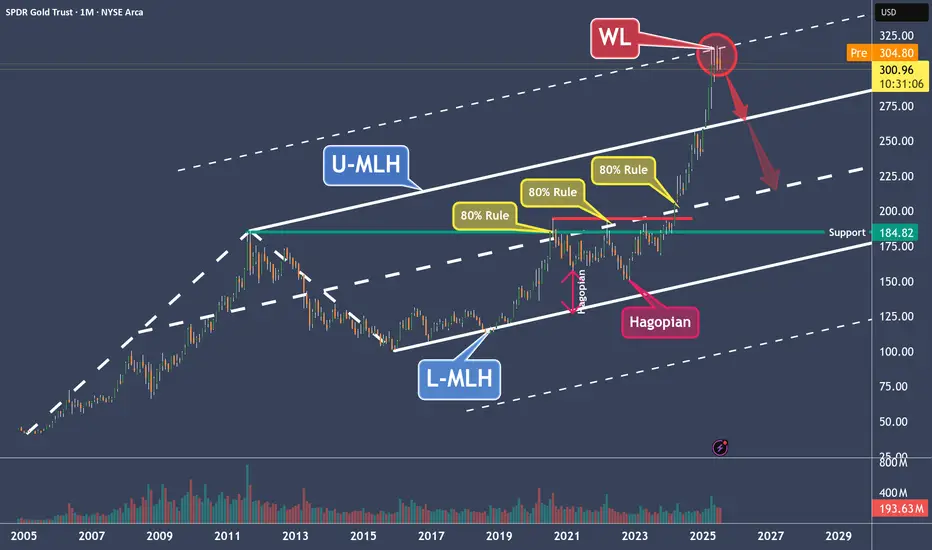
GLD – Why Gold Is a Clear Short to MePrice moved from the Lower Median Line (L-MLH) up to the Centerline, fulfilling the 80% rule.
Then we had two Hagopians, which sent price right back to the Centerline.
After the breakout above the Centerline, the next target was the Upper Median Line Parallel (U-MLH), which was reached rather quickly.
Finally, price broke above the U-MLH and was pulled up toward the Warning Line (WL).
Is this the end of the happy story?
I think so—because Gold has now reached its 2nd standard deviation, and there’s probably no more gas left in the tank.
The Trade:
- A logical target is the U-MLH.
- A secondary target is the Centerline.
At the very least, if you're long, this might be a good time to take some profits—because no tree grows to the moon.
For further details, I will follow-up with a Video explanation - See my Signature.
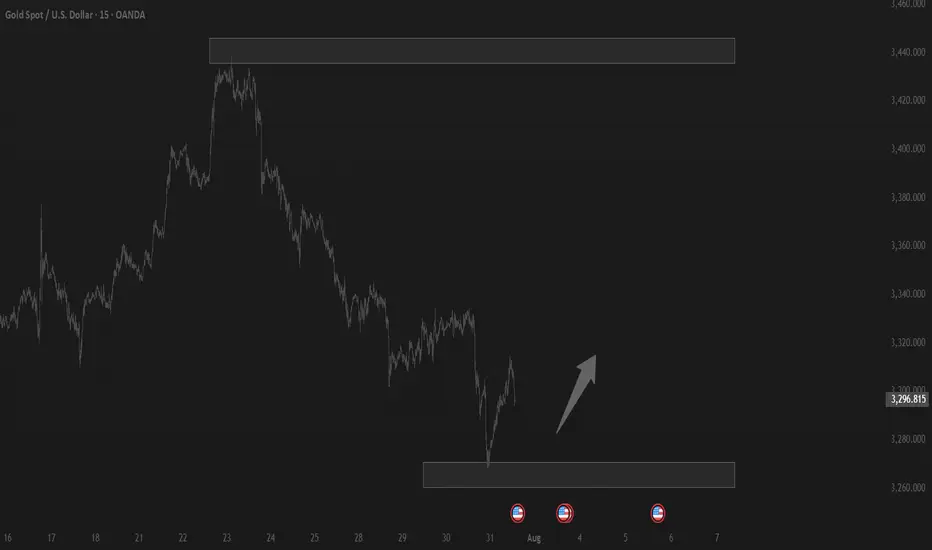
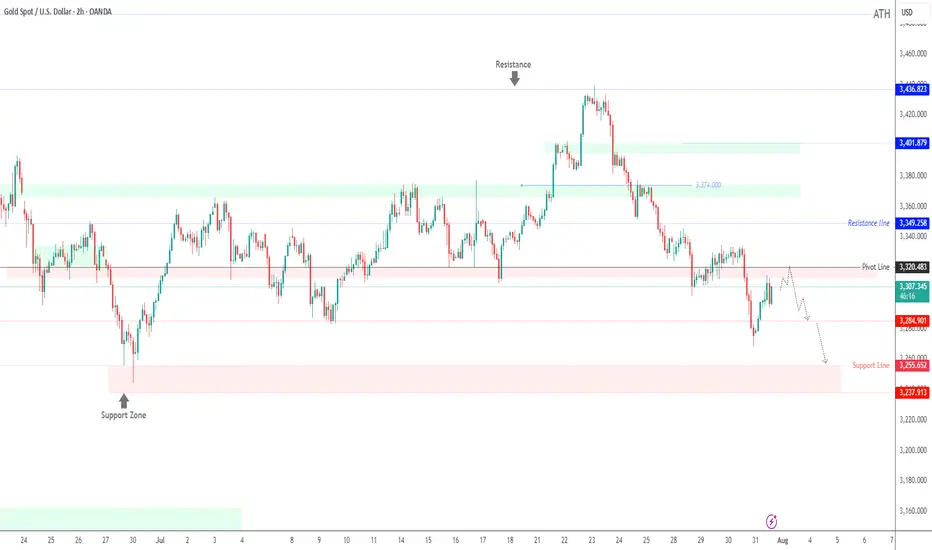
Gold Slips After Powell Speech Below 3320 Bearish Pressure BuildGOLD Overview
Market Context:
Gold declined from the 3333 level, as anticipated in yesterday’s analysis, ahead of Fed Chair Powell’s speech. Powell reiterated that it is still too early for rate cuts, citing persistently high inflation, which supported the U.S. dollar and pressured gold.
Technical Outlook:
As long as gold trades below the 3320–3310 zone, the bearish momentum is expected to continue, with the next target at 3285. A confirmed break and stability below 3285 could open the way toward 3255.
To regain bullish traction, the price must stabilize above 3320.
Support Levels: 3285 • 3255
Resistance Levels: 3333 • 3349
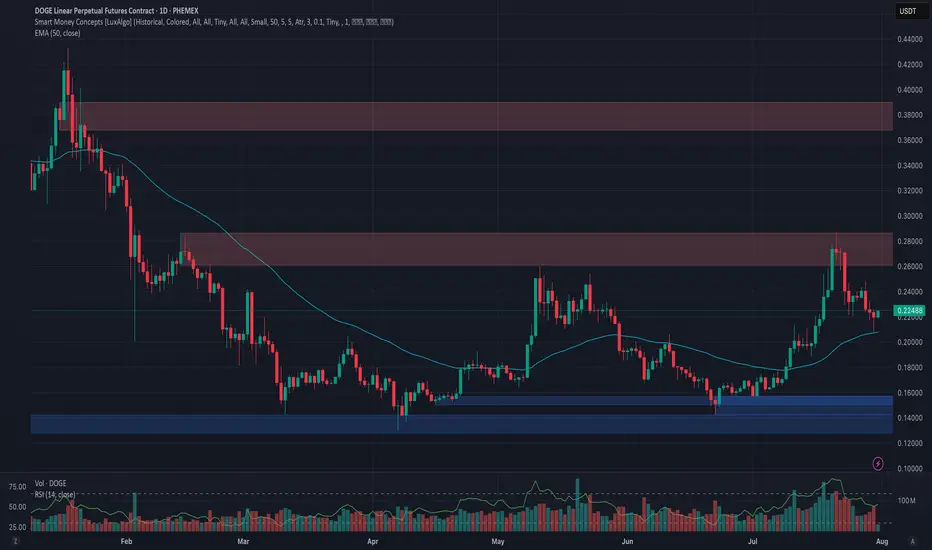
Phemex Analysis #101: Is Dogecoin (DOGE) Ready to Moon Again?Dogecoin ( PHEMEX:DOGEUSDT.P ), the original meme cryptocurrency, is once again capturing investor attention, fueled by impressive bullish movements. Currently trading around $0.2245, DOGE surged approximately 70% in July, decisively breaking the key resistance at $0.22 and challenging the next resistance level near $0.28.
With whale accumulation intensifying, renewed retail investor enthusiasm, and heightened speculation surrounding possible ETF approvals, Dogecoin appears poised to potentially sustain or even amplify its recent gains. But the key question remains: is DOGE truly ready to moon again, or is caution necessary following such rapid price movement?
Let’s carefully explore a few potential scenarios to inform your trading strategies:
Possible Scenarios
1. Bullish Continuation—Targeting Higher Levels
After successfully breaking above the crucial $0.22 resistance, Dogecoin could maintain its upward momentum if buying pressure remains strong. In this bullish scenario, DOGE might swiftly retest the immediate resistance at $0.25, then target higher levels near $0.28, and potentially surge toward the significant resistance at $0.39.
Pro Tips:
Entry Signals: Watch for a confirmed breakout above $0.25, especially if accompanied by rising trading volume, as a potential bullish entry point.
Profit-Taking: Strategically secure partial profits at resistance zones around $0.28 and $0.39.
Risk Management: Implement tight stop-loss orders just below the key support at $0.20 to guard against unexpected reversals.
2. Retest and Accumulation—Neutral Scenario
Given DOGE’s rapid price rise, a short-term pullback towards previous resistance-turned-support at $0.22 or even $0.20 is plausible. Such retracements, particularly on decreasing volume, might signal healthy consolidation, setting the stage for future bullish momentum.
Pro Tips:
Buying Opportunities: Look to accumulate DOGE if a low-volume pullback occurs toward support zones around $0.22 or $0.20.
Monitor Volume: Observe closely for decreasing trading volume during retracements, which typically indicates positive consolidation rather than a bearish reversal.
3. Bearish Scenario—Deeper Correction Possible
Should overall market sentiment shift negatively or DOGE fail to hold crucial support at $0.22, bearish pressure could escalate, potentially pushing Dogecoin down to deeper support levels around $0.198, and possibly as low as $0.15 or $0.13.
Pro Tips:
Risk Management: Consider reducing or exiting positions if DOGE decisively breaks below $0.22 on increased selling volume.
Long-Term Accumulation: Long-term holders may strategically accumulate DOGE at historically strong support levels ($0.15 or $0.13) once price stabilization occurs.
Conclusion
Dogecoin (DOGE) stands at a pivotal point, balancing bullish enthusiasm against the possibility of a correction. Traders should carefully monitor resistance at $0.25, the critical support at $0.22, and closely observe volume dynamics. By strategically aligning their trades with these outlined scenarios and employing disciplined risk management, traders can confidently navigate DOGE’s volatility and potentially capitalize on its next significant move.
🔥 Tips:
Armed Your Trading Arsenal with advanced tools like multiple watchlists, basket orders, and real-time strategy adjustments at Phemex. Our USDT-based scaled orders give you precise control over your risk, while iceberg orders provide stealthy execution.
Disclaimer: This is NOT financial or investment advice. Please conduct your own research (DYOR). Phemex is not responsible, directly or indirectly, for any damage or loss incurred or claimed to be caused by or in association with the use of or reliance on any content, goods, or services mentioned in this article.
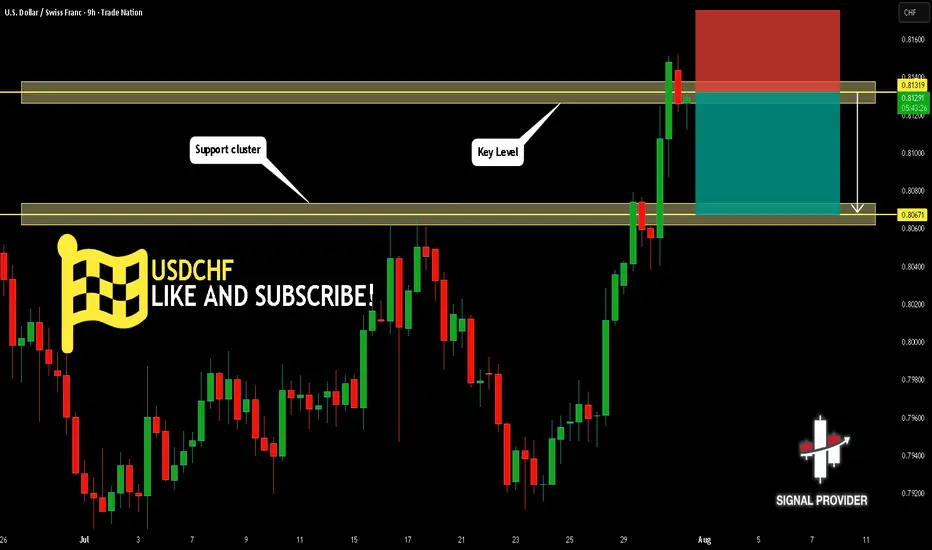
USDCHF Will Go Down From Resistance! Short!
Take a look at our analysis for USDCHF.
Time Frame: 9h
Current Trend: Bearish
Sentiment: Overbought (based on 7-period RSI)
Forecast: Bearish
The market is approaching a key horizontal level 0.813.
Considering the today's price action, probabilities will be high to see a movement to 0.806.
P.S
We determine oversold/overbought condition with RSI indicator.
When it drops below 30 - the market is considered to be oversold.
When it bounces above 70 - the market is considered to be overbought.
Disclosure: I am part of Trade Nation's Influencer program and receive a monthly fee for using their TradingView charts in my analysis.
Like and subscribe and comment my ideas if you enjoy them!
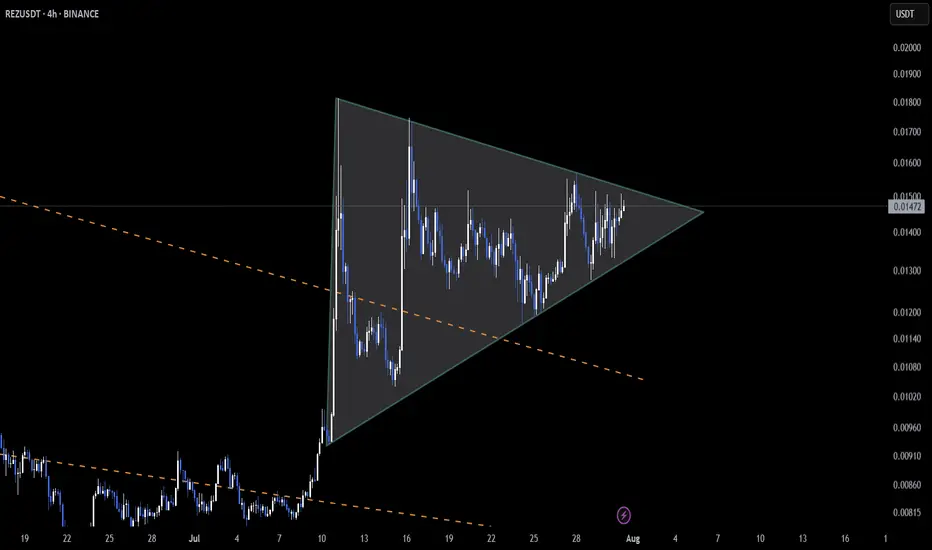
REZ Tightens Into Apex With Breakout Pressure Building AMEX:REZ is winding up inside a symmetrical triangle on the 4H chart 🔺—and it’s nearing decision time.
The price is approaching the apex with reduced volatility, often a sign that a sharp move is around the corner.
Earlier, AMEX:REZ broke out of a falling wedge, but follow-through was weak. This current structure might be the second shot—if volume steps in, momentum could finally shift higher 📈
👀 Compression is tight, and breakout pressure is real.
Will bulls take control this time or is another fade incoming?
Not financial advice.
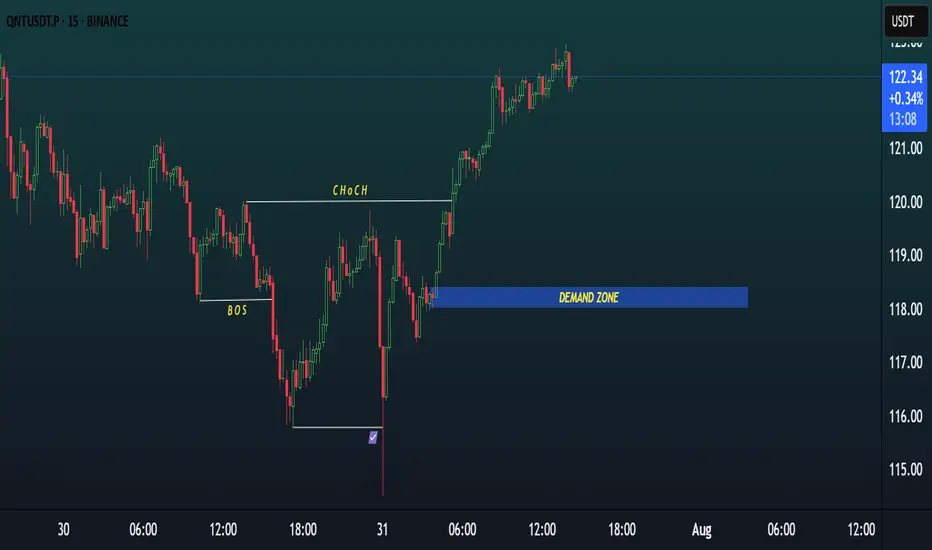
QNT/USDT 15m SETUP.QNT/USDT 15m Setup 🔥
Price made a strong Change of Character (ChoCH) to the upside, confirming bullish intent.
After the shift, price rallied and created a clean Demand Zone around $117.80–$118.50.
✅ Now waiting for a potential pullback to this zone for a high-probability long entry.
SMC-based setup — wait for confirmation before entry
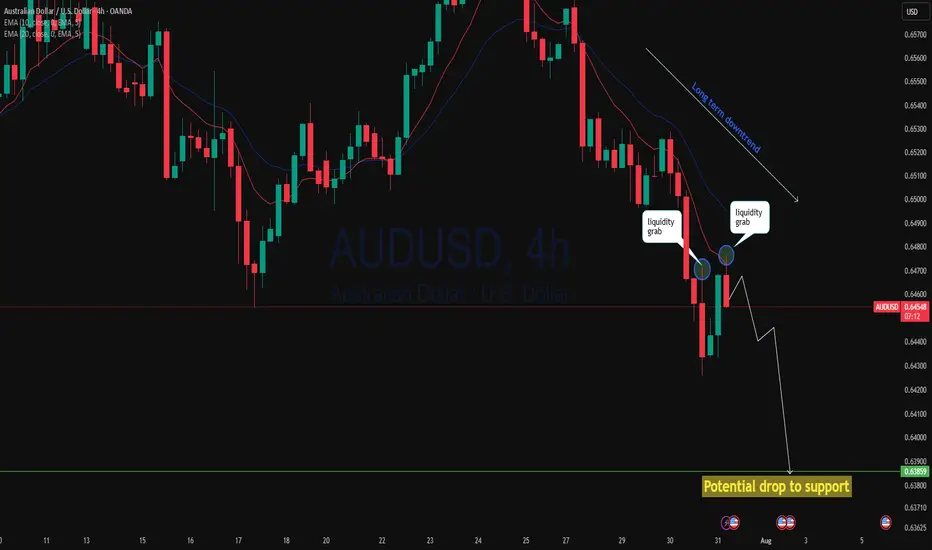
AUDUSD 2 step liquidity grab and drop?AUDUSD 4h has rejected twice from a key area after yesterday's massive breakdown with AUD negative data. Price has done a narrow pullback then this session is rejecting again with a stronger momentum could continue to drop to support. As 4h price action showing strong bearish move we may see continuation of the down trend!
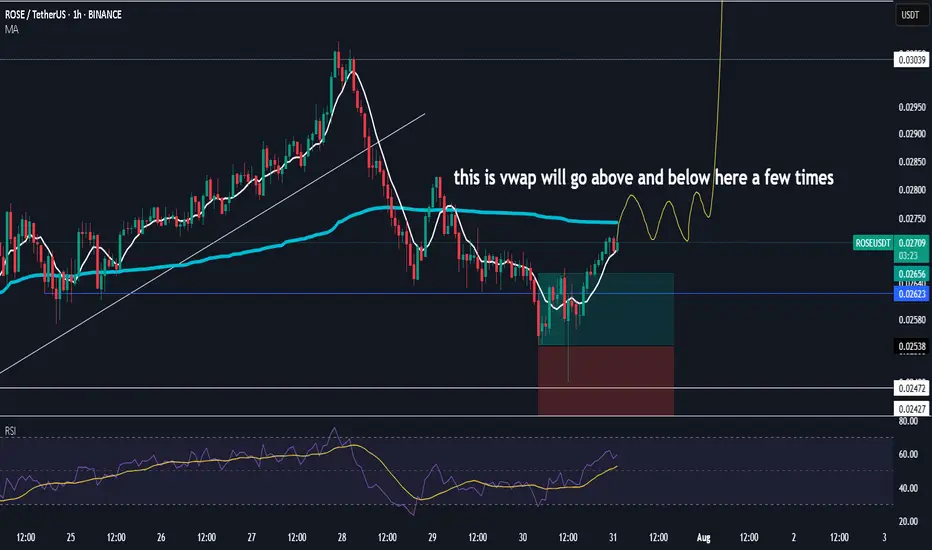
$roseno brainer buy her looking for 6c then higher after the pullback
let see what we get still lagging here compared to last cycle
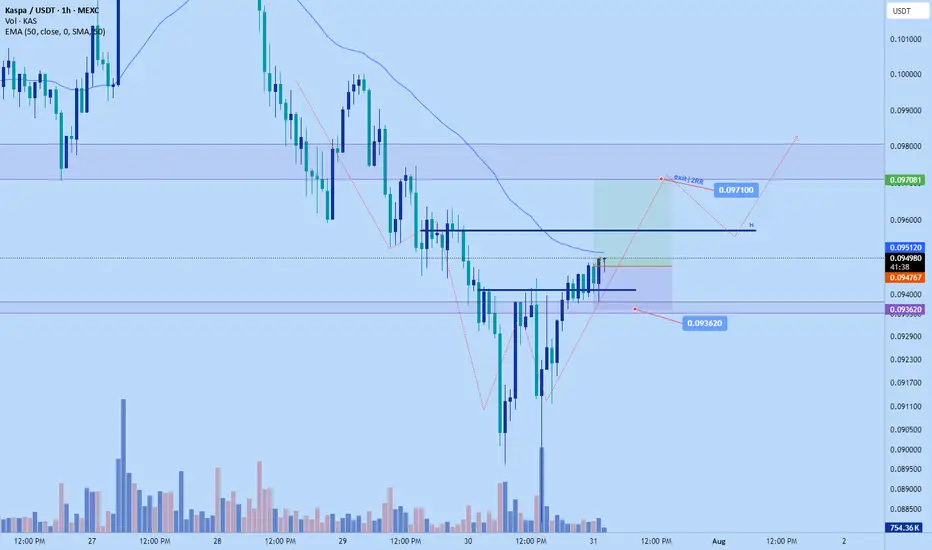
Kas scalp long to $0.0971Just now opened a long position on Kas. Based on the bulls are gaining control right now and the price is relatively low on htf
Setup aligns wit my DTT strategy
Sl: $0.093620
Time sensitive.
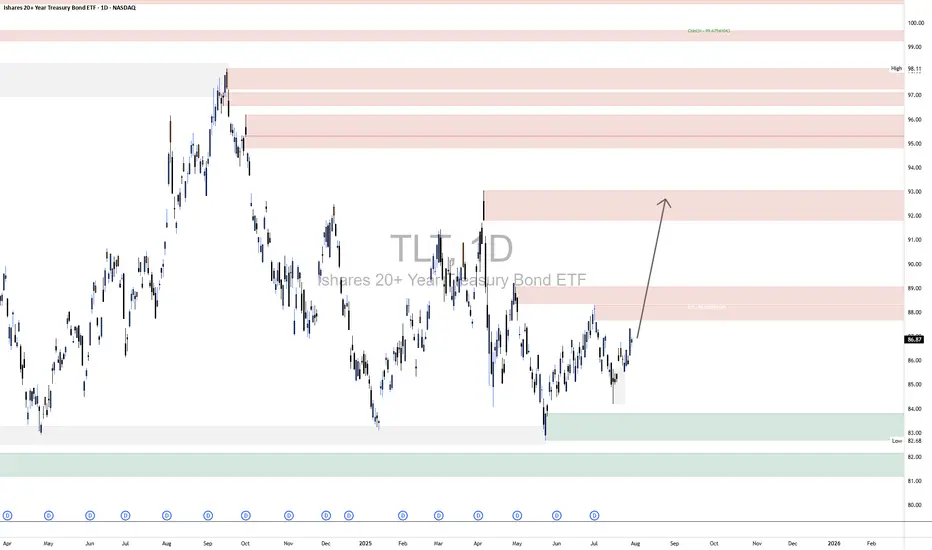
TLT LongThe broader market structure on the TLT 1D chart shows a clear downtrend, followed by a Change of Character (CHoCH) when price broke above the lower high near $86.50, signaling a potential trend reversal. This CHoCH is further validated by a strong push off the demand zone around $83–$84, where buyers stepped in with conviction, leading to a series of higher lows and an emerging bullish structure.
The demand zones below, especially the wide green area near $82.68–$84, are strong; price previously reversed sharply from this level, indicating institutional interest. In contrast, the supply zones between $88–$93 appear layered and moderately strong, especially around $88.20 and $92.70, where price previously sold off. However, the lack of deep wicks and clean rejections in the lower supply zones suggests that sellers may be weakening.
Currently, price is pushing upward toward the $88–$89 zone with bullish momentum. Within the marked region, price is climbing steadily after forming a minor higher low. If it can break above $88.20 convincingly, the next logical target would be the supply near $92.70–$93. A minor pullback to the $85.50–$86 zone could offer a buying opportunity if demand holds.
The trade bias is bullish with an expected continuation toward $92.70, assuming momentum holds. Invalidation of this outlook would occur if price breaks back below $84.00, which would indicate a failed breakout and potential return to the broader bearish trend. Momentum currently favors buyers, with higher closes and strong-bodied candles confirming upward intent.
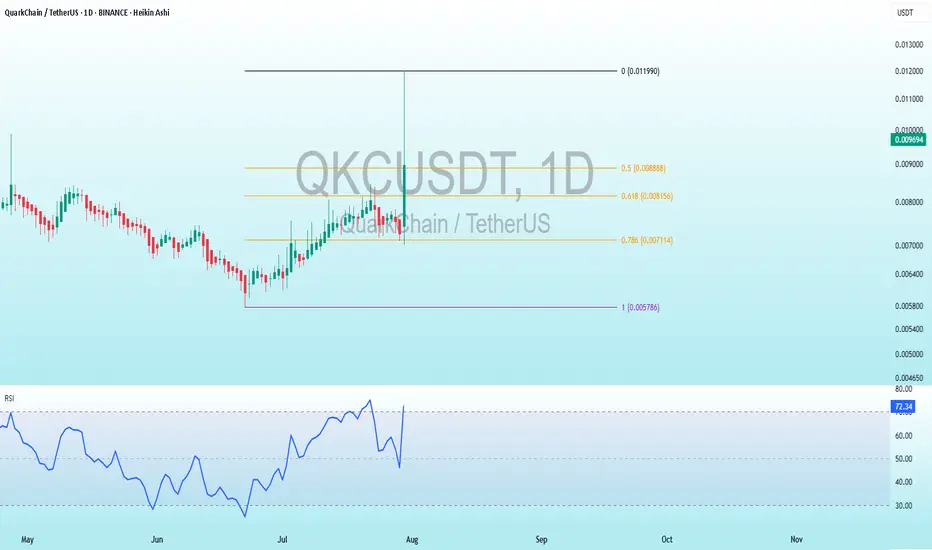
QKC Bearish DivergenceBINANCE:QKCUSDT
Trade Setup:
Target 1: 0.008888 (0.5 Fibonnaci Golden Zone).
Target 2: 0.008156 (0.618 Fibonnaci Golden Zone).
Target 3: 0.007114 (0.786 Fibonnaci Golden Zone).
Target 4: 0.005786 (1 Fibonnaci).
Stop Loss: 0.011990 (0 Fibonnaci).
RSI Analysis: The RSI is showing a bullish divergence, suggesting potential bullish momentum. The current RSI is around 72.29, approaching overbuy territory, so caution is advised.
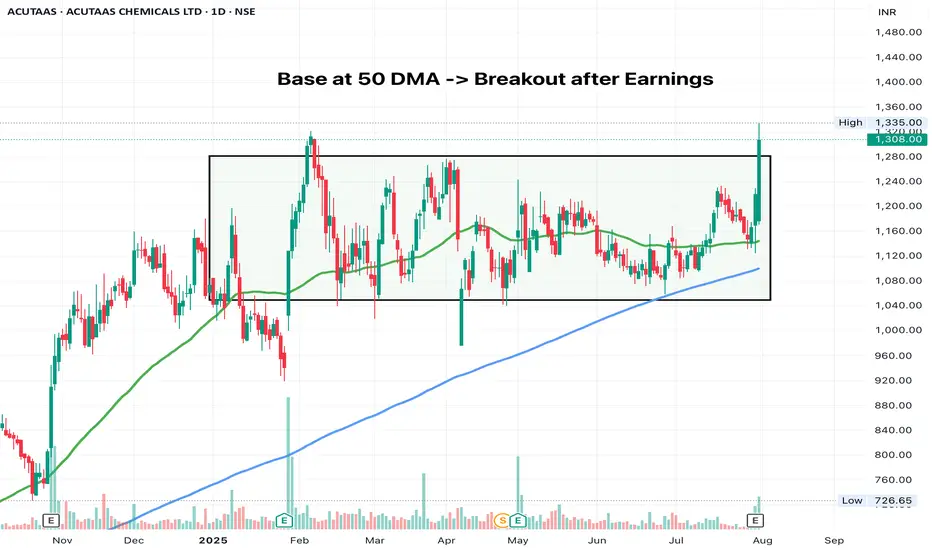
ACUTAASWait for a follow through day to enter, seeing the momentum fade out in this stock after earnings. Although the candle this time is strong.
Platinum Breakout Stalk: Thief Entry Only After Confirmed🧠 Thief's Heist Plan Activated!
Asset: XTI/USD (PLATINUM) 💎
Strategy: Bullish Pullback + Breakout Play 💥
🔍 We stalking platinum's neutral zone… waiting for that clean breakout!
No early entries, no premature SLs. Discipline = Profits. 🎯
🎯 Entry: After breakout confirmed. Use multiple DCA limit orders to layer in like a ghost.
🔐 Stop Loss: ONLY after breakout – Place at 1280.00 🛡️
💎 Target: 1560.00 – Vault unlock point! 💰
📵 DO NOT place SL or orders before breakout – patience is the thief’s edge. 🧘♂️
This isn’t gambling... this is precision trading. Breakout = green light 🚦
Get ready to raid the platinum vault!
#ThiefTrader #BreakoutStrategy #PlatinumHeist #XTIUSD #BullishSetup #SmartMoneyMoves
