LtcLtc lproject looks promising
Solid owners who define the true value of crypto
I don’t see any reason this turns bearish anytime soon
Trend Analysis

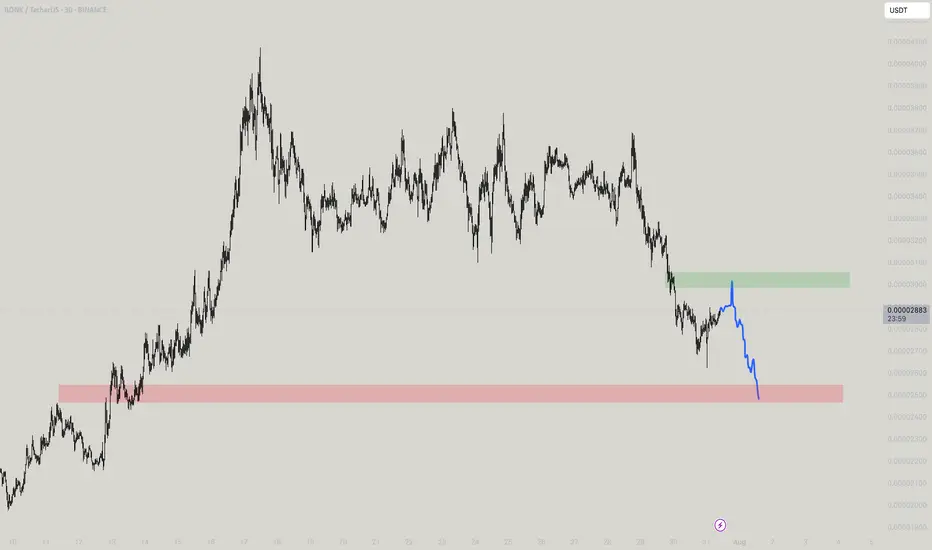
Boink - I Bonk You!I bonk you!!!! Don't you think buying here aint good? But selling here might be? Or just dont get too bulish with bonk
ETHUSDT - SCalp your day!Small scalps, extreme targets on yellow mid targets on the green, Keep in mind that a temp spike can happen for a fall, to a great extent, maybe?

Will BTC ever reach 130k?Yes in your dreams, I am joking, it can but not now, blue shows what fall can trigger when massive selloff happens, and here it looks the smaller momentum to happen soon!

Xrp - This is the bullrun breakout!🔑Xrp ( CRYPTO:XRPUSD ) breaks the triangle now:
🔎Analysis summary:
After the recent bullish break and retest, Xrp managed to already rally another +100%. This is a clear indication that bulls are still totally in control of cryptos and especially Xrp. It all just comes down to the all time breakout, which will then lead to a final parabolic rally.
📝Levels to watch:
$3.0
SwingTraderPhil
SwingTrading.Simplified. | Investing.Simplified. | #LONGTERMVISION

BitcoinBitcoin/TetherUS (BTC/USDT) Trading Analysis - Jul 15, 2025
Key Observations:
Price Movement:
Current Price: $117,692.46
24h Change: -2,148.72 (-1.79%)
Range: Low of $116,250.00 to High of $119,940.83
The price is currently near the lower end of the day's range, indicating bearish pressure.
Support and Resistance:
Support Levels:
Strong Support: $112,000.00 (marked as S/L)
Intermediate Support: $113,500.00 and $110,000.00
Resistance Levels:
Immediate Resistance: $119,900.00
Higher Resistance: $120,000.00 and $122,500.00
Profit Levels:
The "Profit" section lists potential take-profit targets, with the highest at $135,000.00.
The price has recently dipped below the $120,000.00 psychological level, suggesting weakening bullish momentum.
Trend Context:
The chart spans from June to September, but the current price action (July) shows consolidation after a potential pullback from higher levels.
The presence of multiple support levels ($112K–$116K) suggests a critical zone for buyers to defend.
Actionable Insights:
Bearish Short-Term: The price is below key levels ($119,900–$120,000) and has broken below $118,250.00. A retest of support at $112,000.00 is plausible.
Bullish Reversal Signal: If BTC holds above $112,000.00 and reclaims $120,000.00, it could target $122,500.00 or higher.
Risk Management: A break below $112,000.00 (S/L) may trigger further downside toward $110,000.00 or lower.
Conclusion:
The market is currently in a corrective phase. Traders should monitor the $112,000.00 support for potential reversals or breakdowns. A close above $120,000.00 would shift bias to bullish.

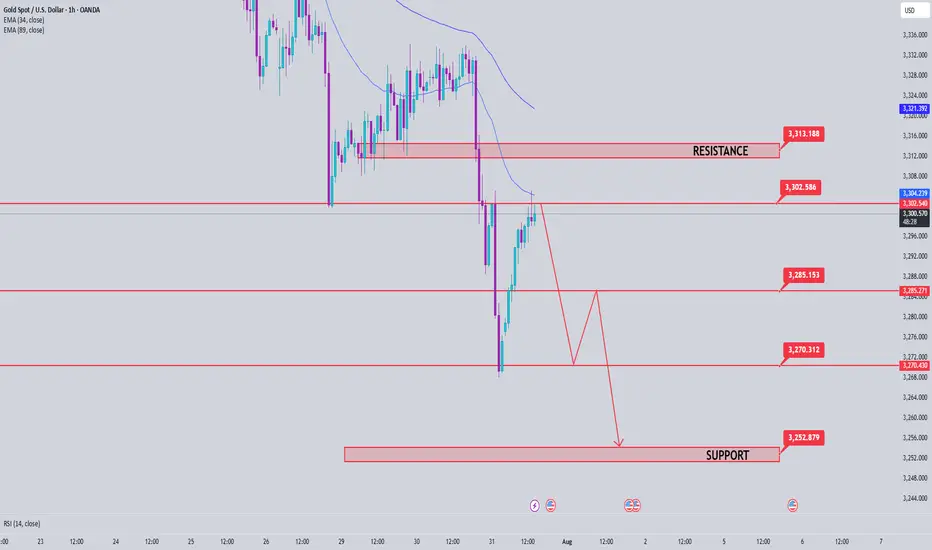
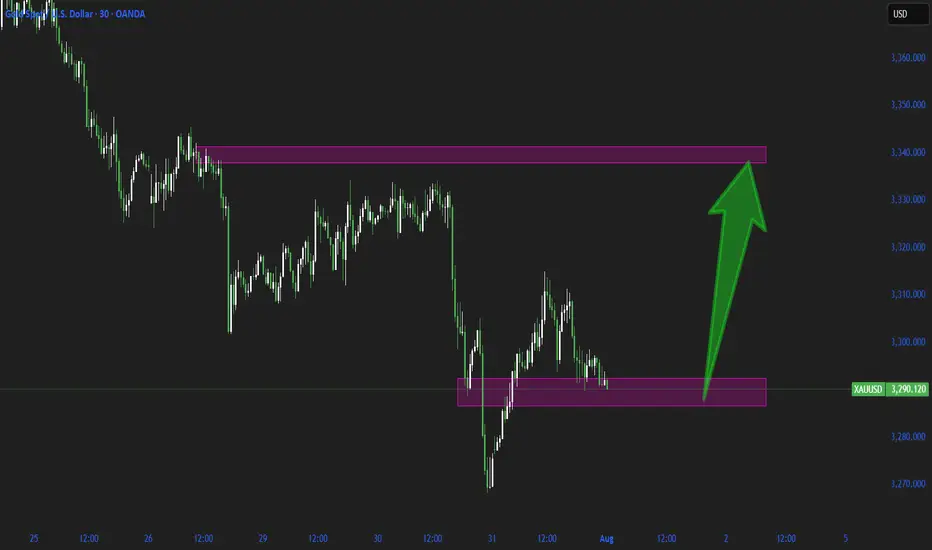
Gold price analysis July 31XAUUSD – Bearish pressure still prevails, watch for SELL in the direction of the trend
Yesterday's session witnessed a strong decline when the D1 candle closed with selling pressure up to 60 prices, forming a key candle that shapes the trend. When the market forms a main candle, the 25% and 50% candle body areas are often important price areas to continue trading in the direction of the main trend.
In the current context, the priority strategy will be to sell in the direction of the downtrend when the price rebounds to the resistance areas and there is a rejection signal.
🔹 Important resistance areas:
3301 – 3312 – 3333
🔸 Target support areas:
3285 – 3270 – 3250
🎯 Trading strategy:
Prioritize SELLing at the resistance area of 3301–3312 when there is a price reaction (rejection).
Target: 3250
BUY only considered when 3313 area is broken decisively.
Staying disciplined and sticking to the reaction price zone will be key in the context of the market moving in a clear trend.
i confuse !!!i see bearish engulfing candle stick in weekly time frame what is going on a big retracement await of just trick us???!!

EURGBP key support at 0.8613The EURGBP remains in a bullish trend, with recent price action showing signs of a corrective pullback within the broader uptrend.
Support Zone: 0.8613 – a key level from previous consolidation. Price is currently testing or approaching this level.
A bullish rebound from 0.8613 would confirm ongoing upside momentum, with potential targets at:
0.8708 – initial resistance
0.8740 – psychological and structural level
0.8770 – extended resistance on the longer-term chart
Bearish Scenario:
A confirmed break and daily close below 0.8613 would weaken the bullish outlook and suggest deeper downside risk toward:
0.8580 – minor support
0.8544 – stronger support and potential demand zone
Outlook:
Bullish bias remains intact while the EURGBP holds above 0.8613 A sustained break below this level could shift momentum to the downside in the short term.
This communication is for informational purposes only and should not be viewed as any form of recommendation as to a particular course of action or as investment advice. It is not intended as an offer or solicitation for the purchase or sale of any financial instrument or as an official confirmation of any transaction. Opinions, estimates and assumptions expressed herein are made as of the date of this communication and are subject to change without notice. This communication has been prepared based upon information, including market prices, data and other information, believed to be reliable; however, Trade Nation does not warrant its completeness or accuracy. All market prices and market data contained in or attached to this communication are indicative and subject to change without notice.

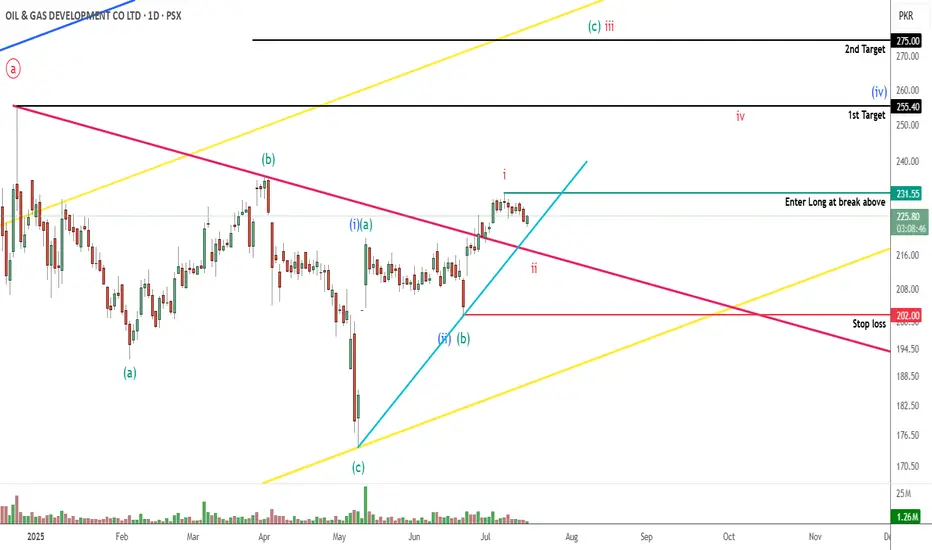
OGDC PROBABLY IN WAVE ' B ' OR ' C ' - LONGThis is in continuation to our ongoing tracking of OGDC wave structure.
If our wave count is correct then prices will take support from the 220-210 levels and will target the upside level of 255 and 275. Our wave count suggest that prices might even go above 300+ but that depends on how strong the bullish move is, if the move stays strong then price will target the upper yellow trendline.
Alternately, if price goes below the 202 level, it will take price well below 174.
We will buy 25% positions at 220-210 levels (ideally 218-216) and 75% at the break above 231.56
Trade Setup:
Entry level: 217 & 231.56
Stop loss: 202
Targets:
T1: 255
T2: 275
T3: Yellow trendline
Let see how this plays, Good Luck!
Disclaimer: The information presented in this wave analysis is intended solely for educational and informational purposes. It does not constitute financial or trading advice, nor should it be interpreted as a recommendation to buy or sell any securities.
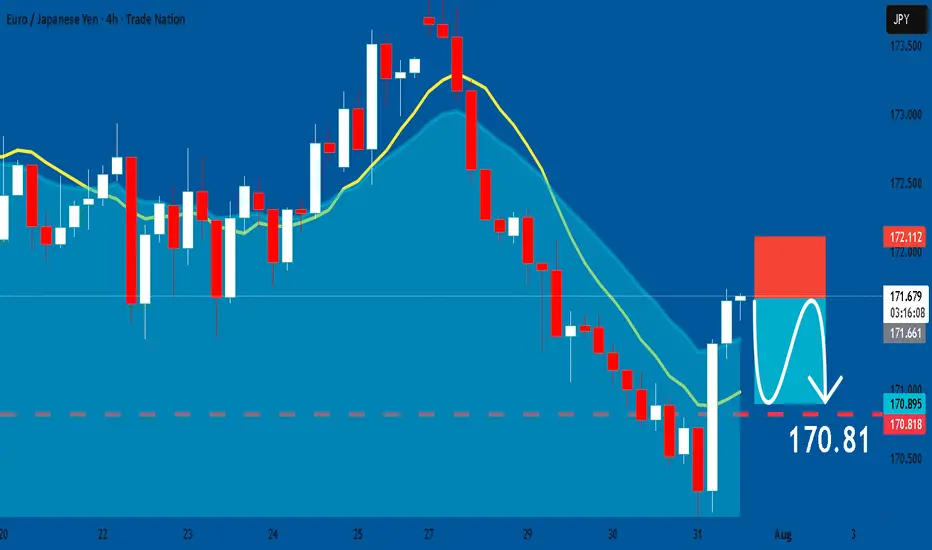
EURJPY: Short Trade Explained
EURJPY
- Classic bearish formation
- Our team expects pullback
SUGGESTED TRADE:
Swing Trade
Short EURJPY
Entry - 171.66
Sl - 172.11
Tp - 170.81
Our Risk - 1%
Start protection of your profits from lower levels
Disclosure: I am part of Trade Nation's Influencer program and receive a monthly fee for using their TradingView charts in my analysis.
❤️ Please, support our work with like & comment! ❤️
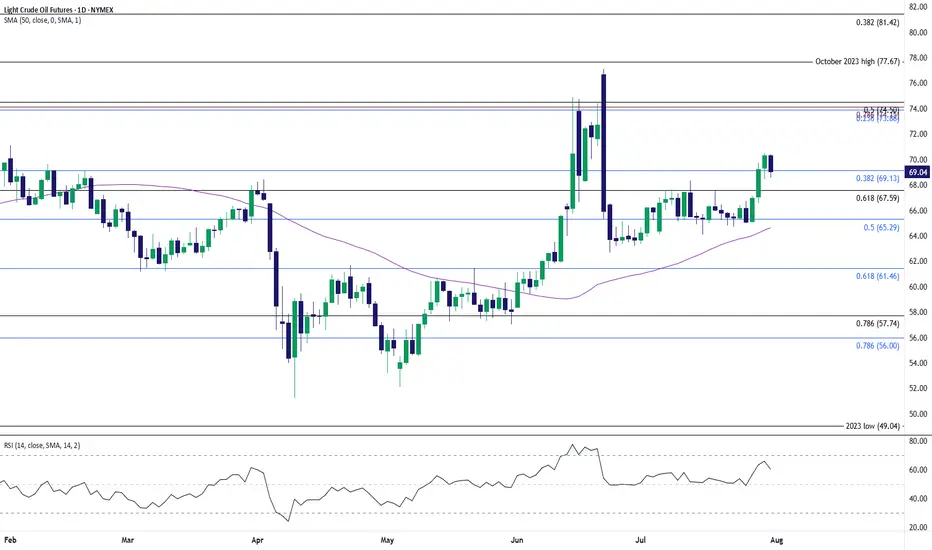
Oil Price Pulls Back to Keep RSI Out of Overbought ZoneThe recent rally in oil appears to have stalled as it struggles to extend the bullish price series from earlier this week, with the Relative Strength Index (RSI) pulling back ahead of overbought territory.
Lack of momentum to hold above the $67.60 (61.8% Fibonacci retracement) to $69.10 (38.2% Fibonacci retracement) zone may push the price of oil toward $65.30 (38.2% Fibonacci retracement), with a breach of the monthly low ($63.36) bringing $61.50 (61.8% Fibonacci retracement) on the radar.
At the same time, the price of oil may defend the advance from earlier this week should it hold above the $67.60 (61.8% Fibonacci retracement) to $69.10 (38.2% Fibonacci retracement) zone, with a move/close above the $73.90 (23.6% Fibonacci retracement) to $74.50 (50% Fibonacci retracement) region bringing the June high ($77.09) on the radar.
--- Written by David Song, Senior Strategist at FOREX.com
Nifty 50 analysis I have done my nifty analysis as we enter august month expiry. July has been a volatile month with 5 week and corporate results.

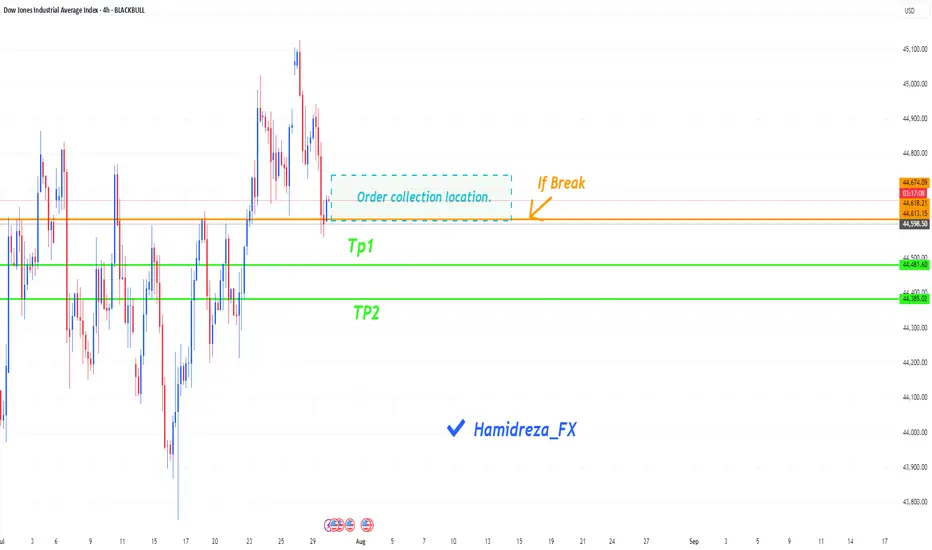
Will the Dow Jones continue its correction?
Hi everyone
The indicator may continue to correct itself by breaking the condition written in the figure (with an orange line). There is a blue box on the figure that shows the place where orders are collected. It is possible that buy orders will be placed in this area and then the downward trend will begin.
What percentage of the probability do you think there is of reaching the specified targets?
Be sure to follow me because you can make good profits from the market.
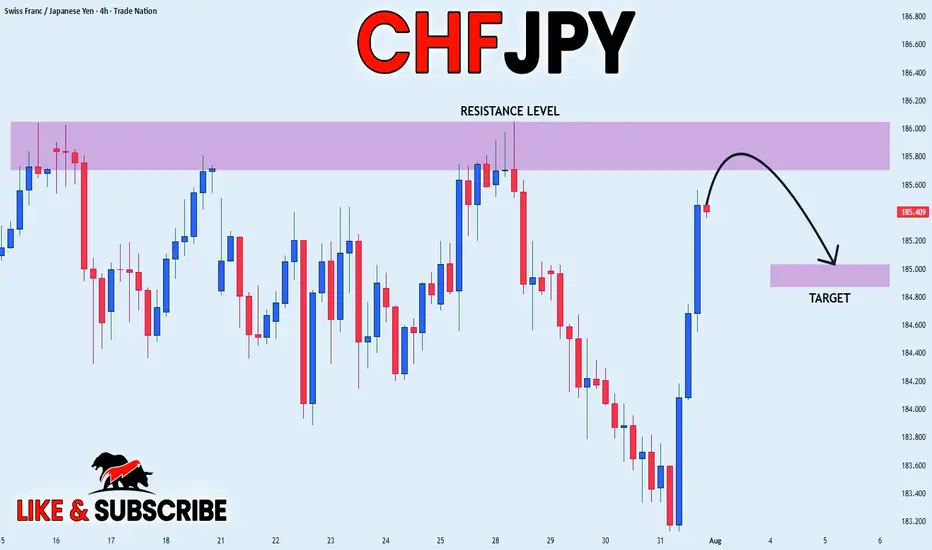
CHF_JPY LOCAL SHORT|
✅CHF_JPY has been growing recently
And the pair seems locally overbought
So as the pair is approaching a
Horizontal resistance of 186.000
Price decline is to be expected
SHORT🔥
✅Like and subscribe to never miss a new idea!✅
Disclosure: I am part of Trade Nation's Influencer program and receive a monthly fee for using their TradingView charts in my analysis.
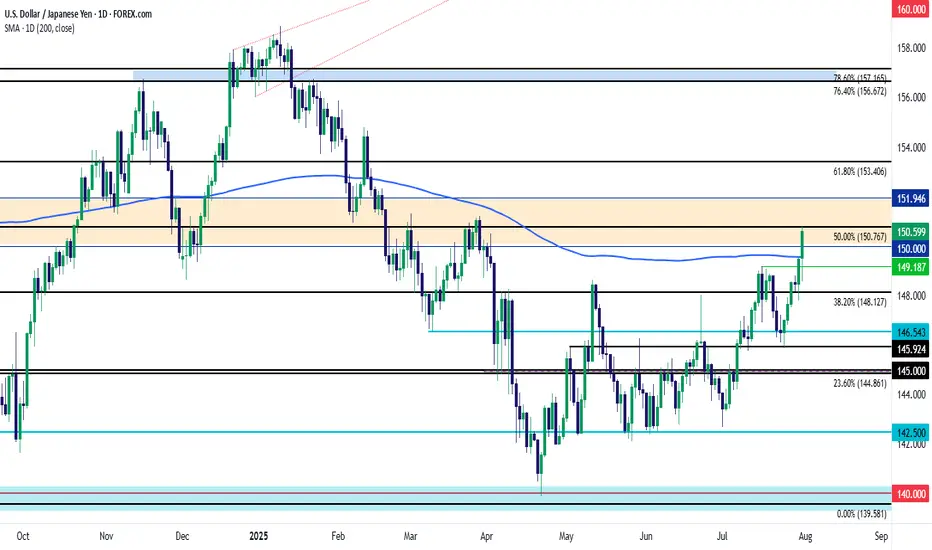
USD/JPY BreakoutUSD/JPY has had a big week already and the pair has shown a decisive breakout through a massive spot of resistance on the chart.
Coming into the week the 148.00 zone had been problematic for bulls in the pair since early-Q2 trade. But with the combined force of FOMC and the Bank of Japan, bulls have finally been able to prod a breakout and leave that zone behind. And the move has continued to press, with a breach of the 150.00 psychological level and price is now approaching the Fibonacci level at 150.77.
Chasing is a challenge at this point but given that prior resistance there's now multiple spots to track for support potential on pullbacks. The 150.00 level is an obvious one, but there's also the 200-day moving average which currently plots around 149.55 and there's the prior high of 149.19. Even the Fibonacci level at 148.13 could be of interest for that in prolonged pullback scenarios, given how it had played as support on Wednesday ahead of the FOMC announcement. The key for that level would be prices holding a higher-low, illustrating a degree of bullish defense at that price. - js
Market Expectations for Gold (XAU/USD)Gold is currently in a very critical zone, and in my view, it has room to rise toward the 3339–3345 level.
Once that zone is touched, I expect another drop to follow.
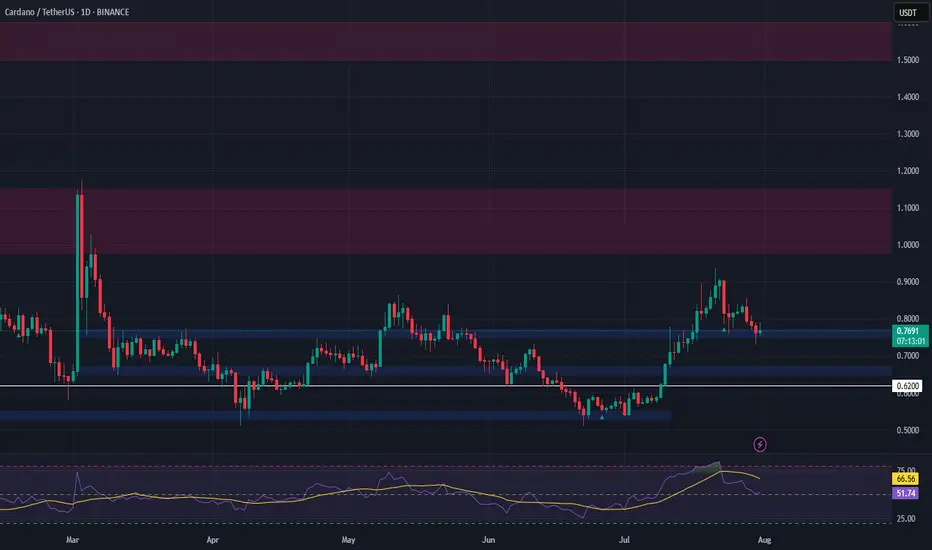
ADA Setup – Eyeing Entry After 70%+ RallyCardano (ADA) has surged over 70% in recent weeks. A healthy pullback is underway, and we’re watching the key support zone for a potential long entry targeting the next leg higher.
📌 Trade Setup:
• Entry Zone: $0.65 – $0.67
• Take Profit Targets:
o 🥇 $0.98 – $1.15
o 🥈 $1.50 – $1.60
• Stop Loss: Just below $0.62
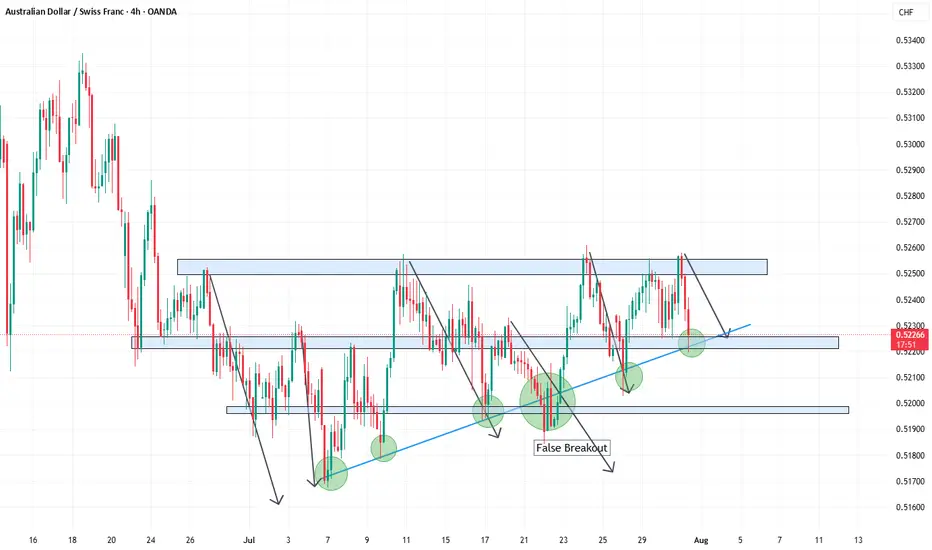
AUDCADThe price is currently at a key level. We need confirmation on the 15-minute or 5-minute timeframe before considering a long entry.
USDJPY (daily analysis) 1/8hi everyone hope everyone had a great week and have a great weekend happy trading as always

Gold Next Move (Read description). Hello, Traders.
As you saw we have achieved our target at last ideas.
This week gold is running in down trend, today it has touched the price 3268 and then gold pumped.
As you see guys, gold has breakout the last support area and its support became resistance.
Gold has changed the character according to H1 and there is break of structure (BOS).
The trend is bearish, so gold needs to fall, it can fall till 3351.
Comment positive feedbacks, Thanks.

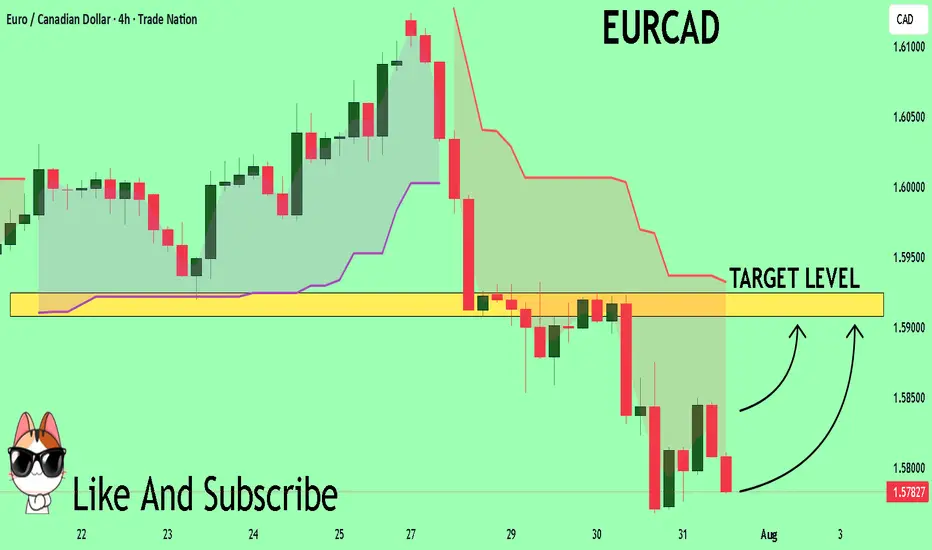
EURCAD What Next? BUY!
My dear friends,
My technical analysis for EURCAD is below:
The market is trading on 1.5784 pivot level.
Bias - Bullish
Technical Indicators: Both Super Trend & Pivot HL indicate a highly probable Bullish continuation.
Target - 1.5907
About Used Indicators:
A pivot point is a technical analysis indicator, or calculations, used to determine the overall trend of the market over different time frames.
Disclosure: I am part of Trade Nation's Influencer program and receive a monthly fee for using their TradingView charts in my analysis.
———————————
WISH YOU ALL LUCK
buy gbpaudwe reach to support level and have a up trend and now price reach to a demand zone and we have spin candles and we enter...
