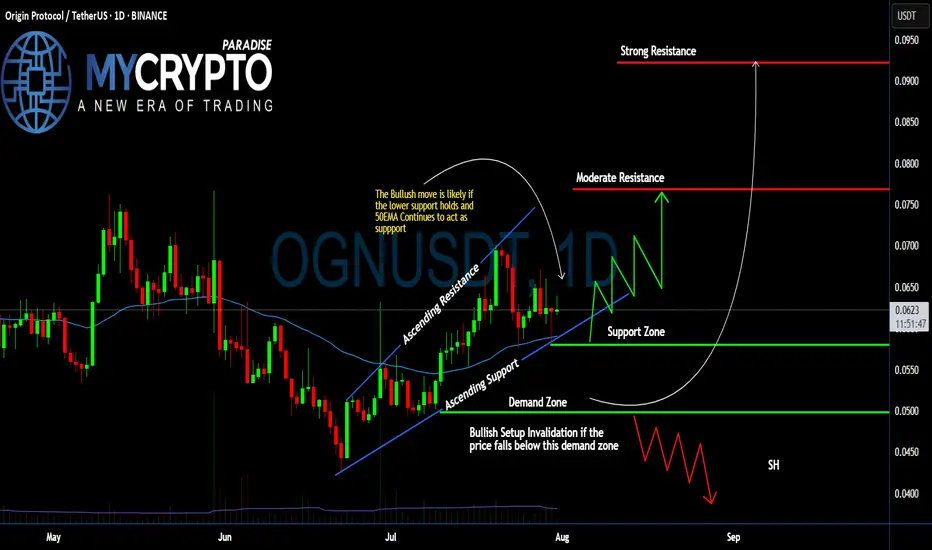
#OGN Ready For a Massive Bullish Move | Must Watch For BullsYello, Paradisers! Is #OriginProtocol about to explode to the upside, or is this a bull trap in disguise waiting to liquidate the impatient? Let’s break down what’s brewing on #OGNUSDT:
💎After forming a clean ascending channel, #OGN has been respecting both the ascending resistance and ascending support levels. Price is currently trading just above the 50 EMA, which has been acting as a dynamic support line since early July. This structure shows clear buyer interest around the $0.058–$0.062 zone—an area that aligns with volume cluster support.
💎The bullish scenario remains valid as long as #OGNUSD holds above the demand zone between $0.0499–$0.0580, and especially if it stays above the 50 EMA. As long as this structure is maintained, we could see a bounce toward the moderate resistance level at $0.076, where previous sellers stepped in and price stalled.
💎If buyers can break through that moderate resistance with strength and rising volume, the next key target lies at $0.092, which aligns with a strong resistance level and high-volume node on the visible range. This area is likely to trigger a reaction, so traders should remain agile.
💎However, if price breaks down below the demand zone, this would invalidate the current bullish setup and open the door for a potential move back toward the $0.045–$0.040 area. A broader shakeout would likely accompany this and could trap many late long entries.
Stay patient, Paradisers. Let the breakout confirm, and only then do we strike with conviction.
MyCryptoParadise
iFeel the success🌴
Trend Analysis
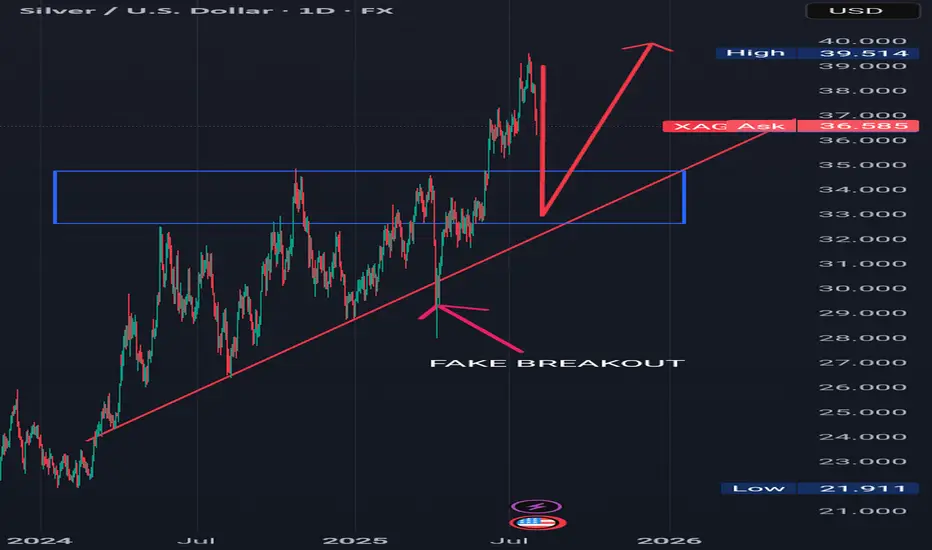
BUY AFTER THE PULLBACK Analyzing the daily time frame of silver, we can see that silver is in a bullish uptrend.
The price of silver is respecting a rising trend line which is acting as support in the past, only for some few times in the past did it exhibit a fake breakout which is indicated with an arrow.
I see the price of silver from its current price actions selling to our required point of interest and looking for buy liquidity to buy at our confluence which is both previous resistance which was broken to the upside which I indicated with a blue rectangle and a rising trend line.
Please look for buys at the previous broken resistance which is indicated with a blue rectangle in confluence with a rising trendline.
.............,...........................................
Please kindly share your thoughts on silver
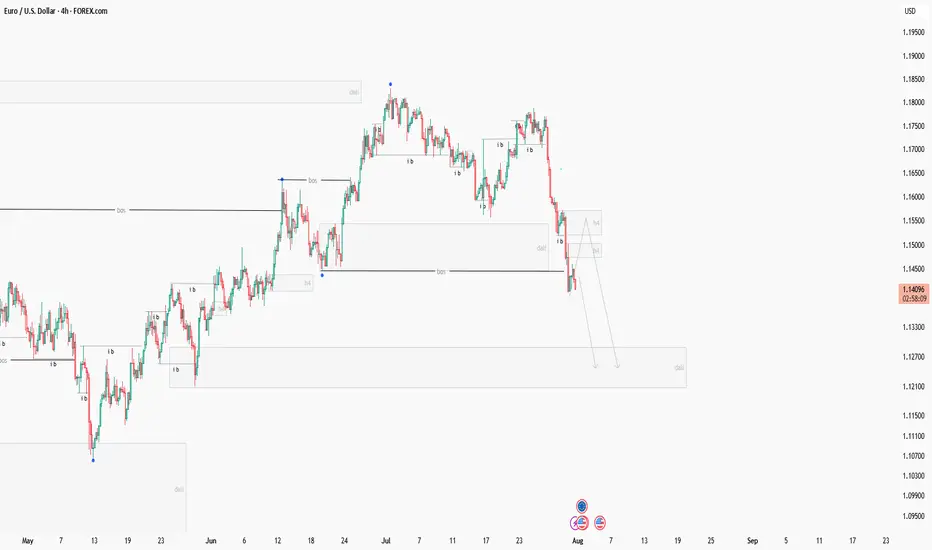
My opinion on the euro to dollarI think the trend is bearish in the medium term, although we may have an upward correction first, so you can wait to enter when shorting.
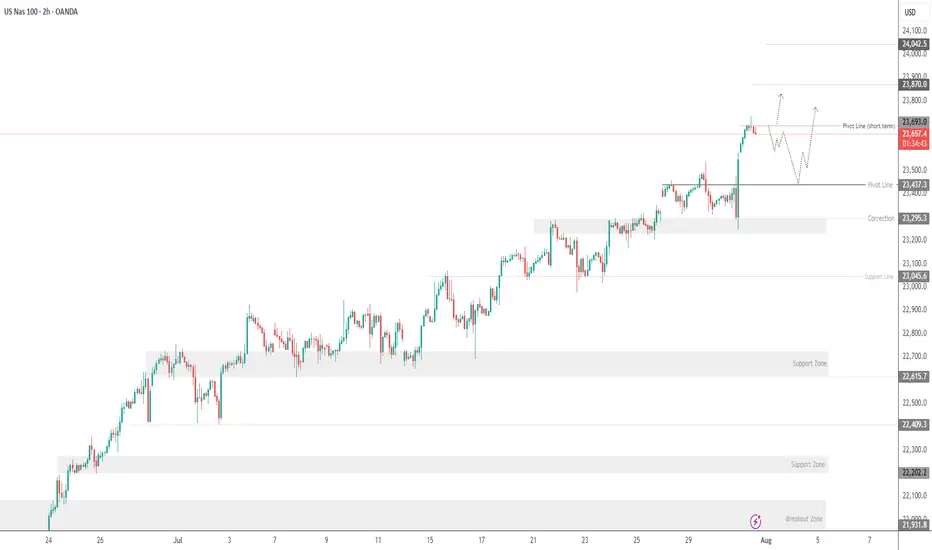
USNAS100 New ATH, looks a Correction...Wall Street Indices Hit Record Highs as AI Momentum Builds
Indices tied to the S&P 500 and Nasdaq reached fresh all-time highs on Thursday, driven by strong earnings reports from Meta and Microsoft. The results reinforced investor optimism that AI investments are delivering tangible returns and fueling future growth.
Meanwhile, Fed Chair Jerome Powell noted it's still too early to predict a rate cut in September, emphasizing that current monetary policy is not constraining economic activity. His comments followed a stronger-than-expected Q2 GDP reading, further supporting the Fed’s cautious stance.
Technical Outlook – USNAS100
After reaching recent highs, the index appears to be entering a corrective phase. A pullback toward 23470 is likely, with bullish momentum expected to resume if the price stabilizes above 23440. A sustained move above that level would target a new ATH near 23870.
However, a break below 23440 could trigger a deeper correction toward 23295.
Support: 23540 • 23440 • 23295
Resistance: 23870 • 24040
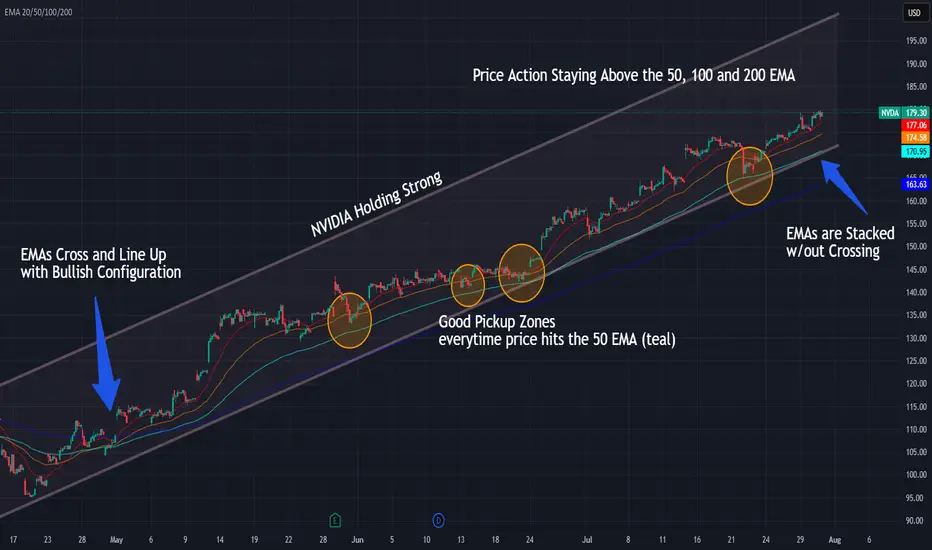
NVIDIA Riding the 50 EMA — Trend Still IntactNVDA continues to respect the rising channel while price holds above the 50, 100, and 200 EMAs — with each 50 EMA touch offering solid entries.
📌 Bullish EMA structure: 20/50/100/200 stacked clean
📌 50 EMA = key support and entry zone
⏱️ Timeframe: 1H
#nvda #stocks #ema #swingtrading #bullishtrend #quanttradingpro #tradingview
Moodeng Liquidity Grab + ReversalStrategy: Liquidity Grab + Reversal
Entry: $0.15350-$0.15000
Stop Loss: $0.14490
Take Profits: $0.17600, $0.19500
📊 Rationale:
– HTF trend: Range-bound with engineered downside inducement
– LTF structure: Watching for bullish CHoCH after sweep below local support
– Liquidity targeting: Price is likely to run sell-side stops below $0.16000–$0.15000 and reverse from unmitigated demand
🧠 Volume remains calm, OI is stable, and market is setting up for a clean liquidity sweep into a prior reaction zone. Confirmation will follow from M5–M15 CHoCH after the sweep.
⸻
🧠 Stay sharp. Trade smart. Let the market come to us.
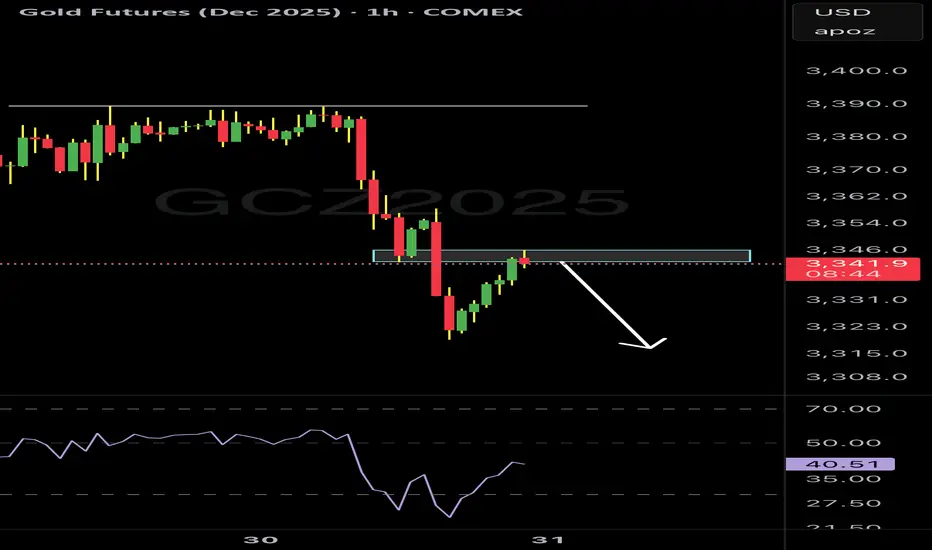
Gold rinse and repeatSimple, more shorts on gold as it looks like a rinse and repeat from previous sessions price action
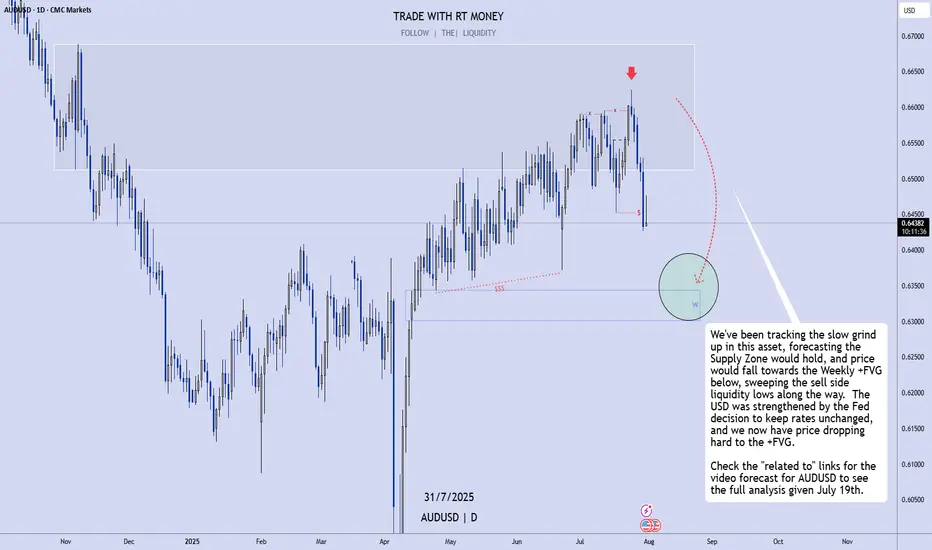
AUDUSD: Dropping To the Weekly FVG, As Expected!In this video, we will analyze the following FX market for July 31 - Aug 1st.
AUDUSD
Been waiting and watching for this move, and we've tracked it for weeks! It's happening now!
Look for it to continue until we reach the +FVG!
Enjoy!
May profits be upon you.
Leave any questions or comments in the comment section.
I appreciate any feedback from my viewers!
Like and/or subscribe if you want more accurate analysis.
Thank you so much!
Disclaimer:
I do not provide personal investment advice and I am not a qualified licensed investment advisor.
All information found here, including any ideas, opinions, views, predictions, forecasts, commentaries, suggestions, expressed or implied herein, are for informational, entertainment or educational purposes only and should not be construed as personal investment advice. While the information provided is believed to be accurate, it may include errors or inaccuracies.
I will not and cannot be held liable for any actions you take as a result of anything you read here.
Conduct your own due diligence, or consult a licensed financial advisor or broker before making any and all investment decisions. Any investments, trades, speculations, or decisions made on the basis of any information found on this channel, expressed or implied herein, are committed at your own risk, financial or otherwise.
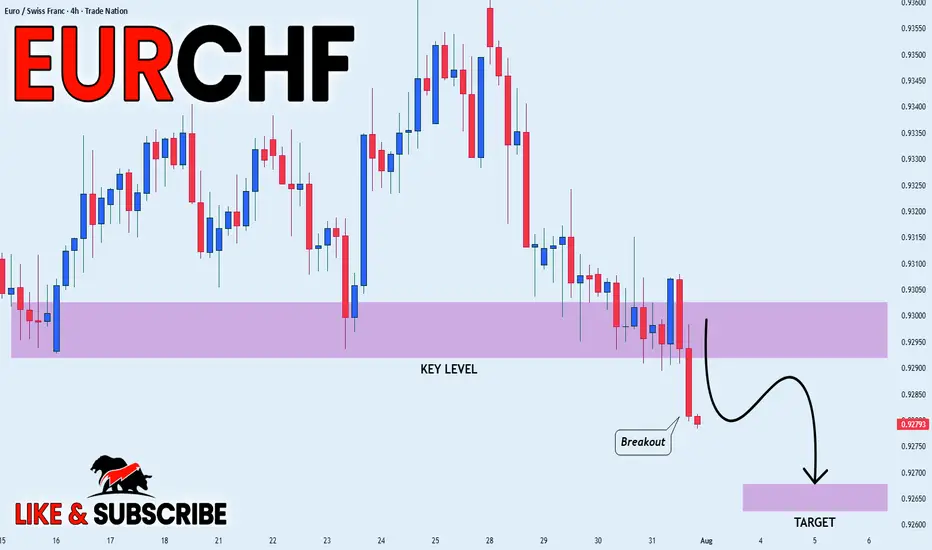
EUR_CHF WILL KEEP FALLING|SHORT|
✅EUR_CHF broke the key
Structure level of 0.9295
While trading in an local downtrend
Which makes me bearish
And I think that after the retest of the
Broken level is complete
A rebound and bearish
Continuation will follow
SHORT🔥
✅Like and subscribe to never miss a new idea!✅
Disclosure: I am part of Trade Nation's Influencer program and receive a monthly fee for using their TradingView charts in my analysis.
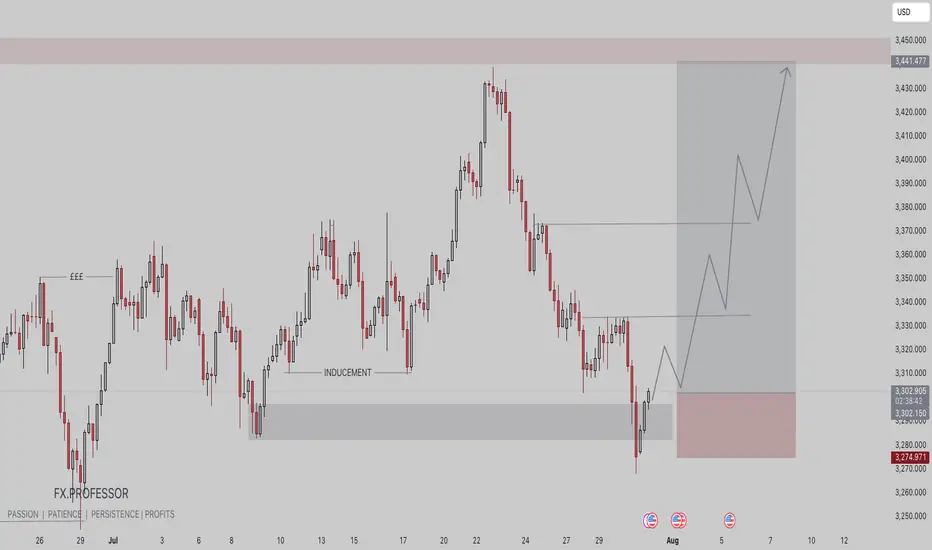
GOLD BUY TRADE IDEA🟡 XAU/USD Smart Money Setup – July 31, 2025
🔍 Key Technical Highlights:
• Demand Zone Entry:
• Price has tapped into a clear demand zone (gray box) around 3,274 – 3,290, signaling potential institutional accumulation.
• The previous inducement low has been swept, aligning with Smart Money Concepts (SMC).
• Liquidity Engineering:
• Equal highs (liquidity pool) visible from late June remain uncollected — a prime upside target.
• Price structure shows internal BOS, suggesting a shift in market sentiment.
• Expected Path:
• A potential multi-leg bullish move is mapped out, targeting the 3,440+ premium zone, completing imbalance fill and stop-run above highs.
• Risk-Reward:
• Stop loss sits just below the demand zone (~3,274), maintaining a favorable risk-to-reward ratio.
⸻
🧠 Smart Money Flow Narrative:
1. Sweep of inducement lows triggers institutional entries.
2. Demand zone holds with bullish reaction — confirmation of intent.
3. Expect higher highs and a rally toward uncollected liquidity above 3,440.
4. Low-risk buy opportunity for both swing and intraday traders.
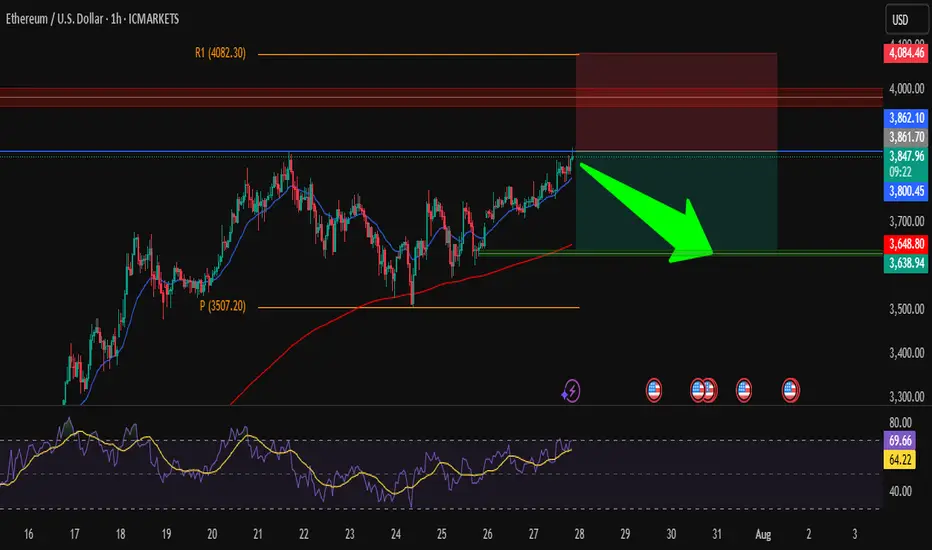
ETH/USD – Short from ResistanceHi traders ! , I opened a short position on ETH/USD as price is hitting a strong resistance zone.
Entry: 3850
SL: 4084.46
TP: 3638.94
📌 Why I took this trade:
Price is testing a strong resistance zone around 3860, RSI is overbought, and we could see a pullback toward the support area around 3640.
Nice risk/reward setup, keeping it simple.
This is just my analysis, not financial advice.
What’s your view — drop or breakout?
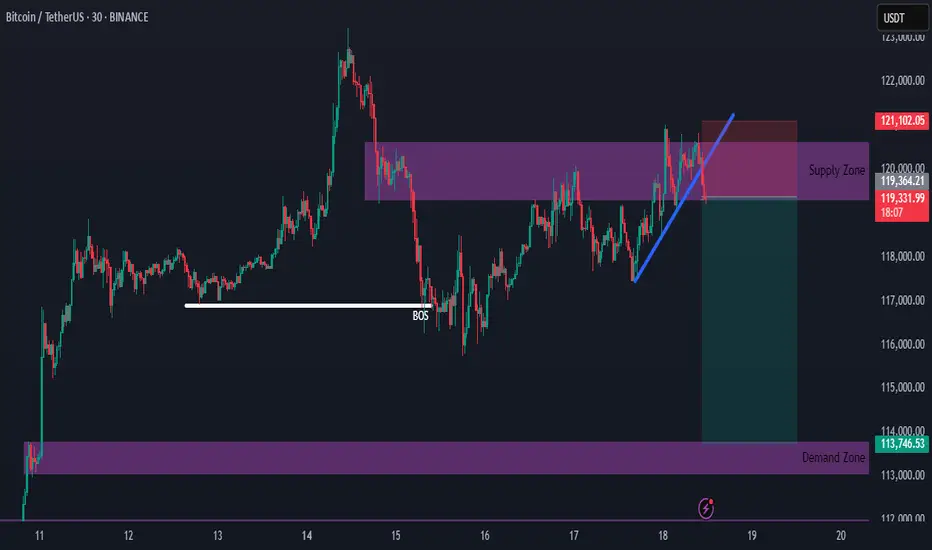
Bitcoin Supply Zone Intact — New Short Setup DevelopingHello everybody!
The supply zone we discussed in the previous idea is still holding.
We have a new opportunity to go short upon the break of the upward trendline.
The most likely target is around 114,000.
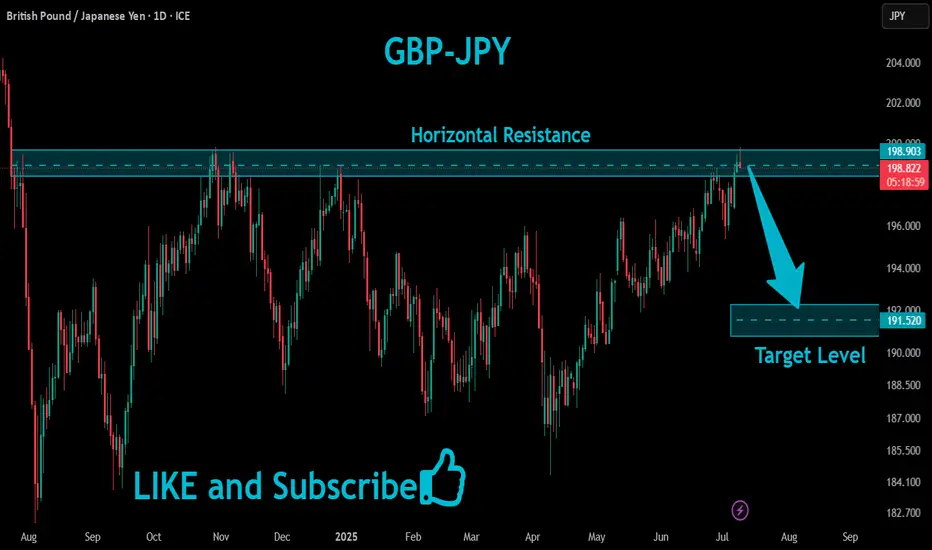
GBPJPY Will Fall!
HI,Traders !
#GBPJPY has retested a
Horizontal resistance level
Of 198.903 so we are
Locally bearish biased
And from the resistance we
We will be expecting a
Local bearish correction !
Comment and subscribe to help us grow !
AVAXUSD at Support ? recent brok the resistanceAVAX has recently broken the Support and is likely to reverse from this support area let us see.
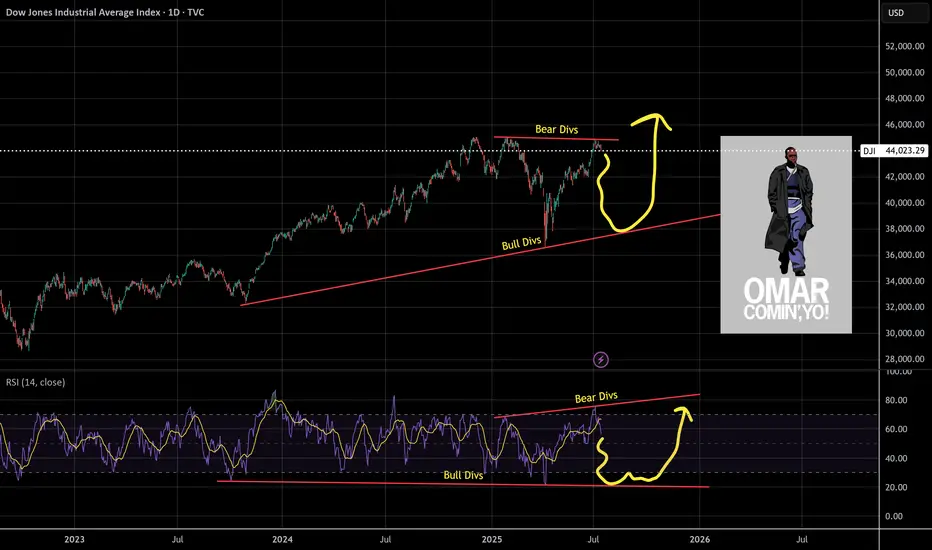
Shakeout On The WayUnlike the SPX, the DJI didn't make a higher-high. Why is this? I think partially because it's price weighted as opposed to market cap weighted like the Nasdaq or SPX. The other part would be CPI numbers.
So what's next for the DJI? I see hidden bullish divs long term and hidden bearish divs short term, this a common shake out tactic I see to liquidate longs and shorts. I'll be looking to load up on the trade at the bottom of the channel and play the range as it develops.
As always: stay calm, don't panic, and don't forget you can always use a stop loss
The fear and green index is at 74, when people are greedy be fearful.
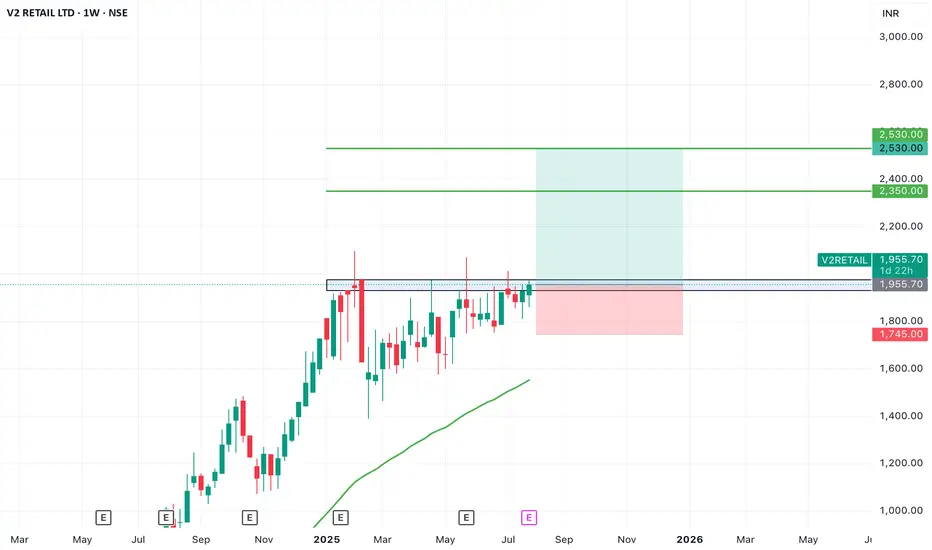
SWING IDEA - V2 RETAILV2 Retail , a small-cap value fashion retailer with a pan-India presence, is showing strong bullish momentum and a textbook swing trade setup backed by multiple breakout signals.
Reasons are listed below :
Breakout from a VCP (Volatility Contraction Pattern) – indicating accumulation and strength
Ascending triangle breakout – classic continuation pattern
Cleared major resistance zone, confirming bullish intent
Maintains a clear uptrend with higher highs and higher lows
Target - 2350 // 2530
Stoploss - weekly close below 1745
DISCLAIMER -
Decisions to buy, sell, hold or trade in securities, commodities and other investments involve risk and are best made based on the advice of qualified financial professionals. Any trading in securities or other investments involves a risk of substantial losses. The practice of "Day Trading" involves particularly high risks and can cause you to lose substantial sums of money. Before undertaking any trading program, you should consult a qualified financial professional. Please consider carefully whether such trading is suitable for you in light of your financial condition and ability to bear financial risks. Under no circumstances shall we be liable for any loss or damage you or anyone else incurs as a result of any trading or investment activity that you or anyone else engages in based on any information or material you receive through TradingView or our services.
@visionary.growth.insights
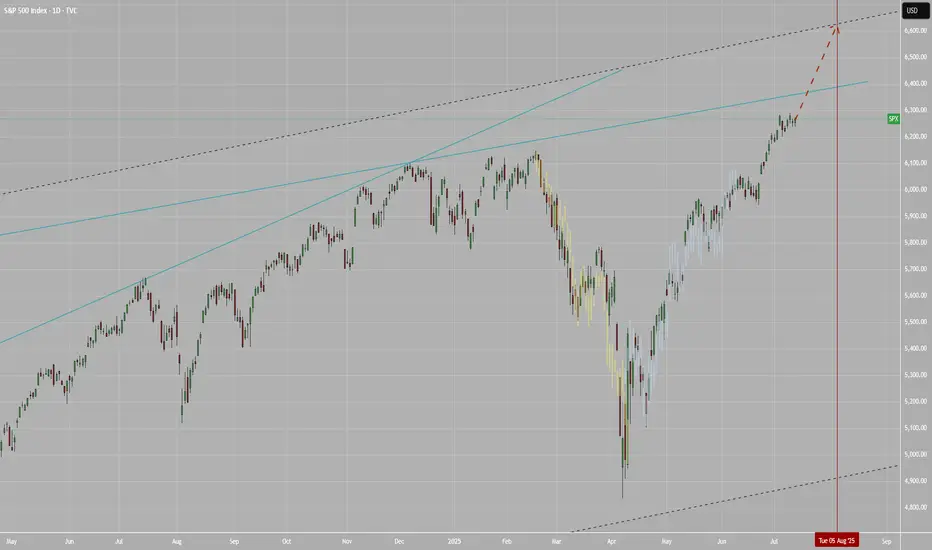
SPX to 6600+ by Aug 5This leg up in SPX is not over yet. Target at upper bound of the channel around 6.6K+ by Aug 5.
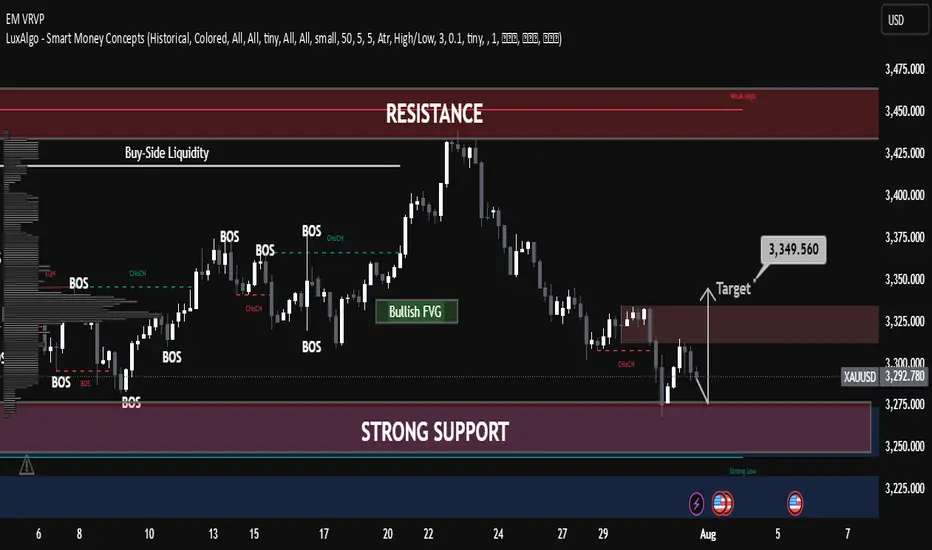
XAUUSD Smart Money Technical Analysis – Bullish Potential XAUUSD Smart Money Technical Analysis – Bullish Potential from Strong Support
Gold (XAUUSD) is currently trading around $3,291.780, showing a potential bullish reversal setup from the strong support zone after a clear liquidity sweep and market structure shifts.
🔍 Key Technical Highlights:
✅ Strong Support Zone (Demand)
Price is reacting from a major demand zone (Strong Low) between $3,275 – $3,225, a level that previously triggered bullish rallies.
Multiple Breaks of Structure (BOS) and CHoCH indicate previous bullish control and a possible re-accumulation phase.
✅ CHoCH Near Support
A recent Change of Character (CHoCH) around the support area shows the first signs of smart money accumulation.
Liquidity below recent lows has been swept, triggering possible bullish intent.
✅ Bullish FVG (Fair Value Gap)
A clear Bullish FVG remains unmitigated around the mid-range, offering target confluence at $3,349.560.
Price may aim to rebalance inefficiency and fill the FVG as part of the bullish move.
✅ Resistance Zone Above
The resistance area near $3,325 – $3,350 acts as a short-term target for long positions.
Further resistance lies at the Buy-Side Liquidity & Weak High zone around $3,450 if momentum sustains.
🧠 Smart Money Concept Interpretation:
Liquidity Grab: Price dipped into strong demand to collect sell-side liquidity before potential reversal.
CHoCH + BOS Alignment: Indicates the market may now transition into a bullish phase.
FVG as Magnet: Price is drawn toward unfilled value zones—ideal for bullish target projection.
🎯 Trade Idea (Educational Purposes Only):
Bias: Bullish
Entry: Around current zone ($3,290)
Target: $3,349.560 (FVG zone)
Invalidation/SL: Below strong low (~$3,225)
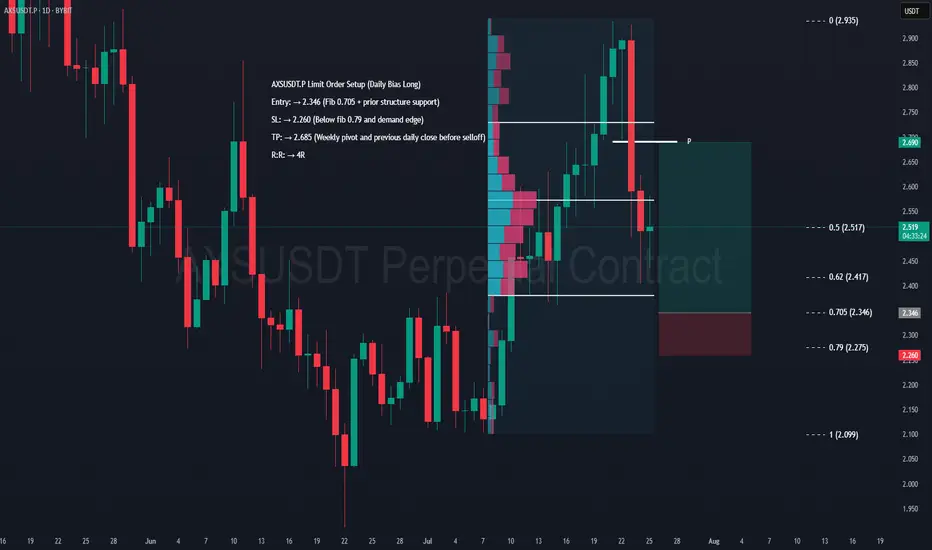
AXS Swing Long Setup – Daily Confluence TradeAXS Limit Order Setup (Daily Bias Long)
Entry: → 2.346 (Fib 0.705 + prior structure support)
SL: → 2.260 (Below fib 0.79 and demand edge)
TP: → 2.685 (Weekly pivot and previous daily low before selloff)
R:R: → 4R
DISCLAIMER: I am not providing trading signals or financial advice. The information shared here is solely for my own documentation and to demonstrate my trading journey. By openly sharing my process, I aim to put pressure on myself to stay focused and continually improve as a trader. If you choose to act on any of this information, you do so at your own risk, and I will not be held responsible for any outcomes. Please conduct your own research and make informed decisions.
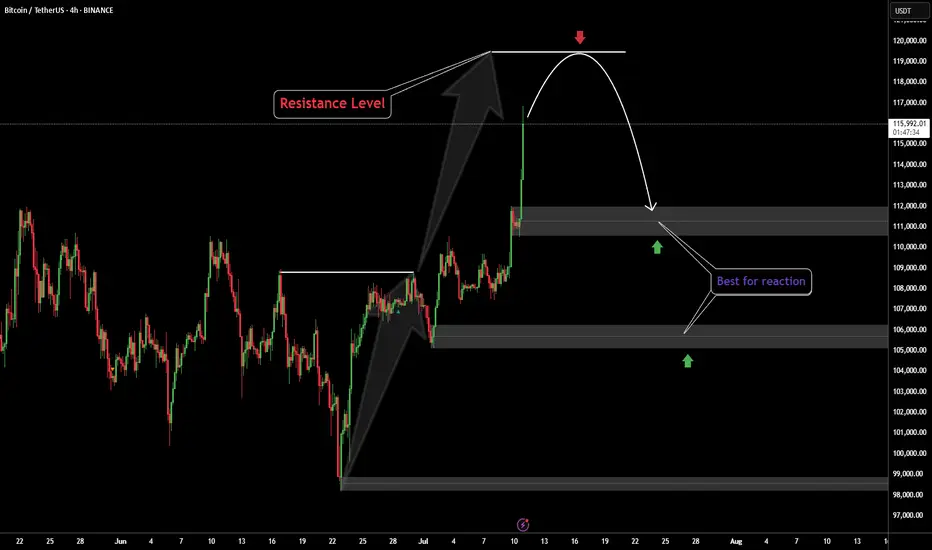
Bitcoin ATHBINANCE:BTCUSDT This is amazing for crypto community because this level-up all of lover crypto currencies.
Next target: 120.000K
Best for pollback levels: 111.000K & 105.500K
👓We are this time keep calms emotional in buy or sell.
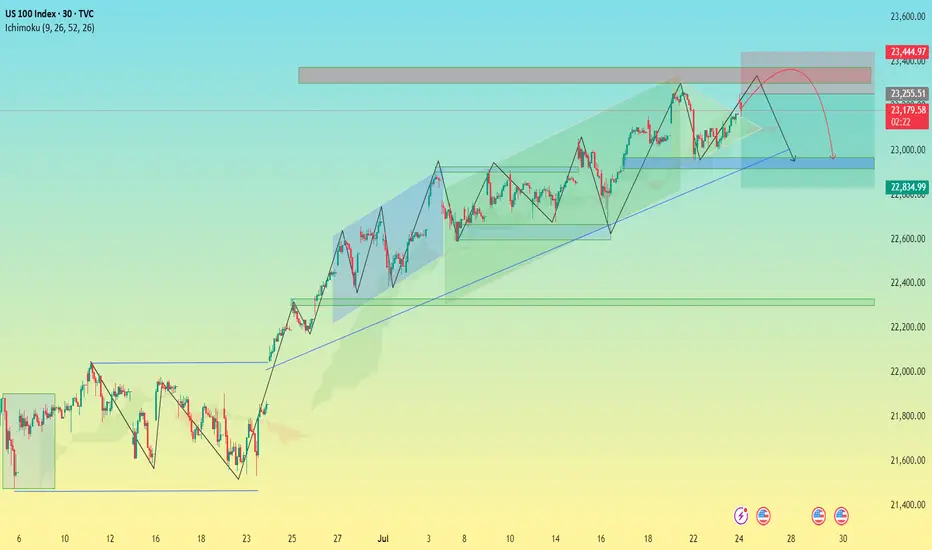
US100 Index – Potential Bearish Reversal in Key Resistance Zone🧠 US100 Index – Potential Bearish Reversal in Key Resistance Zone
Timeframe: 30-Minute | Chart Published: July 24, 2025
---
🔍 Overview
The US100 (NASDAQ) has been trading in a well-structured ascending channel, forming higher highs and higher lows. However, recent price action suggests that the index is testing a critical supply zone near 23,400, with signs of weakening bullish momentum. This may signal a potential corrective phase or bearish reversal.
---
📈 Technical Analysis Breakdown
🔵 Trend Structure:
Price is respecting a clear ascending trendline (blue), connecting multiple higher lows.
Multiple bullish flag/channel formations have been completed within the uptrend, showing healthy momentum until the current point.
🟥 Resistance Zone:
Strong supply zone marked between 23,250 – 23,450.
Price action shows stalling candles and rejection wicks within this zone, indicating buyer exhaustion.
⚠ Bearish Patterns:
The red path projection suggests a head and shoulders-like structure forming at the top of the channel.
This, along with divergence in wave strength and shrinking momentum, supports a potential reversal.
🔵 Key Support:
First support lies around 23,000 — aligning with the ascending trendline and previous consolidation.
If broken, next demand zone is around 22,835 – 22,900, where historical consolidation took place.
---
🔁 Projected Scenario (as per visual path)
1. Price may attempt one last push into the 23,400–23,450 zone (possible false breakout).
2. Rejection from this level could trigger a fall toward the ascending trendline support.
3. A confirmed break of the trendline can lead to a larger correction toward the 22,800 zone.
---
🧠 Unique Insight
This chart combines multi-timeframe structure recognition with a real-time reversal formation inside a long-standing bullish trend. The analysis doesn’t just rely on textbook patterns—it recognizes real-time price behavior shifts, which makes it valuable for proactive traders.
---
📌 Conclusion
While the trend remains bullish overall, caution is warranted as the US100 approaches a historically significant resistance zone. The setup offers a compelling risk-reward short opportunity for aggressive traders, especially if the price confirms a break below trendline support.
---
🔧 Next Steps for Viewers
> “Watch for a clean rejection candle or lower high at resistance before entering short. If trendline breaks cleanly, 22,835 could be the next target zone.”
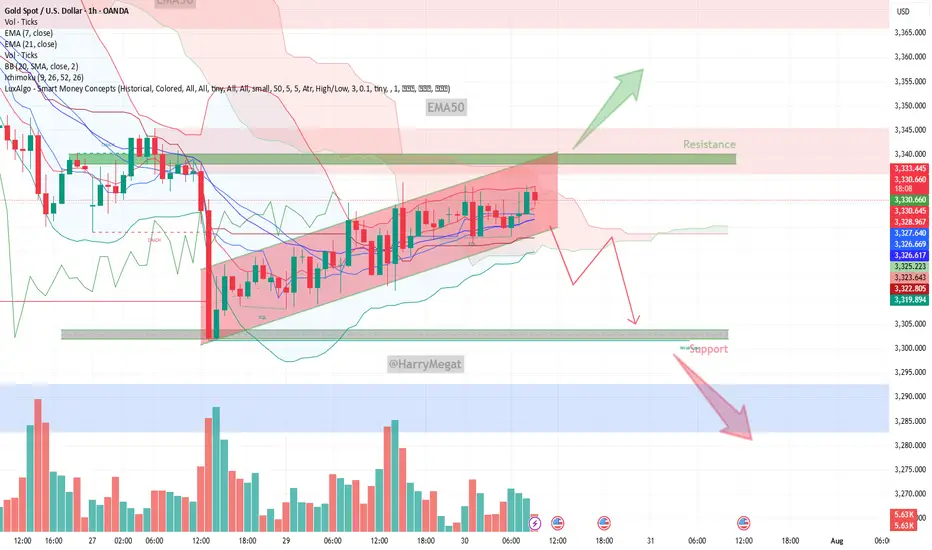
Gold (XAU/USD) on the 1‑hour timeframeGold (XAU/USD) on the 1‑hour timeframe
Chart Structure & Bias
* Price remains trapped in a **rising channel** (\~\$3,328–3,333), pressing against resistance near **\$3,340–3,345**.
* Short-term momentum is bearish: both EMA 7 and EMA 21 sit above current price, with declining volume signaling weakening buyer strength.
* Overall trend leans neutral‑to‑bearish until market clears key zones decisively.
Trade Scenarios
**Bearish Breakdown (Preferred)**
* **Trigger:** Break and close below channel support (\~\$3,326).
* **Targets:** Initial drop toward **\$3,320**, then **\$3,300**, and possibly lower if momentum intensifies.
* **Invalidation:** Price pushes back above **\$3,333–3,335**, negating bearish structure.
**Bullish Breakout (Conditional)**
* **Trigger:** Clean breakout and sustained close above **\$3,342–3,345**.
* **Targets:** Upward stretch toward **\$3,355–3,360**, and if strong, **\$3,367–3,375+**.
* **Invalidation:** Fails to hold structure—retesting from above back beneath **\~\$3,338**.
Macro Drivers & Market Conditions
* Caution prevails pre‑Fed decision and ADP / GDP releases—market awaits cues on interest rate direction.
* Safe‑haven demand has softened as global trade sentiment improves, while U.S. dollar strength continues to cap upside in gold.
* Analysts favor **sell‑on‑rise positioning**, bumping up potential for controlled pullbacks.
Verdict
Gold is consolidating in a tight upward channel, showing short-term bearish pressure. The **bearish breakdown scenario holds the edge** unless price convincingly clears above **\$3,345** on strong volume, which could flip bias. A confirmed break below **\$3,326** sets the stage for downward moves toward **\$3,300** or lower.