RLT Renergen UpsideRLT Renergen is a Helium producer, and possibly has the worlds best resource located in South Africa Welkom area.
As a difficult resource to liquify, requires energy, which they have to my knowledge, have achieved via sustainable methods.
Helium is required by many Industries as Semiconductor and MRI and more.
Also Balloons? LOL.
The alliance with ASP Isotopes is a perfect match, as the team will now have the required capital to push production to the next stage.
While still somewhat speculative, the future outcomes look great.
As always if you are unsure about Investing please consult with your own personal investment Advisor before making any Trades or Investments as most are 12 months or more views.
Should you appreciate my comments and chart studies - please smash that like button. It's just a click away.
Regards Graham
Trend Analysis

AUD/USD Rejected at Resistance-Fed on TapYesterday’s Fed-induced sell-off broke through the monthly opening-range lows / 52-week moving average with the bears now poised to mark a sixth-consecutive daily decline.
It's worth noting that weekly momentum peaked at 60 on the April advance with RSI now poised to close back below 50. The observation suggests the broader downtrend remains intact and a pivot / break below slope support could mark trend resumption.
Initial weekly support is eyed with the February high at 6408 and is backed by the 38.2% retracement of the yearly range / February high-week close (HWC) at 6354/57. A break / daily close below this region would be required to suggest that a more significant high is in place, potentially signaling a larger reversal underway. In such a scenario, the next downside objectives would be the yearly low-week close and 2023 low-close at 6291/96, followed by the 61.8% retracement and 2022 low-close at 6186–6201. Both of these zones are key areas of interest for potential downside exhaustion / price inflection IF reached.
Look for initial resistance back at the 52-week moving average (currently ~6460) with key resistance now seen back at the 61.8% retracement / yearly high-close at 6550/77. Note that the upper parallel converges on this threshold over the next few weeks and further highlights the technical significance of this zone. Ultimately a breach / weekly close above the 2021 trendline (red) would be needed to validate a breakout of the multi-year downtrend in Aussie.
Bottom line: A reversal off downtrend resistance is now approaching initial support- risk for trend resumption heading into August. From a trading standpoint, the immediate focus is on the weekly close with respect to 6400- rallies should be limited to the 52-week moving average IF Aussie is heading lower on this stretch with a close below needed to keep the immediate short-bias viable heading into the monthly cross.
Keep in mind we get the release of key US employment data tomorrow with Non-Farm Payrolls on tap. Stay nimble into the release and watch the weekly close / August opening-range for guidance for guidance.
-MB

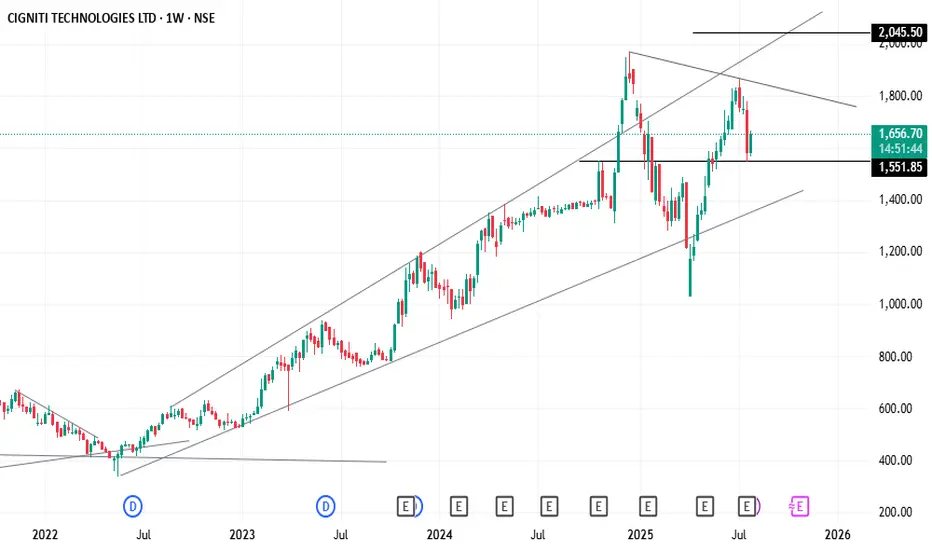
CIGNITITEC - Bull run in short runhi,
this looking BULL run in the short run and two targets are mentioned and this is purely educational purpose and calculate your risk...! Kindly comments your opinions!
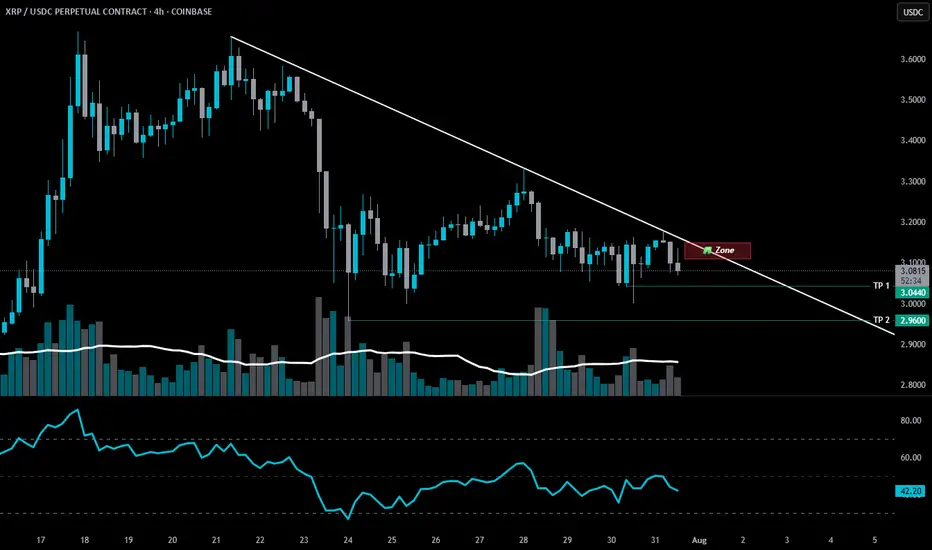
SHORT ZONE-XRP structure shiftThere was an XRP structure shift last week.
📉 It’s been bleeding ever since.
Now, another bearish setup is forming.
If XRP nears that descending trendline and fails to break through — it enters the SHORT ZONE.
🚫 No breakout? No mercy.
This isn’t the end for CRYPTOCAP:XRP — but a purge may be necessary before liftoff.
A proper cleansing to prepare for the next ascension.
🫡 xrpArmy, forgive me…
But hey, feel free to earn your keep.
Stay Sharp. Regulate Yourself.
🚫 100% NOT financial advice.
🎭 Edutainment purpiz only.
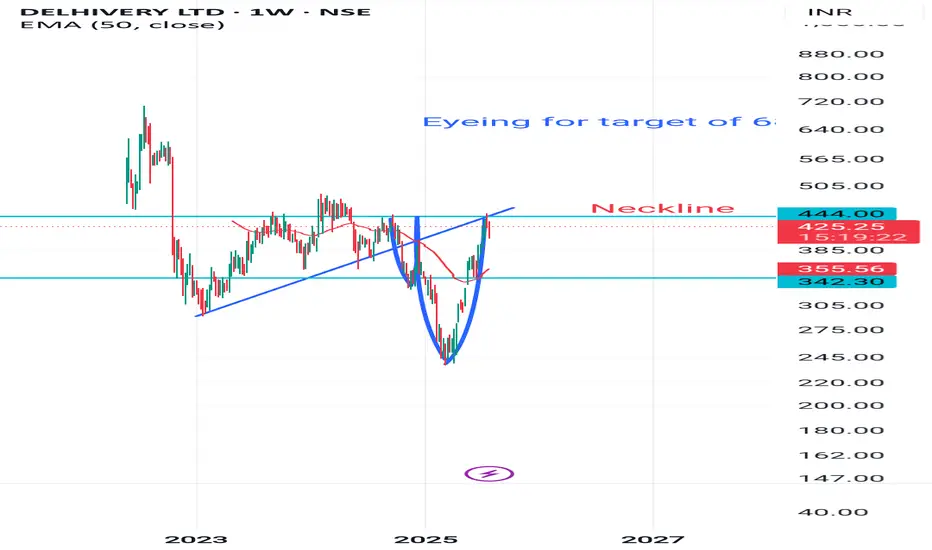
Readying for target of 680 on breakoutHead and left sholuder is already there in coming weeks may be possible that right shoulder appears.
For that it had to retest level 342
Any way neckline and resistance line is there if it breaks
Target will be 680.
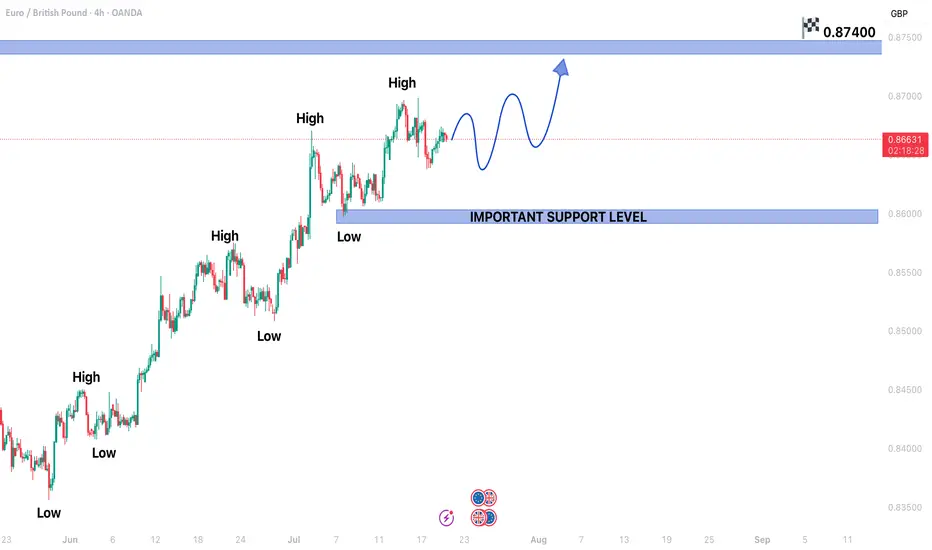
EURGBP CONTINUING BULLISH TREND STRUCTUREEURGBP CONTINUING BULLISH TREND STRUCTURE IN 4H TIME FRAME.
Price is currently in a secondary trend.
Price is expected to end the secondary trend and start primary trend again.
On higher side market may hit the targets of 0.87400
On lower side 0.85950 may act as a key support level.
HEAD & SHOULDER PATTERN SPOTTED IN EUR/CADHEAD & SHOULDER PATTERN SPOTTED IN EUR/CAD.
Price is expected to remain bearish in upcoming trading sessions.
On higher side 1.61100 level may act as a key resistance level.
On lower side market may hit the target of 1.58150.

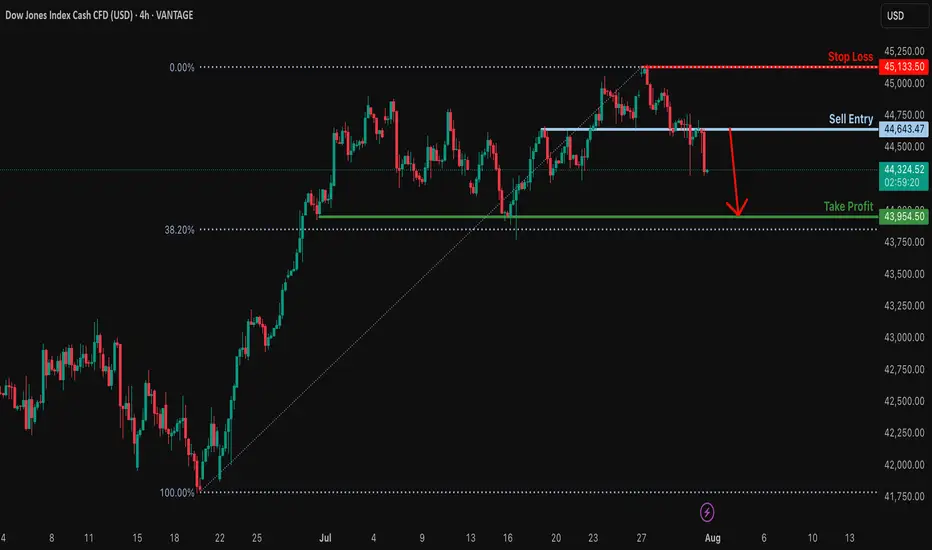
Potential bearish drop?Dow Jones (DJ30) has reacted off the resistance level which is an overlap resitance and could drop from this levle ot our takeprofit.
Entry: 44,643.47
Why we like it:
There is an overlap resistance levle.
Stop loss: 45,133.50
Why we like it:
There is a swing high resistance.
Take profit: 43,954.50
Why we like it:
There is a multi swing low support.
Enjoying your TradingView experience? Review us!
Please be advised that the information presented on TradingView is provided to Vantage (‘Vantage Global Limited’, ‘we’) by a third-party provider (‘Everest Fortune Group’). Please be reminded that you are solely responsible for the trading decisions on your account. There is a very high degree of risk involved in trading. Any information and/or content is intended entirely for research, educational and informational purposes only and does not constitute investment or consultation advice or investment strategy. The information is not tailored to the investment needs of any specific person and therefore does not involve a consideration of any of the investment objectives, financial situation or needs of any viewer that may receive it. Kindly also note that past performance is not a reliable indicator of future results. Actual results may differ materially from those anticipated in forward-looking or past performance statements. We assume no liability as to the accuracy or completeness of any of the information and/or content provided herein and the Company cannot be held responsible for any omission, mistake nor for any loss or damage including without limitation to any loss of profit which may arise from reliance on any information supplied by Everest Fortune Group.

Do you think gold is on a correction?
Hi my dears
Gold looks set to hit lower targets if it breaks the orange dotted line
What do you think?
The weekly timeframe has confirmed the bearish trend.
If you liked my analysis, just like me by liking and commenting.

Sell EURUSD after BRD the level of 1.15This market is started the down move by forming a very
strong bearish bars
break down the level 1.15
so I opend short with RR=1:2.6
then after a 100 points in profit I added to
this short position another one with RR=1:2

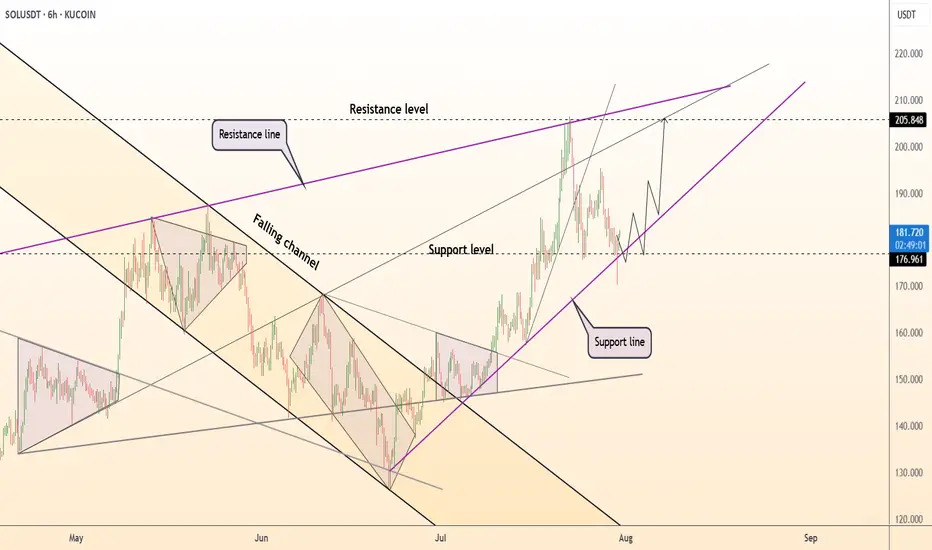
DeGRAM | SOLUSD is holding the $177 level📊 Technical Analysis
● SOLUSD is bouncing from the rising trendline support at 177 after a retracement, maintaining structure within a bullish ascending wedge.
● Price holds above the prior resistance-turned-support near 176.9, with a clear path to retest the 205.8 and 219–222 confluence zone.
💡 Fundamental Analysis
● Solana's 30-day DApp volume ranks top 3 among L1s, signaling increased utility. Institutional SOL inflows also continued for a fifth week, per CoinShares.
● Strong user metrics and positive funding rates suggest bullish momentum remains supported on-chain and through derivatives markets.
✨ Summary
Buy dips above 177. Targets at 205 ▶ 220. Long setup holds while price stays above 175.
-------------------
Share your opinion in the comments and support the idea with a like. Thanks for your support!
#GBPUSD ALMAZOV PROJECTION DAILYPrice projection according to Almazov's theory, #GBPUSD should at least touch $1.31500 - before going up, we wait for the initial condition to enter a long position, to reach the Daily Spike f 261.8.

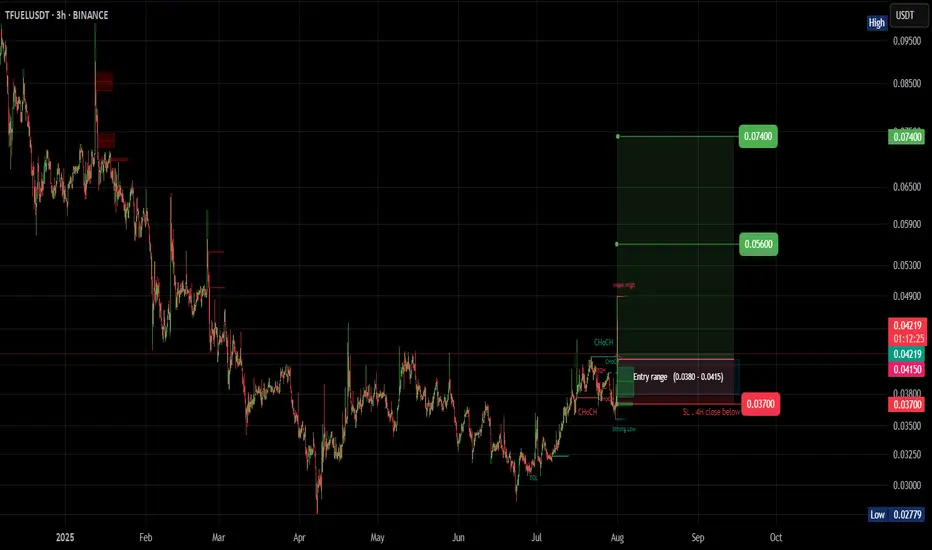
#TFUEL (SPOT)BINANCE:TFUELUSDT
#TFUEL/ USDT
Entry (0.0380 - 0.0415)
SL 4H close below 0.037
T1 0.056
T2 0.075
_______________________________________________________
Golden Advices.
********************
* collect the coin slowly in the entry range.
* Please calculate your losses before the entry.
* Do not enter any trade you find it not suitable for you.
* No FOMO - No Rush , it is a long journey.
STELLAR LUMENS - DOLLAR COST AVERAGE FOR LONG TERM GAINSSTELLAR LUMENS (XLM) has taken off late 2024 from under .10 cents and now trading at .40 cents for a 400% Gain in 6 months so far, and there is much more upside to come potentially. It hit all time highs around .50 cents and now the token seems to want to test those highs in the near term 2025, we can easily see XLM approach $1.00 towards 2026 for a 100% gain and even higher longer term. Overall, XLM moves with XRP and we all know XRP is a blue chip project, it has all the funds and institutional backing, and so does XLM.
Both projects share a common creator in Jed McCaleb, however they have different focuses. Ripple, and its native token XRP, was initially designed to facilitate cross-border payments for financial institutions. Stellar, on the other hand, focuses on financial inclusion and aims to provide accessible financial services for individuals, including remittances and access to banking services.
CAN WE SAY BULLISH?! TO THE MOON!!!

XAUUSD: BUYThere are some good trading opportunities in the market. That's when to buy. Gold prices haven't fallen further since falling back to 3390. There's no further negative news. Therefore, there won't be a significant short-term decline. Our focus will be on tomorrow's non-farm payroll data update. This is a crucial factor that can cause gold prices to rise or fall significantly in the short term.
I'll update you with real-time buy and sell opportunities. This is based on research from the Swing Trading Center. It's highly authoritative. Don't miss out! Remember to stay tuned.
XAUUSD: BUY 3292-3282 TP 3320. SL 3265
