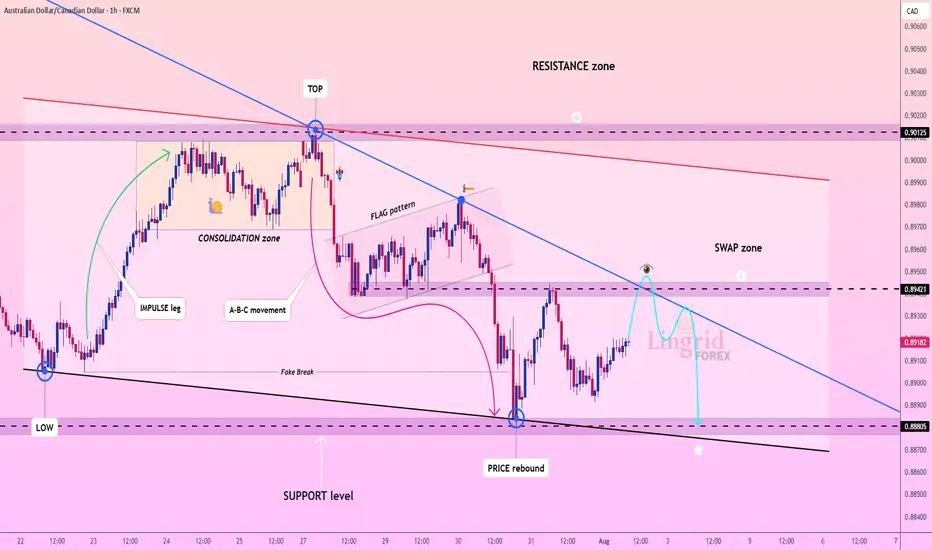
Lingrid | AUDCAD Swap Zone. Potential Selling OpportunityThe price perfectly fulfilled my last idea . FX:AUDCAD is rebounding from a strong support area after a fake break below 0.88805 and is now moving toward the descending trendline. The price is expected to test the swap zone near 0.89421, where prior support may flip to resistance. This setup favors a SELL scenario from the lower high structure within the flag and downtrend. A rejection from the trendline could resume the bearish continuation back toward support.
📌 Key Levels
Sell zone: 0.89421 – 0.89500
Buy zone: 0.88805 – 0.88600
Target: 0.88805
Invalidation: Break and close above 0.89550
💡 Risks
Bullish breakout through the descending trendline
Sharp reversal from macroeconomic news
Short-term consolidation above 0.89100 weakening momentum
If this idea resonates with you or you have your own opinion, traders, hit the comments. I’m excited to read your thoughts!
Trend Analysis
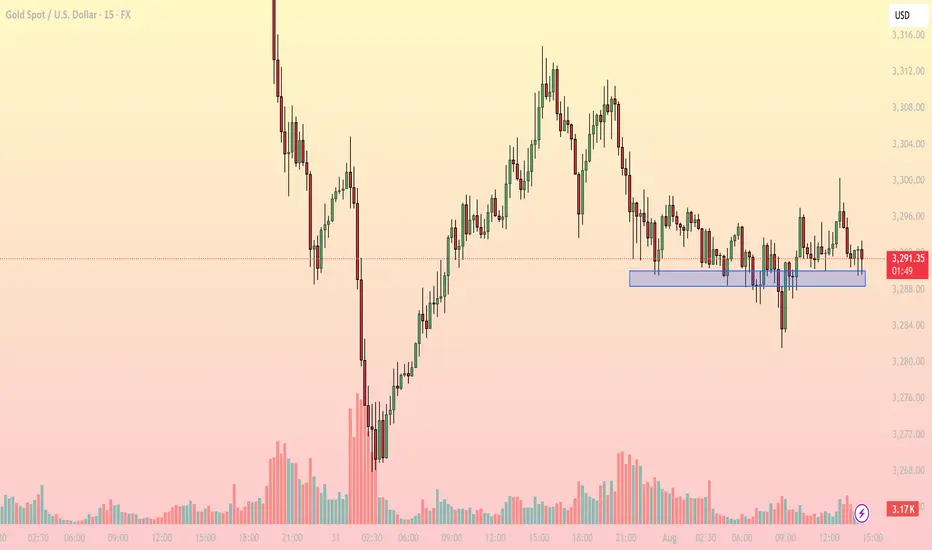
Gold consolidates near key support – What's next for?1. Market Overview
On the 15-minute chart, XAUUSD is trading around 3,290–3,292 USD, hovering just above a critical intraday support zone at 3,287–3,289 USD (highlighted in blue). This area has repeatedly provided a bounce in recent sessions, indicating persistent buying interest.
The current price action reflects sideways movement within a narrow range (3,287–3,296 USD), and notably, declining volatility, as shown by reduced candle range and trading volume.
2. Technical Breakdown
EMA: Price is moving around the EMA20 and EMA50, reflecting indecision and lack of directional momentum.
RSI (inferred): Likely hovering near the neutral 50–55 zone, confirming a balanced market.
Trendline: A descending series of lower highs from the 3,312 peak suggests bearish pressure, though buyers still defend key support.
Fibonacci: The 3,287 USD zone aligns with the 61.8% Fibonacci retracement level, reinforcing its strength as a bounce area.
3. Key Levels to Watch
3,287–3,289: Support - Repeated reactions here – key demand zone
3,296: Immediate resistance - Needs breakout to confirm bullish move
3,302: Next resistance - Breakout target – short-term top
3,275: Deeper support - Retest level if support breaks
4. Trading Strategy Scenarios
🔹 Scenario 1 – Long setup at support
Entry: 3,287–3,289 (wait for bullish reaction like pin bar or engulfing)
Stop Loss: Below 3,284
TP1: 3,296 | TP2: 3,302
🔹 Scenario 2 – Short setup on breakdown
Entry: Below 3,284 (after clear bearish candle close)
Stop Loss: 3,288
TP1: 3,275 | TP2: 3,268
5. Conclusion
Gold is in a tug-of-war at a sensitive support zone. Whether bulls defend or bears break below will set the tone for the rest of the session. Focus on price reaction around 3,287 to determine direction – avoid blind predictions.
Make sure to follow for more live strategies as the New York session unfolds – and save this post if you find it helpful!
What’s your view on this support zone? Let’s discuss below!
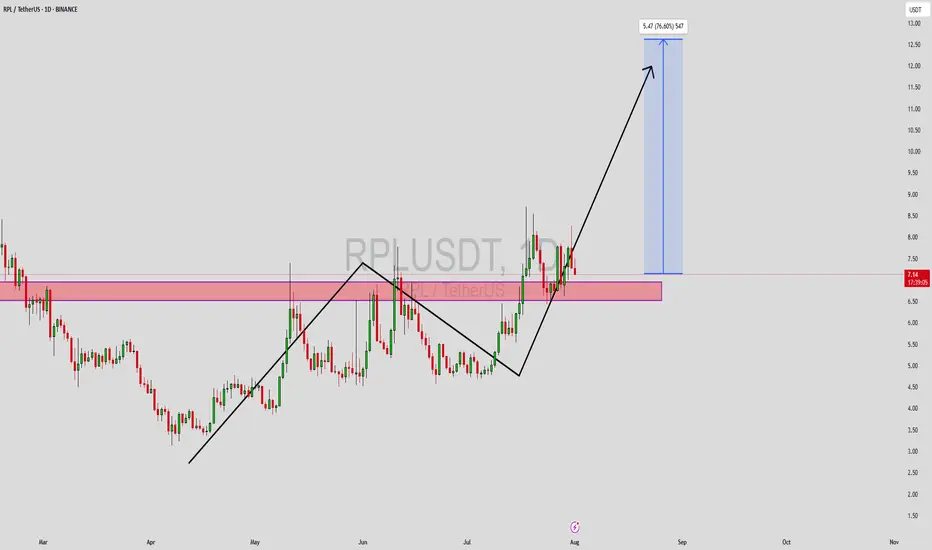
RPLUSDT Forming Strong Bullish StructureRPLUSDT is currently showing a strong bullish structure, with price action reclaiming a key support zone after a temporary retracement. The chart reveals a textbook market cycle with higher highs and higher lows, indicating a possible continuation of the uptrend. The current price level is sitting just above a key demand zone, previously tested and confirmed as strong support. This confluence area may act as a springboard for a potential move toward the 60% to 70% target gain zone, aligning with broader bullish sentiment seen across mid-cap altcoins.
Volume indicators are supportive of this move, suggesting that accumulation is underway. Increased investor interest in RPL is likely tied to its integral role in Ethereum’s liquid staking ecosystem, as Rocket Pool continues to gain adoption. With ETH staking steadily growing, projects like RPL tend to benefit from fundamental tailwinds. This kind of sector strength combined with favorable technicals gives the current setup more credibility and potential for follow-through.
The technical projection suggests that if momentum holds and buyers maintain control above the support range around $6.70–$7.00, then the next leg could push RPLUSDT beyond $12.00. That represents a 70%+ move from current levels, which aligns with the Fibonacci extension and measured move projections derived from previous breakout zones. Traders should keep a close eye on volume confirmation and potential breakout candles above minor resistance near $7.50.
This setup offers a well-defined risk-to-reward ratio for swing traders and position holders alike. With the current crypto market regaining traction, RPL is positioned as a high-potential candidate for strong upside if broader conditions remain favorable.
✅ Show your support by hitting the like button and
✅ Leaving a comment below! (What is You opinion about this Coin)
Your feedback and engagement keep me inspired to share more insightful market analysis with you!
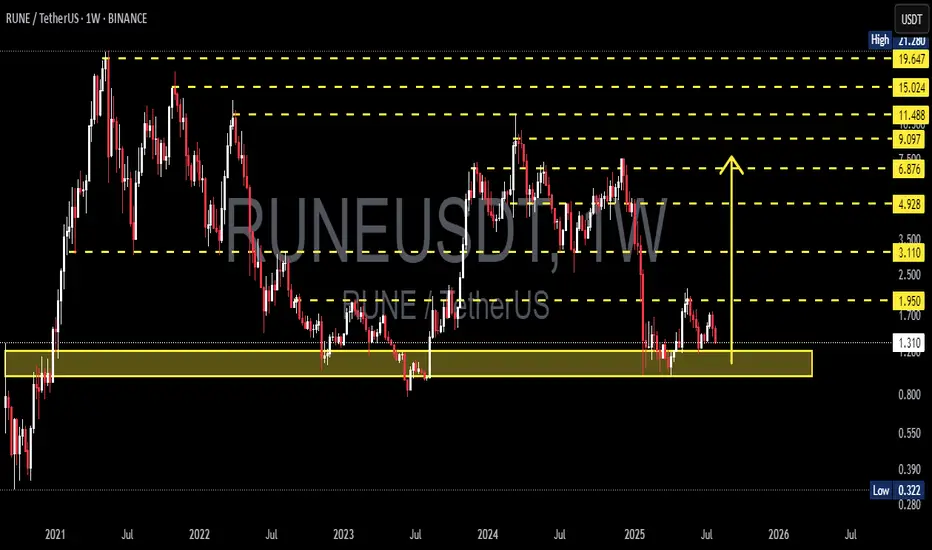
RUNE at the Brink: Rebound Opportunity or Breakdown Incoming?🧩 Overview:
RUNE/USDT is currently hovering at a critical support zone — a historical demand area that has triggered strong bullish rallies in the past. Positioned between $1.00–$1.30, this level has been a battle ground between buyers and sellers. The big question now: Will RUNE bounce for a bullish reversal or break down into deeper lows?
---
🔍 Key Levels Identified:
Major Support Zone (Demand Area): $1.00 – $1.30 (yellow box)
Immediate Resistance: $1.95 → $3.11 → $4.92
Extended Bullish Targets: $6.87 → $9.09 → $11.48 → $15.02
Deeper Bearish Targets (if support fails): $0.80 → $0.55 → $0.32
---
🟢 Bullish Scenario (Recovery Rally):
📌 Key Signal: Strong hold and price reaction above the $1.00–$1.30 zone.
1. Reversal Patterns: Look for double bottom, bullish engulfing, or strong weekly pin bars to signal a potential reversal.
2. Momentum Confirmation: A breakout above $1.95 with high volume could trigger a strong continuation to $3.11 and $4.92.
3. Macro Tailwinds: A broader recovery in Bitcoin and the crypto market could enhance bullish pressure on altcoins like RUNE.
🎯 Mid to Long-Term Bullish Targets:
$3.11 → $4.92 → $6.87+
Potential upside of 200–400%+ from current levels if bullish structure confirms.
---
🔴 Bearish Scenario (Breakdown):
📌 Critical Risk: Weekly candle close below $1.00 with volume confirmation.
1. Support Breakdown: If $1.00 fails, price may revisit previous lows around $0.80 or even test historical demand levels at $0.32.
2. Bearish Continuation Pattern: Sustained lower highs and lower lows suggest downtrend continuation unless invalidated.
3. Volume Pressure: Heavy sell volume on breakdowns reinforces bearish bias.
⚠️ Bearish Targets: $0.80 → $0.55 → $0.322 (historical low)
---
🔄 Pattern & Structure:
Historical Accumulation Zone: The yellow box has been a long-term accumulation area since 2021.
Repeat Behavior: Previous touches to this zone sparked multi-week rallies.
Potential Wyckoff Accumulation: If price forms a sideways range with rising lows, this may be the early stage of a markup phase.
---
🧠 Strategic Outlook for Traders:
✅ Bullish Strategy:
Conservative entry: Wait for breakout + retest of $1.95
Aggressive entry: Accumulate within $1.00–$1.30 zone with tight stop below $0.98
❌ Bearish Strategy:
Short setup on confirmed breakdown below $0.98
Avoid trading without confirmation of direction (no FOMO)
---
🚀 Conclusion:
RUNE is standing at a make-or-break level — a tipping point between a bullish breakout or further bearish pressure. Smart traders don't just predict direction; they prepare for both outcomes. This is not just a technical zone — it's the market’s decision point.
#RUNE #RUNEUSDT #CryptoAnalysis #AltcoinWatch #BreakoutSetup #DemandZone #TechnicalAnalysis #CryptoOutlook #BullishScenario #BearishScenario #Wyckoff
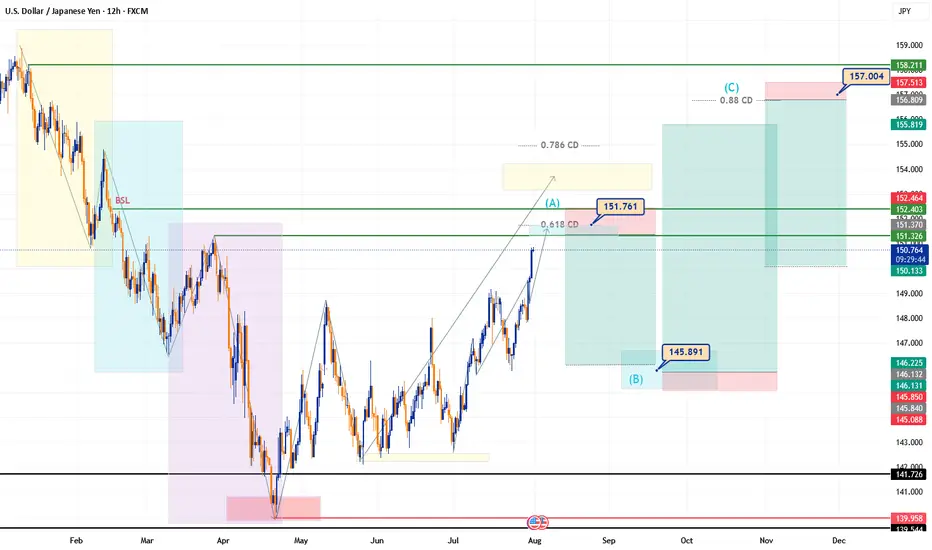
First Monthly Analysis – USDJPYThe USDJPY pair ends the month of July with a strong bullish impulse reaching 150.6, a price area that may signal the exhaustion of the uptrend that has dominated throughout the month.
An ongoing ABC harmonic structure is taking shape, with wave A likely completing between 151.36 and 152.00, which aligns with the 0.618 CD retracement — a confluence that reinforces the zone as a key resistance area.
From there, a potential bearish correction (wave B) may develop, targeting the 145.89 region. If this structure plays out correctly, a final bullish expansion (wave C) could aim for the 157.05 area.
Key Zones for the Week:
Projected exhaustion zone (wave A): 151.36 – 152.00
Expected pullback (wave B): 145.89
Final bullish target (wave C): 157.05
⚠️ Disclaimer
The correction of July’s bullish trend may begin before reaching the expected zone (151.36–152.00) due to liquidity buildup beneath current levels. A premature reversal is possible if institutional players decide to hunt that liquidity before continuing the larger move.
💬 “Sometimes it’s not about if it will get there, but when they let you in. If the party’s heating up above, check if they’re locking the door from below.”
Order Setup (Speculative Idea)
Sell Limit Order
Entry (Open): 151.362
Stop Loss (SL): 152.403
Take Profit (TP): 146.210
Risk–Reward Ratio : 4.79
Use this as a reference setup. Always manage your risk and adapt based on evolving price action
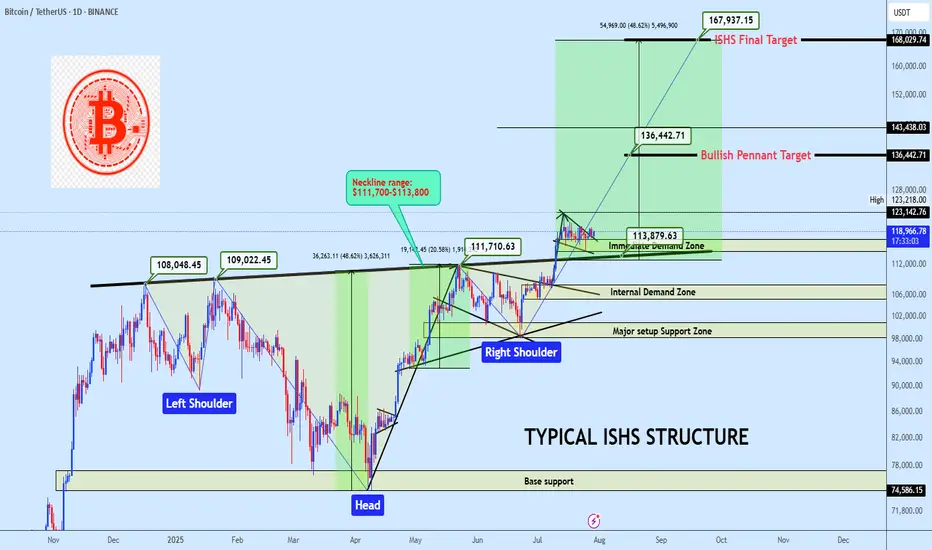
BTCUSDT ISHS Breakout with Bullish Pennant ContinuationBTC is holding above a clean neckline breakout from a inverse head and shoulders formation, currently consolidating inside a bullish pennant. A breakout from this range offers continuation potential to $136K and possibly to $168K. Bias remains bullish while price holds above the $114K region.
Market Structure
• Trend: Bullish continuation
• Pattern: Inverse Head & Shoulders + Bullish Pennant
• Price Action: Clean breakout and retest of neckline support, followed by tightening consolidation
Key Zones
• Immediate Demand Zone: $114,000 – $117,000
• Internal Demand Zone: $105,000 – $108,000
• Major Setup Support Zone: $98,000 – $101,000
• Base Support (ISHS Origin): $74,500 – $77,000
• Neckline: $111,700-$113,800 (Confirmed pivot level)
Technical Confluence
• Volume: Strong candle breakout through neckline, followed by low-volume bullish flag
• Price Geometry: ISHS measured move aligns with the final target at $168K
• Momentum: Bullish structure maintained with higher lows and reactive demand
Entry Plan
• Zone: $117,500 – $119,000
• Method: Limit buy on demand retest or breakout retest of $123K
• Execution: Swing entry with invalidation below demand base
Targets
• 🎯 TP1: $136,442 — Pennant measured move
• 🎯 TP2: $168,029 — Final ISHS target
Invalidation
• ❌ SL: Below $110,000
• Reason: Break below ISHS Neckline invalidates bullish thesis in the short term
• RRR: Estimated 1:4 depending on execution
If this structure aligns with your outlook, feel free to share your thoughts in the comments.
You’re also welcome to drop your preferred altcoins for a quick technical review.
Solana coin Long setupIn this video I go through the current price action and talk about how the 126$ target level was recently reached for a clean long entry and on the daily timeframe we printed a higher low .
I expand on my thoughts for a continuation to the upside and to retest some higher levels of resistance 180$s and time will tell if we print a higher high at the 180$s before retesting the $200 zone .

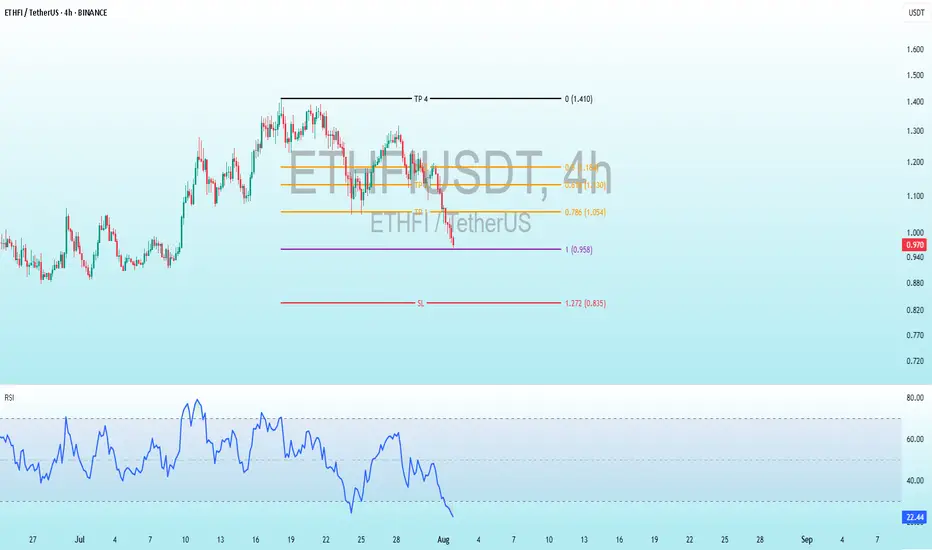
ETHFI Bullish DivergenceBINANCE:ETHFIUSDT
Trade Setup:
Target 1: 1.054 (0.786 Fibonnaci Golden Zone).
Target 2: 1.130 (0.618 Fibonnaci Golden Zone).
Target 3: 1.184 (0.786 Fibonnaci Golden Zone).
Target 4: 1.410 (0 Fibonnaci).
Stop Loss: 0.835 (1.272 Fibonnaci).
RSI Analysis: The RSI is showing a bullish divergence, suggesting potential bullish momentum. The current RSI is around 22.36, approaching oversold territory, so caution is advised.
Brett short to $0.04751Just now opened up a short position on Brett. Aiming for prior weekly demand area.
Sl: $0.04751
Tp: $0.04751
DTT strategy applied
Roughly 2RR

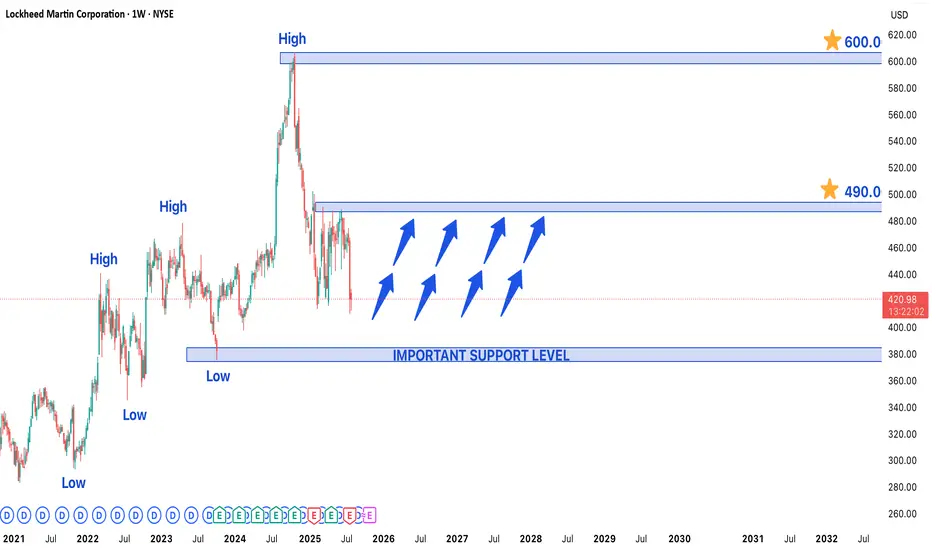
Lockheed Martin Stock in Bullish Trend - Key Levels to watchLockheed Martin (LMT) Stock in Strong Bullish Trend - Key Levels to Watch
Lockheed Martin's (LMT) stock is currently exhibiting a well-defined bullish trend, trading near a recent higher low that may serve as a crucial support level for the next upward move. The defense giant continues to benefit from robust global military spending and a strong contract pipeline, positioning the stock for potential further gains.
Technical Structure & Key Levels
- Higher Low Support: The current price zone represents a critical support area where buyers have previously stepped in, maintaining the upward trajectory
- Upside Targets:
- Near-term: $490 (previous resistance zone)
- Long-term: $600 (potential breakout extension)
- Major Support: $375 would act as strong demand zone if any deeper pullback occurs
Bullish Catalysts Supporting the Trend
1. Defense Sector Strength:
- Record US defense budget allocations for 2024-2025
- Increased NATO military spending amid global tensions
2. Contract Backlog:
- F-35 program continues to drive revenue
- Hypersonic weapons and space systems development
3. Technical Momentum:
- Price trading above key moving averages (50/200 DMA)
- Higher highs and higher lows confirm uptrend structure
Trading Strategy Considerations
- Optimal Entry:
- On bounces from current support level
- On breakout above $460 confirmation
- Risk Management:
- Stop-loss below $375 for longer-term positions
- Partial profit-taking near $490 resistance
- Confirmation Signals:
- Volume increase on upside moves
- Sustained closes above $460
Potential Risks to Monitor
- Geopolitical shifts affecting defense budgets
- Program delays (particularly in F-35 production)
- Broader market corrections impacting defense sector
Long-Term Outlook:
The combination of fundamental strength and technical positioning suggests LMT could progress toward $490 near-term, with $600 as a viable long-term target if the bullish structure holds. Traders should watch price action around current levels for continuation signals while remaining mindful of the $375 support as a critical level for the bullish thesis.
Bitcoin longBitcoin retracement at 113.000 - 114.000 range, testing the support, 1H timeframe.
Liquidating positions on the level. Then long after testing the support.

#DATA (SPOT) BINANCE:DATAUSDT
#DATA/ USDT
Entry range (0.01500- 0.01600)
SL 4H close below 0.00.01498
T1 0.0180
T1 0.0198
_______________________________________________________
Golden Advices.
********************
* collect the coin slowly in the entry range.
* Please calculate your losses before the entry.
* Do not enter any trade you find it not suitable for you.
* No FOMO - No Rush , it is a long journey.

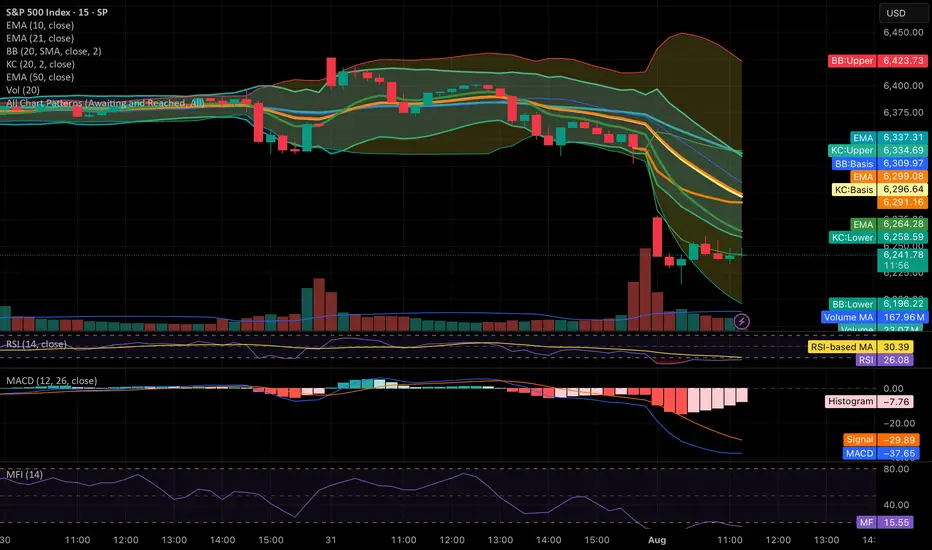
Price breakout below Keltner bandThe price has shown a breakout after the squeeze below the keltner band and may signal a more bullish trend.
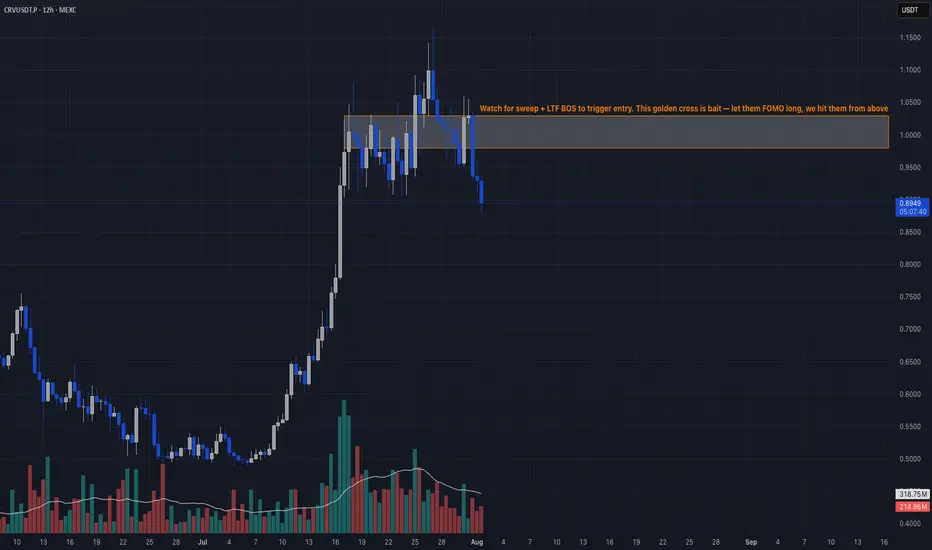
Retail Trap at Resistance📣 Team, get this…
CRV printed 5 green candles, triggered a golden cross, and suddenly every YouTube thumbnail said “TO THE MOON.” 🌝 That’s exactly the kind of retail trap we love to fade. This ain’t DeFi summer, it’s just overheated spaghetti. 🍝
🔥 TRADE SETUP
Bias: Short
Strategy: Retail Trap at Resistance
Entry: $0.98 – $1.03
SL: $1.10
TPs: $0.78, $0.65, $0.50
Why?
– RSI 83 + MACD maxed out = overcooked
– LTF CHoCH after sweeping $1.03
– Positive funding across exchanges → ripe for short squeeze reversal
– Retail buying golden cross = premium exit liquidity
Candle Craft | Signal. Structure. Execution.
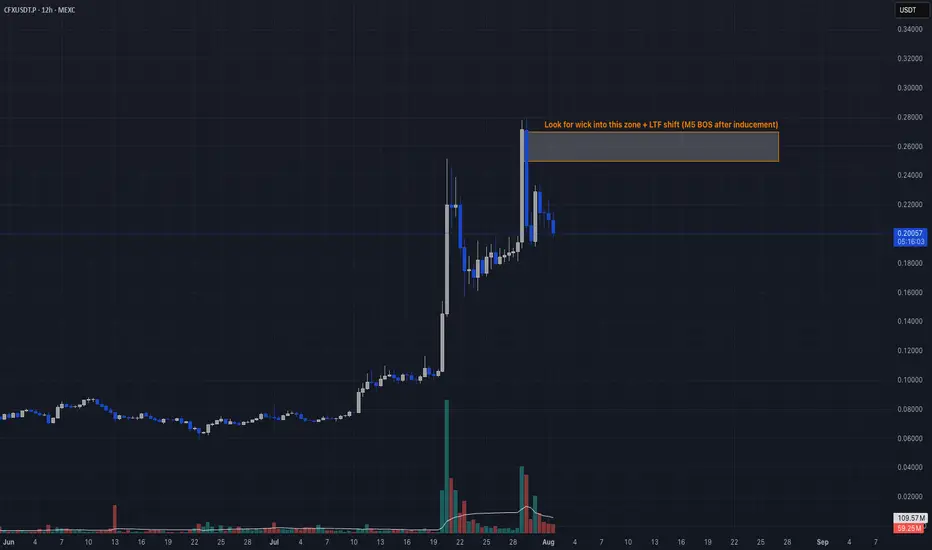
Sell-the-News Reversal📣 What’s up traders!
CFX just got injected with hopium from a pharma deal, a China stablecoin rumor, and the Conflux 3.0 upgrade… but here’s the thing: when price flies 119% and RSI hits 94, smart money starts reaching for the eject button. 🚨
🔥 TRADE SETUP
Bias: Short
Strategy: Sell-the-News Reversal
Entry: $0.25 – $0.27
SL: $0.29
TPs: $0.186, $0.145, $0.120
Why?
– HTF rally straight into resistance
– RSI 94 + $11M in short liquidations = exit liquidity confirmed
– OI and funding surged, now showing early cracks
– LTF BOS + failed continuation at highs.
Candle Craft | Signal. Structure. Execution.
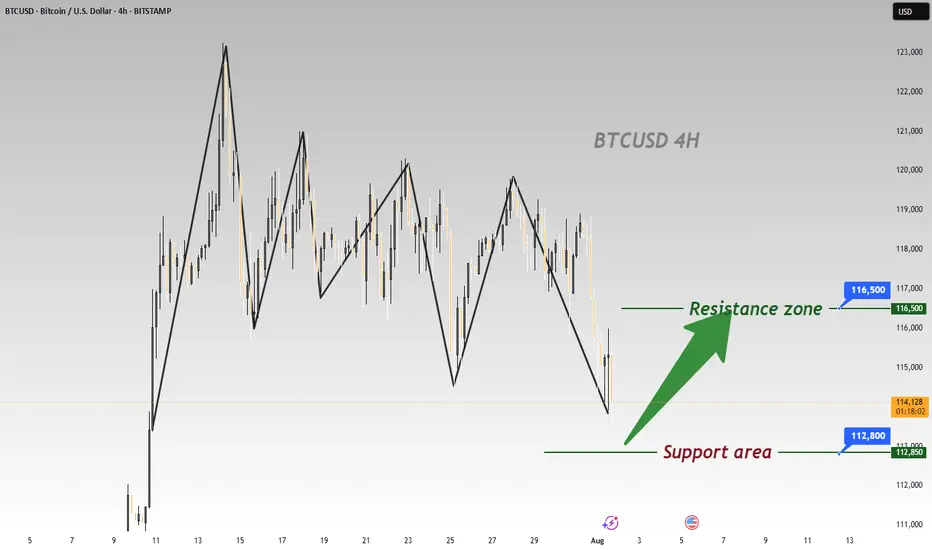
BTC Plummets Post-NFP; Go Long for Rebound to 116500BTC has plummeted significantly under the influence of the non-farm payroll data 📉, and now is an excellent opportunity to go long. Its Support level is around 112800, and according to the current trend, we can wait for a rebound to around 116500.
⚡️⚡️⚡️ BTCUSD ⚡️⚡️⚡️
🚀 Buy@ 113000 - 113800
🚀 TP 114500 - 115500 - 116500
Daily updates bring you precise trading signals 📊 When you hit a snag in trading, these signals stand as your trustworthy compass 🧭 Don’t hesitate to take a look—sincerely hoping they’ll be a huge help to you 🌟 👇
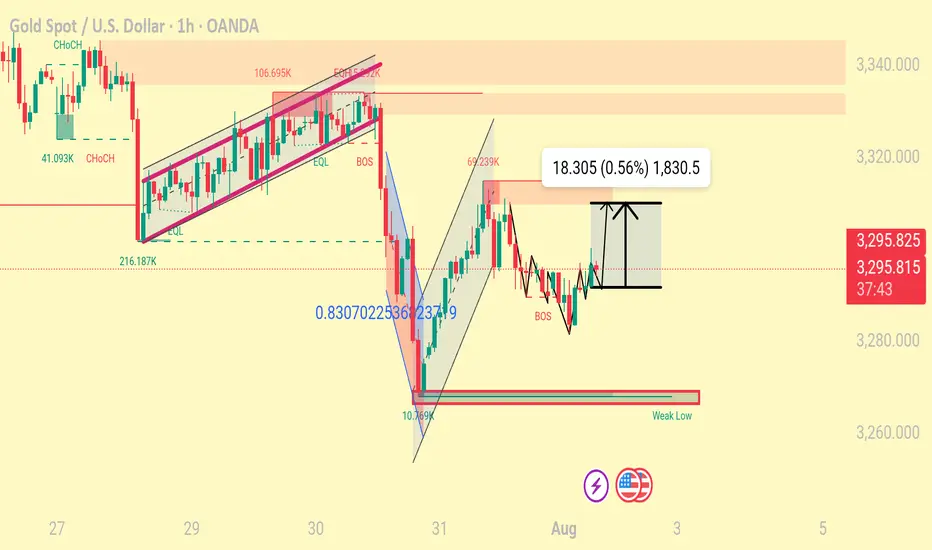
Xausd techinical analysis.Xausd techinical analysis next move posibale at h1 time frame not finchinical advice.
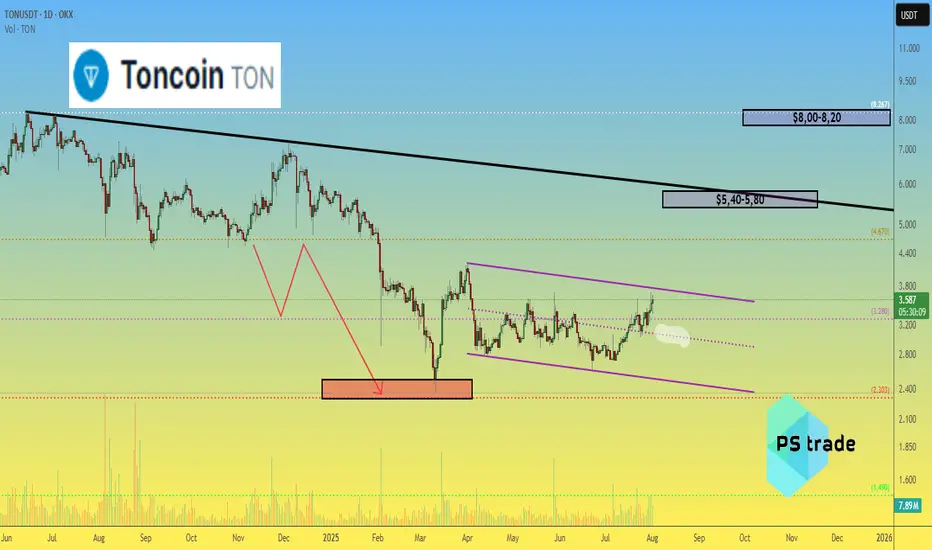
Toncoin TON price analysis💎 CRYPTOCAP:TON didn’t become a legend over the past 9 months — but at least our correction target of $2.30–2.50 played out with precision.
While most of the crypto market is currently going through a correction, #Toncoin keeps pushing upward. Still, we remain realistic:
🎯 First target: $5.40–5.80
🎯 Second target: $8.00–8.20
🚀 It’s not a “to the moon” scenario, but a potential 2x–3x from current levels is attractive.
The key support level OKX:TONUSDT remains at $3.00 — as long as it holds, the bullish trend remains valid.
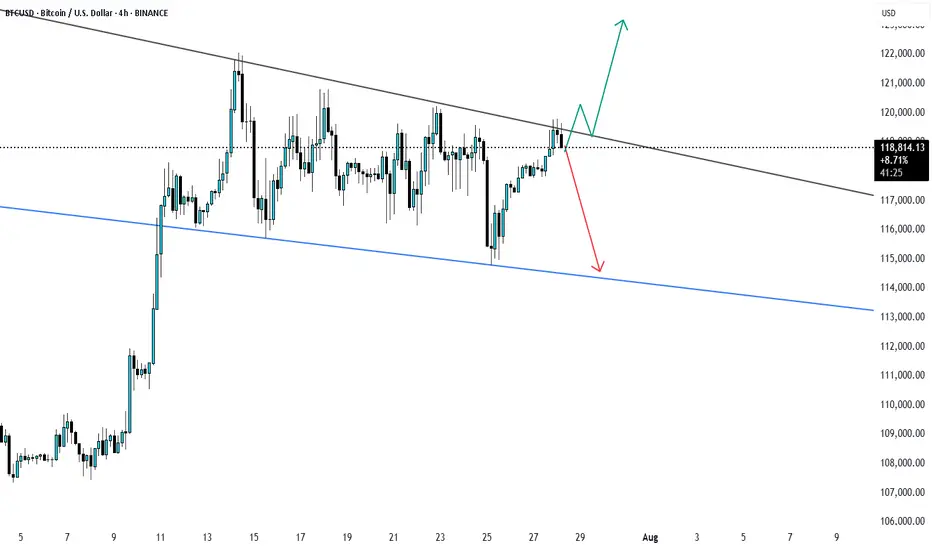
BTCUSD Possible scenario BTCUSD is trading in range bound way and soon may breakout of again go down. Enter buy only on breakout and retest til then bearish will continue.
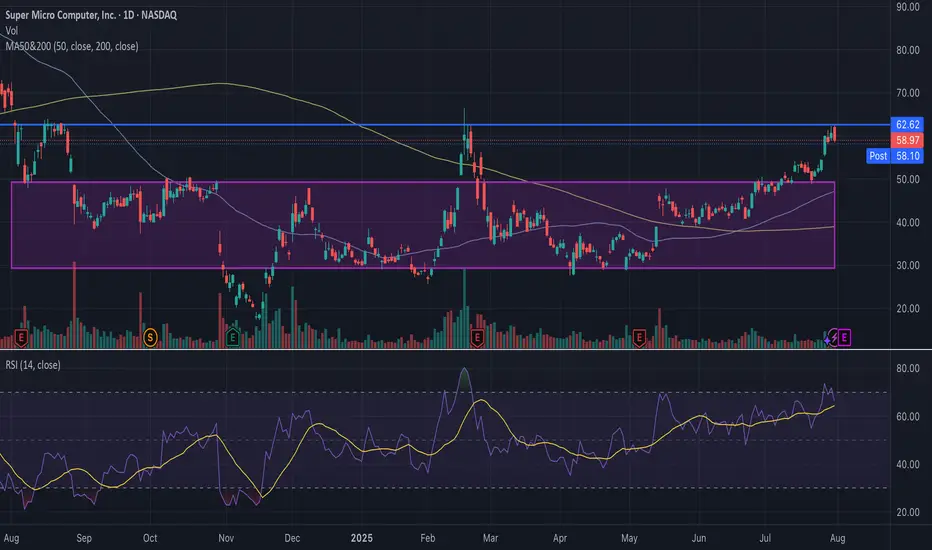
SMCI Short-Term Put PositionSMCI is currently struggling to break past a key historical trend line around $62–$63, a level that acted as resistance multiple times over the past year. The stock briefly broke above $60, but failed to hold the breakout, signaling potential exhaustion. Price is approaching overbought territory with RSI nearing 70. This move is also extended from both the 50-day (blue) and 200-day (yellow) moving averages. Additionally, volume was not exceedingly high during the breakout. I have strong conviction that it will drop to ~50. SMCI spent nearly 9 months trading between ~$33 and ~$50, as shown in the purple consolidation box. If this breakout fails, $50 becomes a natural target, as its the resistance line in the consolidation box where SMCI has been trading at for 9 months. A close below $58 (today’s low) would confirm rejection and likely accelerate selling. A put position could be highly profitable.
MNMD Weekly consolidation underway. What will earnings do?MNMD has started weekly consolidation by 2c right as ATAI and possibly CMPS end their weekly consolidations. Earnings after hours tonight had no real effect on the charts, so here are the levels I'm looking at into tomorrow. Click to watch the free video for more details
I provider regular chart analysis of the psychedelics sector. Be sure to Like and Follow, and Subscribe to future updates so you don't miss a post!
Support: 8.94, 8.79
Resistance: 9.40, 9.44

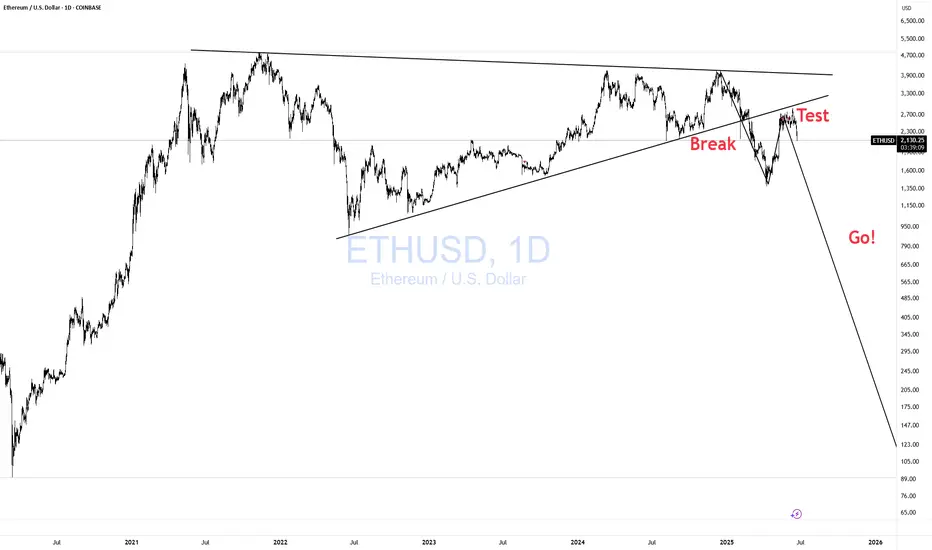
ETHUSD Break- Test- GO!!! Nothing Changed! 3rd EditionI have been warning about this for some time. Please visit my previous two posts for more info and updates.
Magic!
Click boost, follow, and subscribe for more. Let's get to 5,000 followers ))
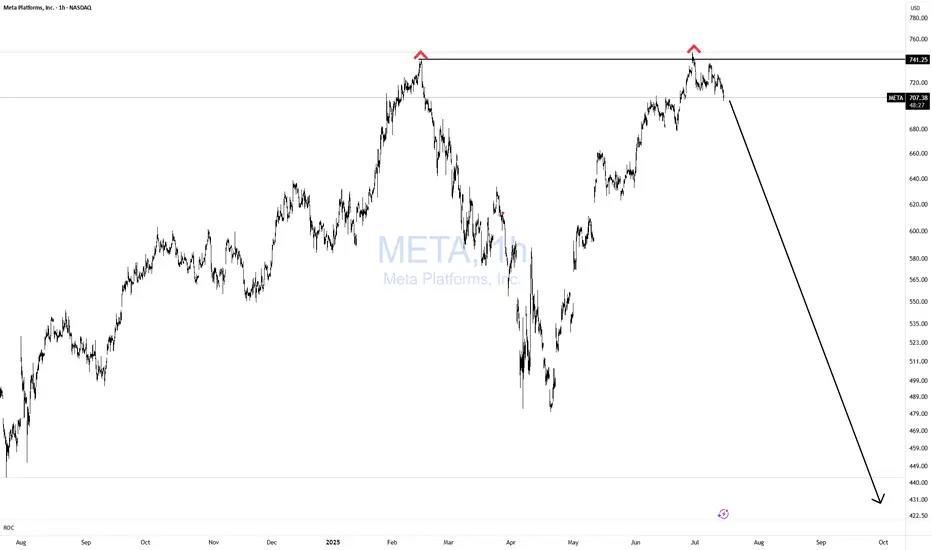
META Double Topping!Does it get any easier than this? NOPE!
If you can't spot this pattern from 1000 miles away, then you need a lot more time in the seat, training yourself in TA.
Simple with great risk reward!
Bulls GTFO!