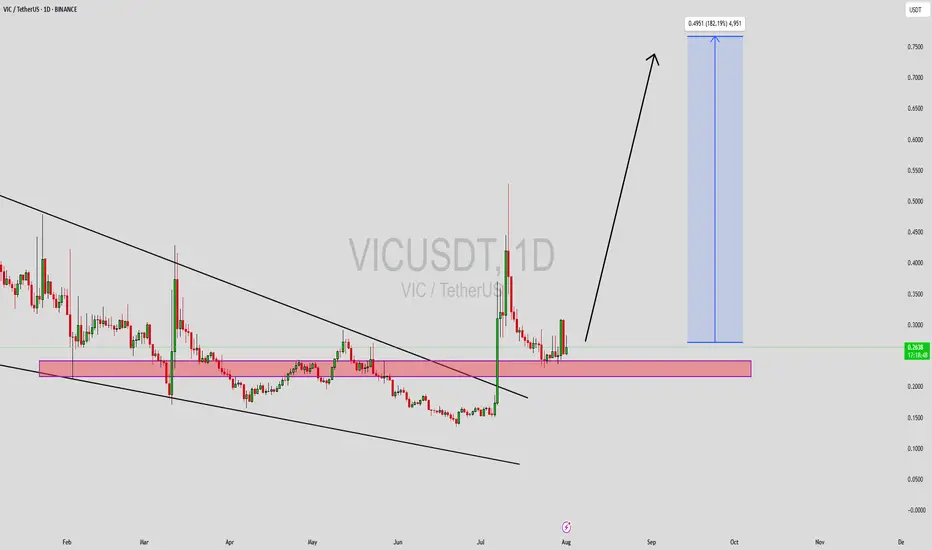
VICUSDT Forming Descending WedgeVICUSDT is currently displaying a classic descending wedge pattern, which is often recognized as a bullish reversal signal in technical analysis. This pattern typically emerges after a prolonged downtrend, and when paired with good volume — as we’re now seeing — it suggests that selling pressure is weakening and a breakout to the upside could be imminent. VIC has respected its wedge boundaries well, and now it's approaching the breakout zone, making this an ideal time for technical traders to watch closely.
Volume has been steadily increasing, which supports the idea of accumulation at the current levels. This convergence of price and volume dynamics signals that smart money may be positioning itself ahead of a potential rally. Based on the measured move from this wedge pattern, a 140% to 150% gain could be on the horizon once confirmation of breakout is secured. The price is also hovering near historical support, which adds another layer of confluence to the bullish outlook.
With investor interest rising and sentiment shifting, VICUSDT has the potential to outperform in the coming sessions. Altcoins that consolidate in well-defined reversal patterns and attract volume are often primed for explosive moves. Traders looking for setups with strong technical structure, breakout confirmation, and momentum alignment may find VICUSDT to be one of the top candidates for mid-term gains.
This is a high-reward opportunity for patient and disciplined traders. Keep an eye on resistance breakout levels and volume surges, as they may trigger the start of a powerful trend reversal.
✅ Show your support by hitting the like button and
✅ Leaving a comment below! (What is You opinion about this Coin)
Your feedback and engagement keep me inspired to share more insightful market analysis with you!
Trend Analysis
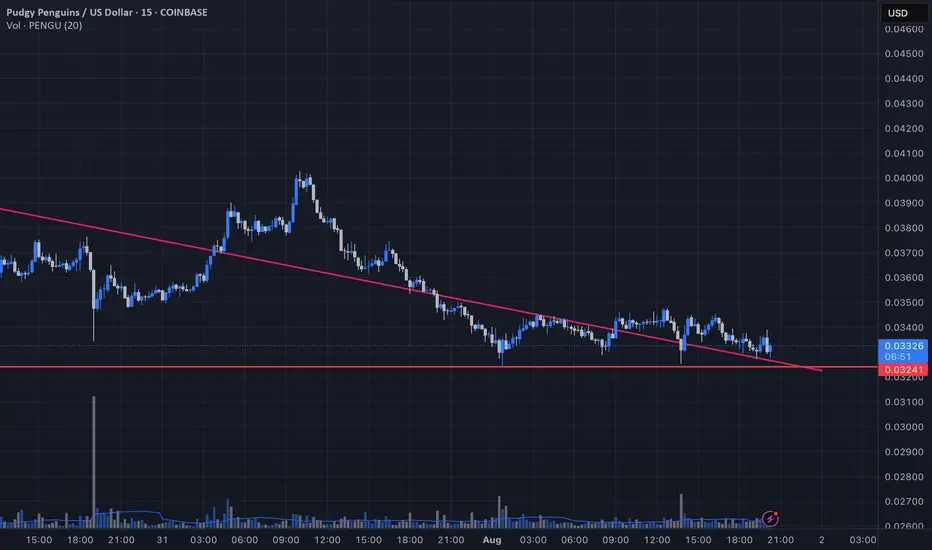
Pengu supportLooks like we have had a few runs to the highs from breaks of downward channels. Ended up forming a double top but have found some seemingly strong support levels here at the top end of a previous pennant break.
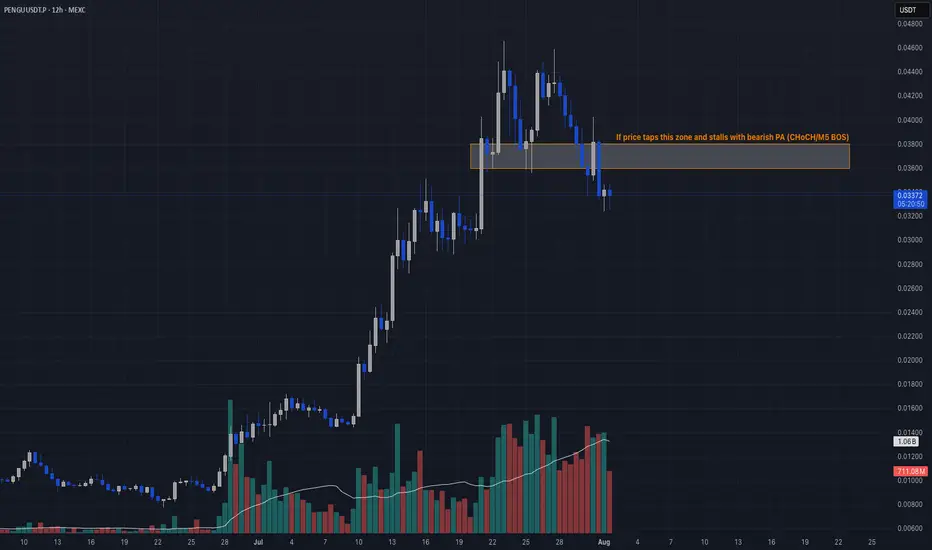
Insider Selloff + Liquidity Sweep🔻 PENGU/USDT TRADE IDEA 🔻
📣 Hey CandleCraft crew!
Today we’re diving into a chilly little bird that flew a bit too close to the heat. 🐧 PENGU pumped hard — but when team wallets start dumping $17M worth of tokens, that’s not bullish, that’s suspicious. Think iceberg ahead.
🔥 TRADE SETUP
Bias: Short
Strategy: Insider Selloff + Liquidity Sweep
Entry: $0.036 – $0.038
SL: $0.041
TPs: $0.030, $0.025, $0.018
Why?
– HTF sweep of liquidity above $0.04
– Insider wallet moved 485M tokens to exchanges
– LTF CHoCH + RSI breakdown
– Price hovering under 20-day EMA with weakening volume.
Candle Craft | Signal. Structure. Execution.
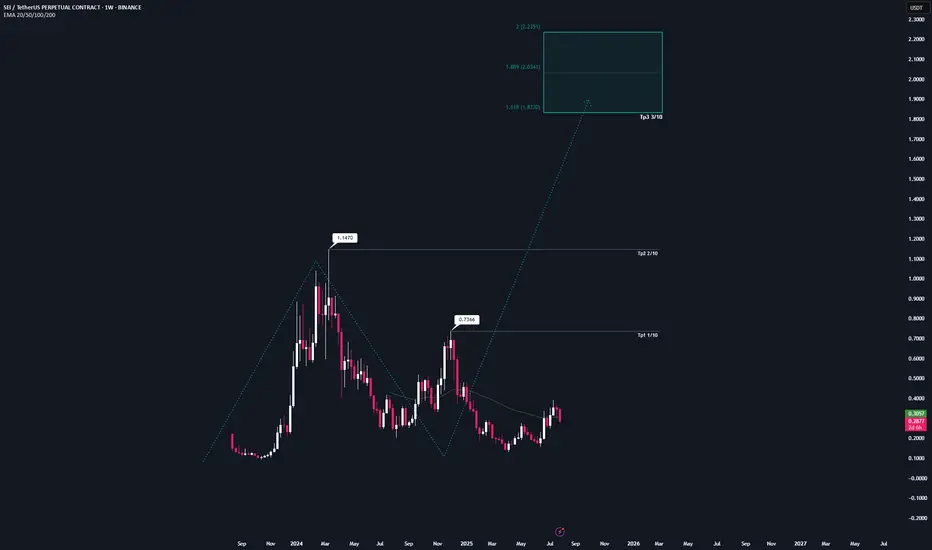
SEI | Full AnalysisHere is the top-down analysis for Sei as requested 🫡
Weekly Timeframe:
We have a potential large structure forming on the weekly chart that will be activated once we break the ATH. Its target zone lies between $1.8 and $2.2.
My sell targets for SEI this cycle are:
TP1: $0.73
TP2: $1.14
TP3: $1.83
These are my sell targets based on my technical analysis. However, I won’t rely on them alone — I also follow several on-chain indicators. Once retail euphoria kicks in and my indicators trigger, I’ll start selling accordingly.
Daily chart:
On the daily, we have a sequence that has already been activated and almost reached its target zone. That’s why the B–C correction level remains a valid buy zone, which I’ll also use for additional long entries.
This would be the second attempt from a B–C correction level, as we’ve already tapped it once (where I went long) and I’ll be entering again here.
Target zone for this sequence: $0.39–$0.44
Local Price action:
On the lower timeframe, we’ve just completed a bearish structure that perfectly overlaps with the B–C correction level. This increases the probability of this setup significantly, as both sides (bulls and bears) want the same thing here: bulls are buying the market, while bears are covering shorts and taking profits.
-----
Thats the my full Analysis for SEI, hope it was helpful if you want me to do another analysis for any other pair just comment down below.
Also, if anyone is interested in how my trading system works, let me know and I’ll post some educational content about it.
Thanks for reading❤️
XRPUSDT → Range formation. Retest of resistanceBINANCE:XRPUSDT.P , after a false breakout of the daily resistance level of 3.352 and the elimination of traders, has entered a correction phase. The trading range shown below has been formed, with an emphasis on resistance...
XRP previously formed a false breakout of the daily resistance level of 3.352, as indicated in the idea above. After changing its market character, the price entered a correction phase. Focus on the range of 3.00 - 3.264. A retest of resistance (zone of interest and liquidity) is possible before falling to 3.161, 3.05 or to the liquidity zone of 3.00. There are no technical or fundamental reasons for exiting the consolidation; most likely, a retest of the zone of interest may end in manipulation and a pullback to support...
Resistance levels: 3.1609, 3.264, 3.352
Support levels: 3.05, 3.00
I do not rule out the fact that a retest of the 3.264 resistance level may have a breakout structure and the price will continue to rise, but based on the price behavior pattern on D1, the market structure, and market stagnation, I conclude that at the moment, the chances of seeing a correction from resistance are higher. Further developments will need to be considered after the retest of key zones on the chart...
Best regards, R. Linda!

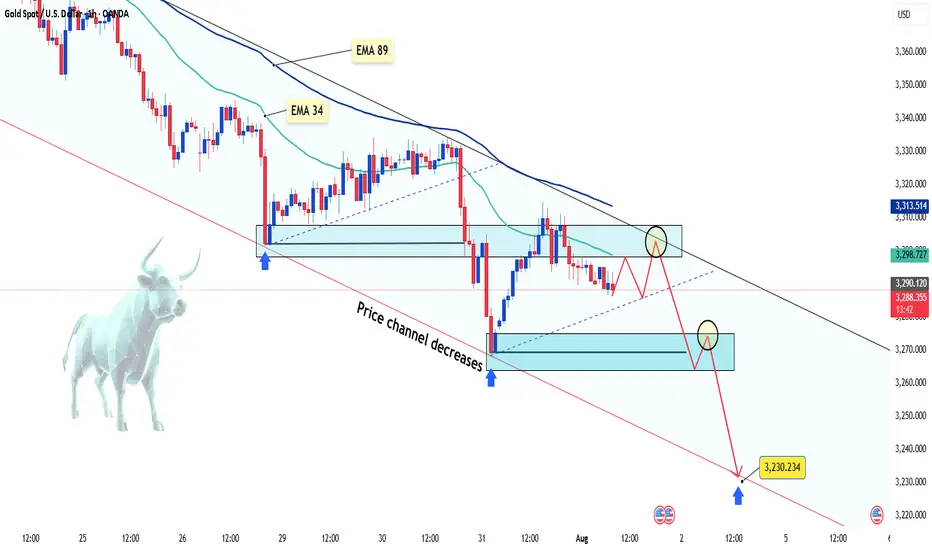
Gold keeps falling – is there more to come?Hello everyone, great to see you again!
Today, gold remains under pressure following a series of strong U.S. economic data releases, which have reinforced expectations that the Federal Reserve will keep interest rates elevated for longer. As a result, the U.S. dollar has strengthened, Treasury yields have climbed, and gold has lost its footing.
On the H1 chart, XAUUSD is clearly trading within a descending price channel. Both the EMA 34 and EMA 89 are acting as dynamic resistance zones. Recent attempts to rally have consistently failed at these levels, mirroring the bearish setup seen before July 29.
Currently, price is retesting a minor resistance area. If this retest fails, the next downside targets lie near 3,270 – and potentially down to 3,230 USD, which aligns with the lower boundary of the price channel.
From my perspective, the bearish momentum is likely to continue.
What about you? How do you think gold will close the day?
Meme Coin Liquidity Trap📣 Hey CandleCraft fam, remember this one?
We nailed the previous BONK long — while it didn’t tag the absolute top, it delivered us a clean, sharp profit right out of the gate. Now? The story has flipped. Meme energy is fading, funding flipped, and the structure’s screaming reversal. Let’s see how this short idea plays out. 🐶💨
The dog barked loud — BONK went full meme mode with a 203% pump… but now it’s giving off that “walk of shame” energy. 🐶 RSI tanked, funding flipped, and it’s bleeding liquidity. Who let the dogs out? Probably market makers.
🔥 TRADE SETUP
Bias: Short
Strategy: Meme Coin Liquidity Trap
Entry: $0.0000355 – $0.0000370
SL: $0.0000400
TPs: $0.000030, $0.000025, $0.000020
Why?
– Overextended meme coin pullback
– Funding rate negative = longs bleeding
– OI down 35%, RSI from 85 → sub-50
– Price hovering under 20-day EMA support
Candle Craft | Signal. Structure. Execution.

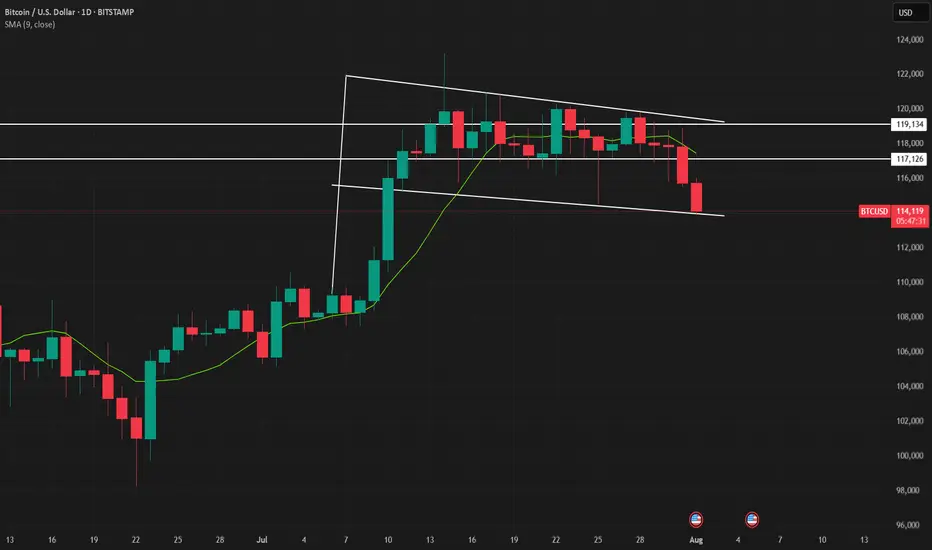
Bitcoin Bull Flag - will it collapse?Bitcoin is currently in a bull flag.
Will it hold — or collapse?
The weekly close will decide.
🔹 If BTC closes above the bull flag support: Possible continuation of the rally.
🔻 If BTC closes below the flag: Expect a deeper correction.
Stay sharp. The weekly close is key IMO.
No FA. DYOR! For educational purpose only.
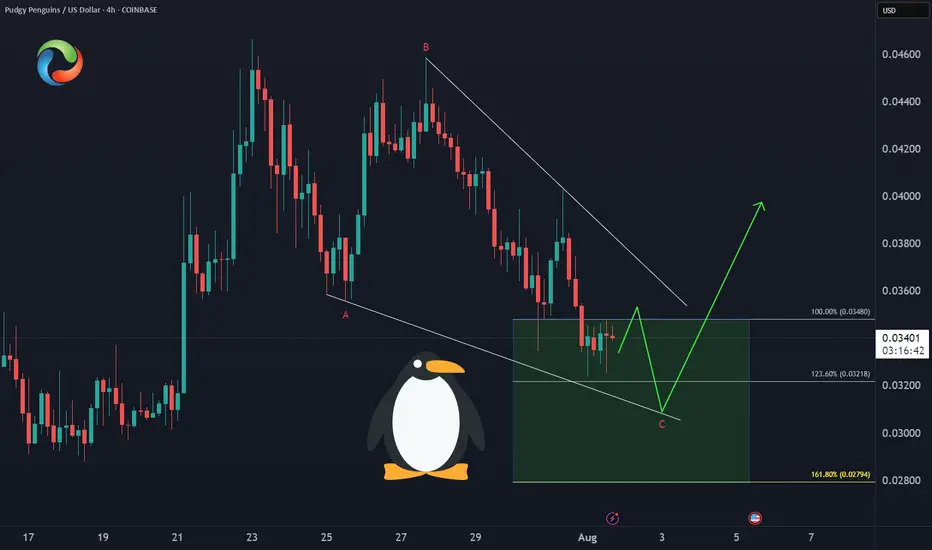
PENGU Enters Demand ZoneCOINBASE:PENGUUSD 🐧Price has developed a clean A-B-C correction into the equal legs support zone at $0.034-$0.028, offering:
✅ Optimal risk/reward entry
✅ Wave structure confirmation
✅ Higher low potential
This is the technical sweet spot for the next rally leg.
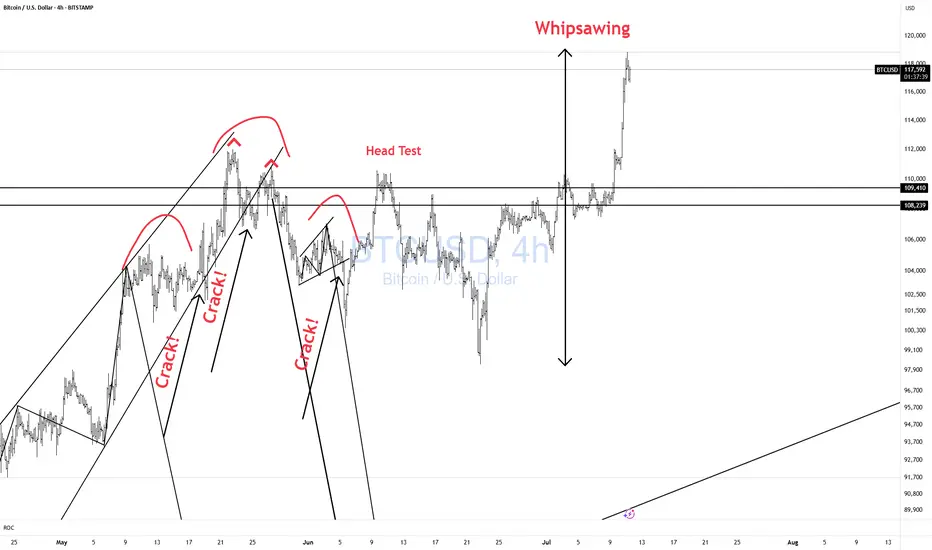
BTCUSD Whipsawing! CAUTION!Bulls CAUTION! Price is whipsawing all over the place.
Better to be out of the market wishing you were in than in wishing you were out!! Don't chase!!
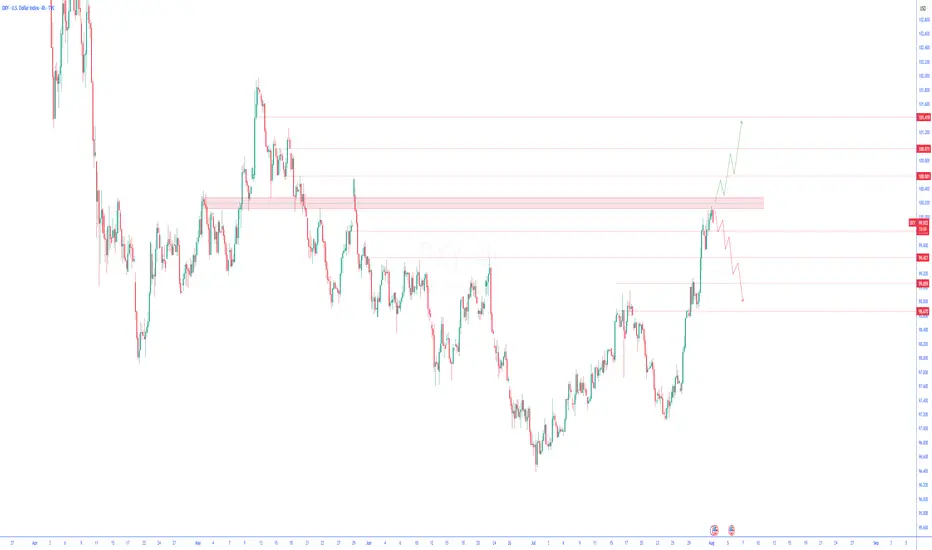
U.S. Dollar Index (DXY) Technical Analysis – 4-Hour TimeframeU.S. Dollar Index (DXY) Technical Analysis – 4-Hour Timeframe
Following yesterday’s economic data from the United States, which included stronger-than-expected GDP growth and consumer confidence figures, the U.S. Dollar Index (DXY) has continued its upward trend with strength. These developments have reinforced expectations for continued monetary tightening—or at least keeping interest rates elevated—which in turn has boosted demand for the dollar.
On the 4-hour chart, after a strong bullish rally, the dollar index has now reached a key resistance zone that previously acted as a major barrier.
Bullish Scenario:
If the current resistance zone is decisively broken and price stabilizes above it, the bullish momentum could extend further toward higher technical levels. This scenario would gain additional strength if upcoming economic data continues to support the dollar.
Bearish Scenario:
However, if the price fails to break through the resistance and signs of buyer weakness begin to emerge, a corrective pullback toward previous support levels may occur. This scenario could be further intensified if weaker economic data is released or if the Federal Reserve signals a more dovish stance.
At the moment, traders are advised to closely monitor the price reaction to the current zone and wait for confirmation before committing to the next move.
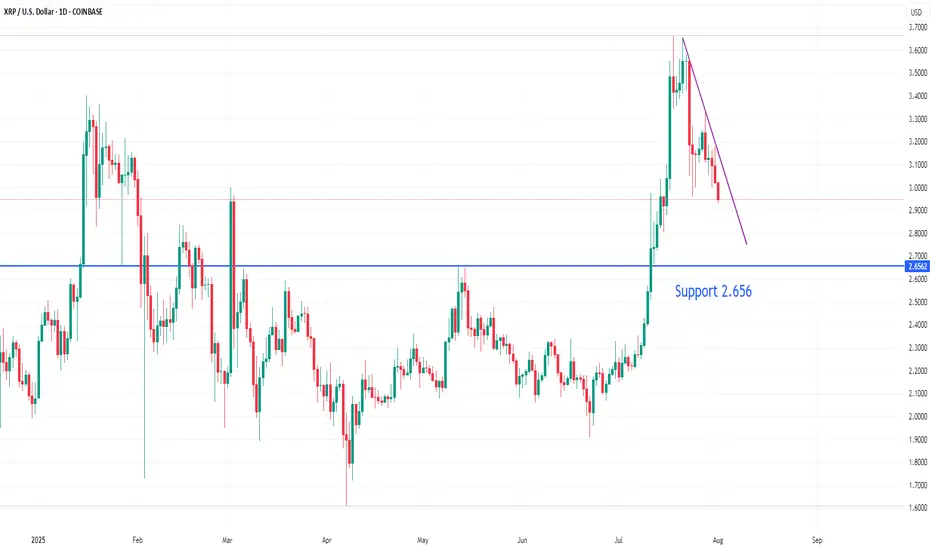
XRPUSD downside target 2.656On the daily chart, XRPUSD has retreated from its highs, with short-term bears dominating. Currently, the price is in a downward trend, so shorting near the downtrend line resistance is recommended, with a target around 2.656.
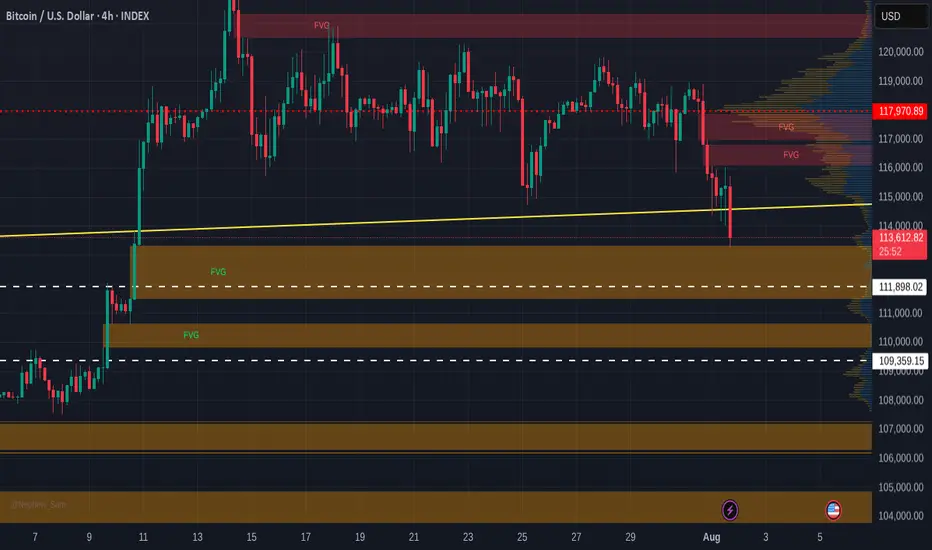
Bitcoin Free Value Gaps getting filled - 109 K target >
If you look back at the last time I posted a chart with Free Value Gaps ( FVG ) you will see an orange bar where PA currently sits...The reason it is no longer there is because it ogt "Filled"
It is much the sameidea as CME Gaps. Thay also get filled very often/
So, we can see 2 more FVG before 107K line and so, in the current market state and with the knowledge that in August, Markets often Dip, we may well see PA retreat to the Gap at 109K
What a superb buying oppertunity
End of post as I am enjoying an evening in the south of France, with wine and Fun..
What it stopping you ?
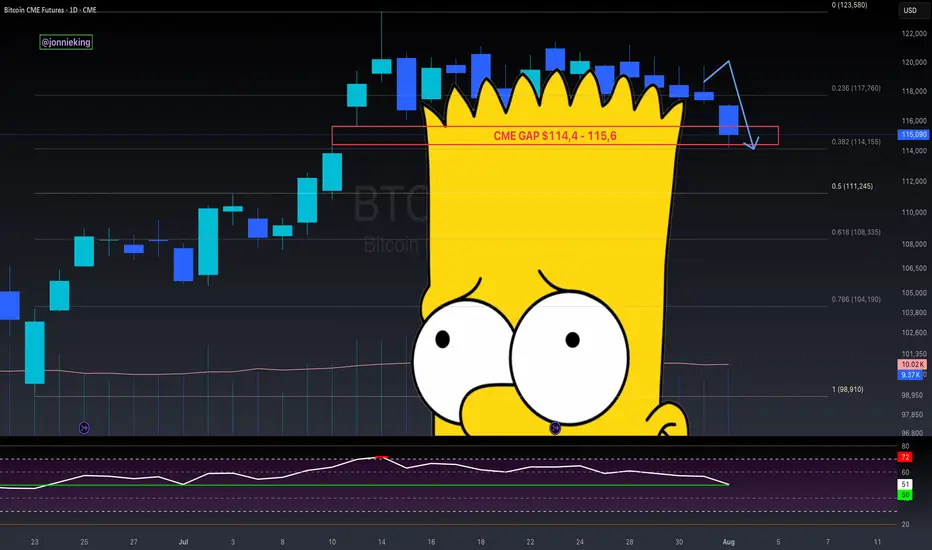
$BTC CME Gap + Bad Bart = Easiest Short EverCME Gap + Bad Bart is like taking candy from a baby 👨🏻🍼
Look at that textbook bounce off the .382 Fib 🤓
Pain ain’t over folks.
RSI still shows room on the downside 📉
Global Liquidity drain on the 4th.
Looking like the 50% Gann Level is next ~$111k
Get those bids in 😎
And never forget the BullTards who were telling you about the “Bollinger Band Squeeze” and UpOnly season 🫠
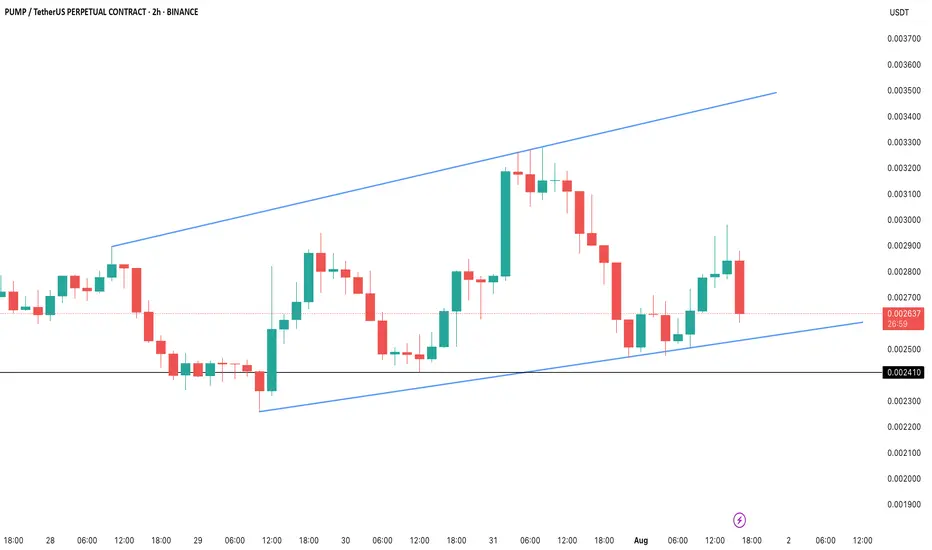
PUMP/USDT: Whales Buy the Dip as Price Holds Key LevelBINANCE:PUMPUSDT.P price has taken a steep 18% hit in the last 24 hours, but the 2-hour chart shows BINANCE:PUMPUSDT.P price action clinging to a critical Fibonacci support near $0.00259. The token is still trading inside an ascending channel, hinting that the bullish structure hasn’t fully broken yet.
Whales have been scooping up the dip aggressively, adding 5.4 billion PUMP tokens over the past week (a 35.8% jump in their holdings). Despite retail selling pushing netflows positive intraday, big wallets continue to absorb supply. Daily accumulation is also up 3.2% in the last 24 hours, reinforcing the demand floor near current levels.
Meanwhile, long positions dominate the liquidation setup, with $7.88 billion in longs versus just $3.6 billion in shorts. If BINANCE:PUMPUSDT.P price bounces, a cascade of short liquidations could amplify the recovery rally. But failure to defend $0.00259 risks opening the door to $0.00241, putting bulls on the back foot.
For now, the $0.00259–$0.00260 zone is the make-or-break level. Holding above keeps BINANCE:PUMPUSDT.P price inside the bullish channel, setting up a potential retest of $0.00284–$0.00294. A breakdown, however, could flip sentiment sharply bearish.
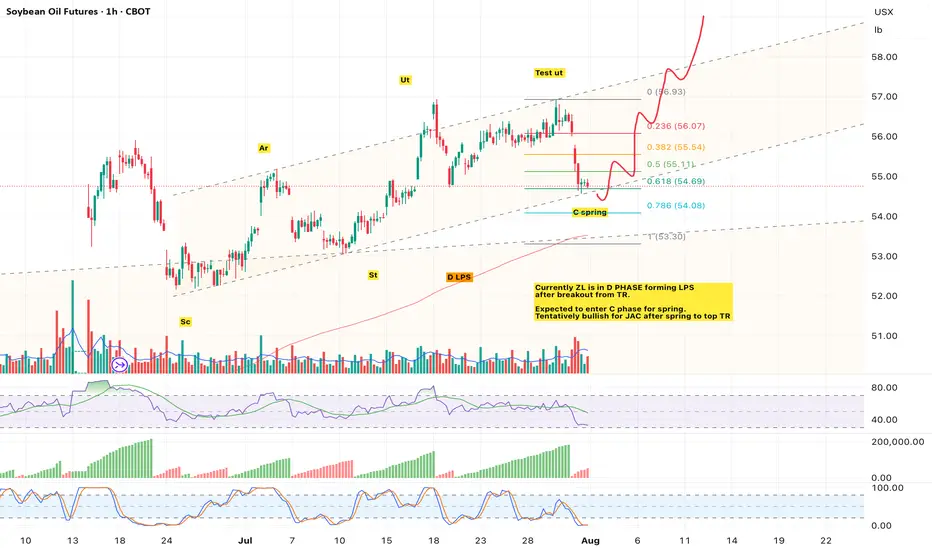
ZL ON LAST POINT OF SUPPORTExpected to enter C phase and rebound to top TR for JAC before continuing markup.
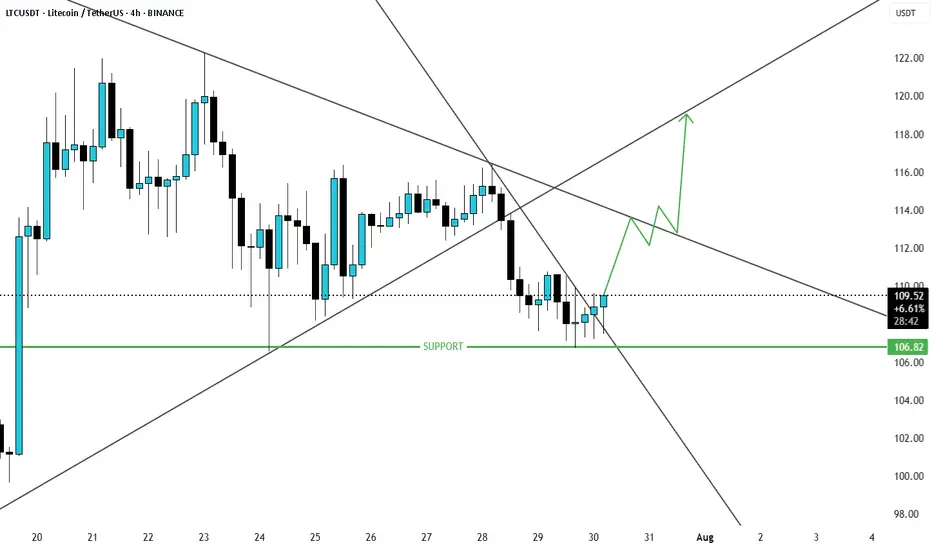
LTCUSD Possible Scenario breakout of trendline resistanceLTCUSD is at major support and has now broken the resistance and price will likely will move up.
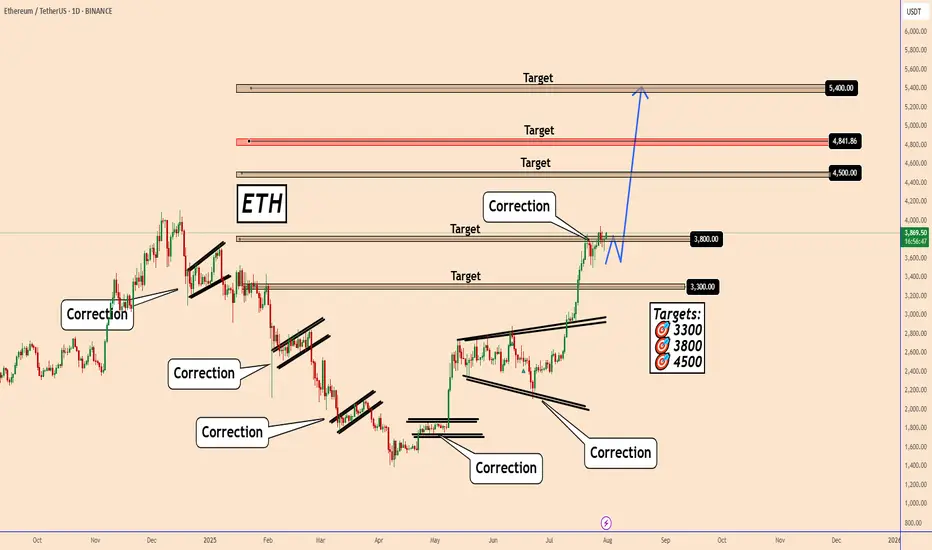
Ethereum: Bullish Momentum Recharging for the Next Leg UpEthereum: Bullish Momentum Recharging for the Next Leg Up
Daily Perspective on ETH Ethereum remains in a clear bullish trend on the daily chart. The long and consistent green waves reflect strong upward momentum over the past several days and weeks.
Looking left on the chart, ETH previously made several corrective moves during bearish phases. The current correction looks similar to those on the left side of the chart, but this time it is taking place within an uptrend.
The price is currently in a consolidation phase, likely preparing for another push higher. I’m watching three key upside targets: 4500, 4840, and 5400.
You may find more details in the chart!
Thank you and Good Luck!
PS: Please support with a like or comment if you find this analysis useful for your trading day
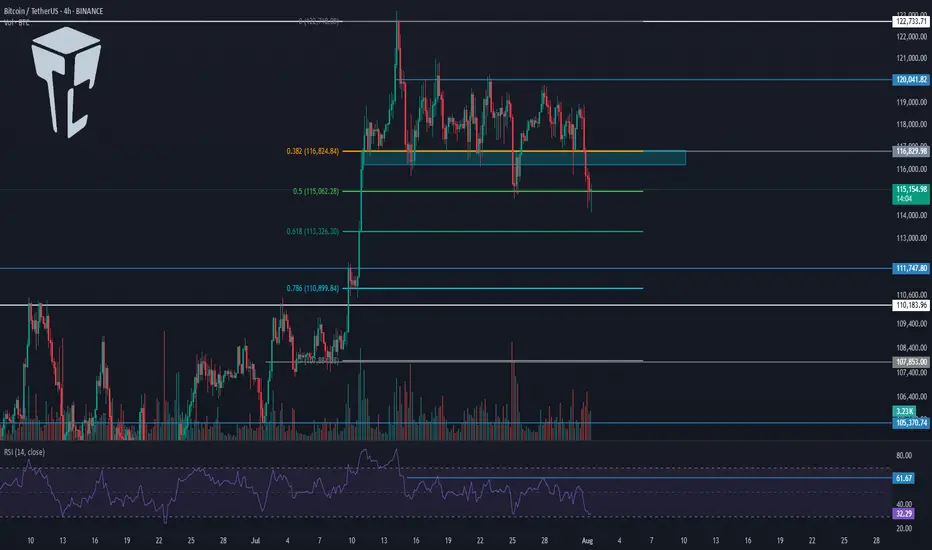
TradeCityPro | Bitcoin Daily Analysis #141👋 Welcome to TradeCity Pro!
Let’s dive into Bitcoin analysis. Yesterday, the exact bearish scenario I told you about happened. Let’s see what opportunities the market is offering us today.
⏳ 4-Hour Timeframe
Yesterday, I mentioned that the price had tested the 116829 zone too many times and that this area had become very weak. I also said that if the price made a lower high than 120041, deeper corrections would be likely.
✔️ Another perspective I have on the market is that sometimes certain support and resistance levels simply aren’t strong enough to continue the trend.
🔑 For example, in this case — despite Bitcoin being in an uptrend across all cycles — the 116829 support couldn’t hold, and the price broke it to reach a stronger support zone, one that might be capable of continuing the trend.
📊 Right now, this is what might be happening again. Support levels like 0.5, 0.618, and 0.786 Fibonacci retracement zones could be where the next bullish leg begins.
✅ At the moment, price has reached the 0.5 Fibonacci level, and the previous strong bearish momentum has slightly weakened. If you look at the volume, momentum is still in favor of sellers, but based on the long lower wicks on the candles, we can say the bearish trend is showing signs of weakness.
💥 On the other hand, RSI is approaching 30, and in an uptrend, when RSI nears the Oversold zone, it can often be a good entry point for a long. However, we’re not acting on this yet — we’ll wait for more confirmations before opening any positions.
⭐ For now, there’s no trigger for a long position on this timeframe. A break below 115000 could act as a short trigger, but given the trend Bitcoin is in, I’m not opening any short positions at the moment.
⏳ 1-Hour Timeframe
The price has dropped down to 114560, and I believe today we might enter a corrective phase. However, if the price stabilizes below 114560, the correction could continue. The next targets would be the Fibonacci levels from the 4-hour timeframe.
🔽 I won’t open a short position with the break of 114560, and I suggest you don’t take that short either.
📈 If this move turns out to be a fakeout, the first trigger we have now is at 118736, which is quite far from the current price. For this trigger to activate, we’d need to see a V-pattern form.
🔍 There are no other triggers right now. But if more range structure forms, we might consider opening a risky long on the breakout of the range top.
❌ Disclaimer ❌
Trading futures is highly risky and dangerous. If you're not an expert, these triggers may not be suitable for you. You should first learn risk and capital management. You can also use the educational content from this channel.
Finally, these triggers reflect my personal opinions on price action, and the market may move completely against this analysis. So, do your own research before opening any position.
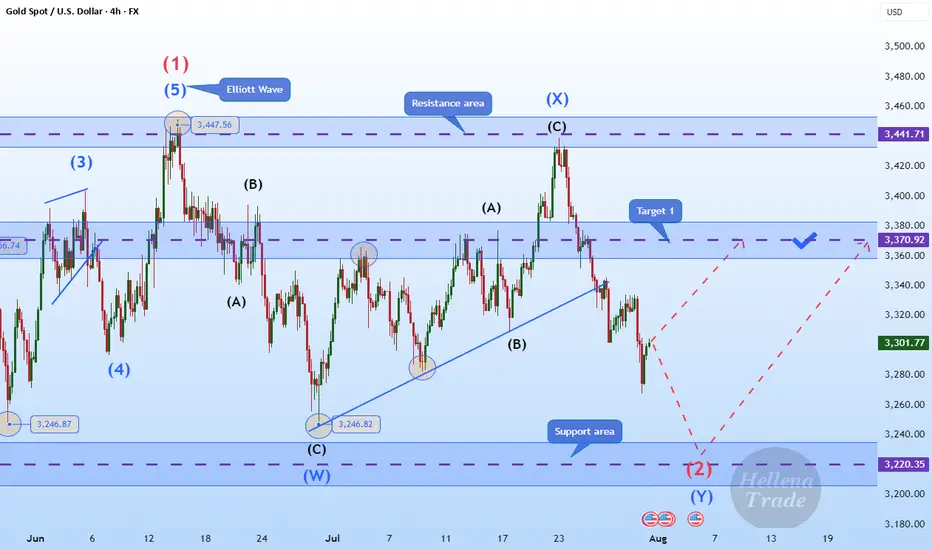
Hellena | GOLD (4H): LONG to area of 3370 (Wave 2).Colleagues, gold is once again disrupting our plans, and I have to revise the wave marking. It's not easy, but the most important thing is to keep doing it.
Now I'm back to the previous marking — the price is in wave “2” correction.
To complete this wave, the price needs to overcome the level of wave “W” of the middle order 3246.82. Then the correction will be completed and wave “3” will begin an upward movement.
I see the minimum target in the area of the 3370 level.
Manage your capital correctly and competently! Only enter trades based on reliable patterns!
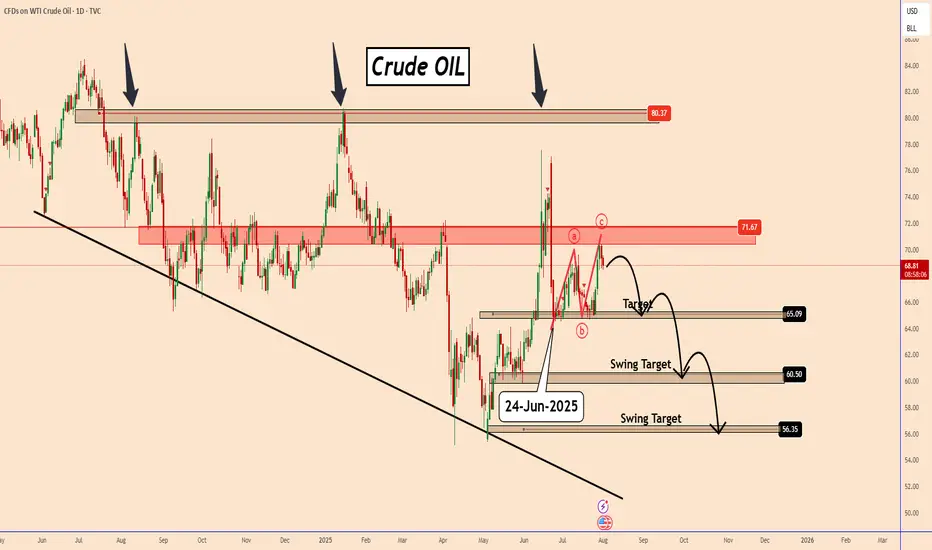
Oil Faces Bearish Turn After Speculative SpikeOil Faces Bearish Turn After Speculative Spike
Since June 24, 2024, when oil prices reached $64 entered a 38-day bullish correction. Based on the chart, this move appears to be forming an ABC corrective pattern, which may now be nearing completion.
From here, a renewed decline is likely, with potential downside targets at $65, $60, and $56.
Geopolitical Speculation Oil prices jumped in recent days following President Donald Trump's heightened rhetoric toward Russia. His announcement of a tighter deadline to end the war in Ukraine, along with tariff threats targeting countries trading Russian oil, stirred market reactions.
However, this rally seems driven more by speculation, and oil may soon resume the bearish movement again.
You may find more details in the chart!
Thank you and Good Luck!
PS: Please support with a like or comment if you find this analysis useful for your trading day
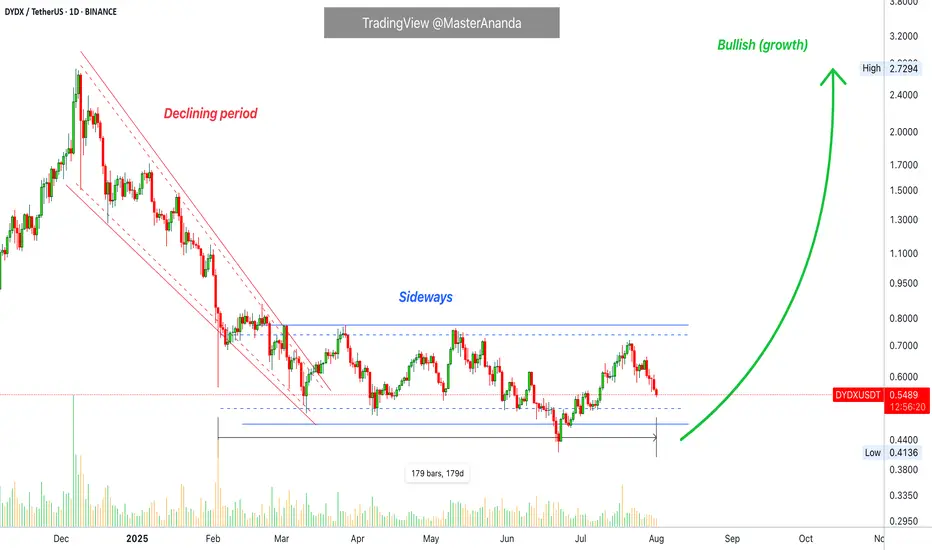
dYdX Bottom Consolidation Continues, Bullish NextHere you are looking at the formation of a bottom. The formation is a process not a single day event. It can take months for a bottom to fully form.
The way you know this to be true is because there is no downtrend. There are no new lows.
DYDX has been sideways now for 179 days, 6 months. Since early February 2025. In just three months, between December 2024 and March 2025, there is a very strong decline; lower highs and lower lows. A bearish move, a down-wave, a downtrend.
Ever since February the downtrend is no more. Rather than new major lows we have shy lower lows and finally not even that, no new lows. You can see the pattern how the market turned from bearish to sideways. This is the transition period. From sideways it will turn bullish, bullish goes next.
This is the point in time when most people will lose patiently and fold at a loss. Sell at the bottom, near support. This is the most important time to be patient, to accumulate, to even buy more and hold because we are looking at bottom prices. When prices are trading at the bottom and you are a bull, you can't go wrong.
Buy and hold. Continue holding because the market will soon turn.
Namaste.