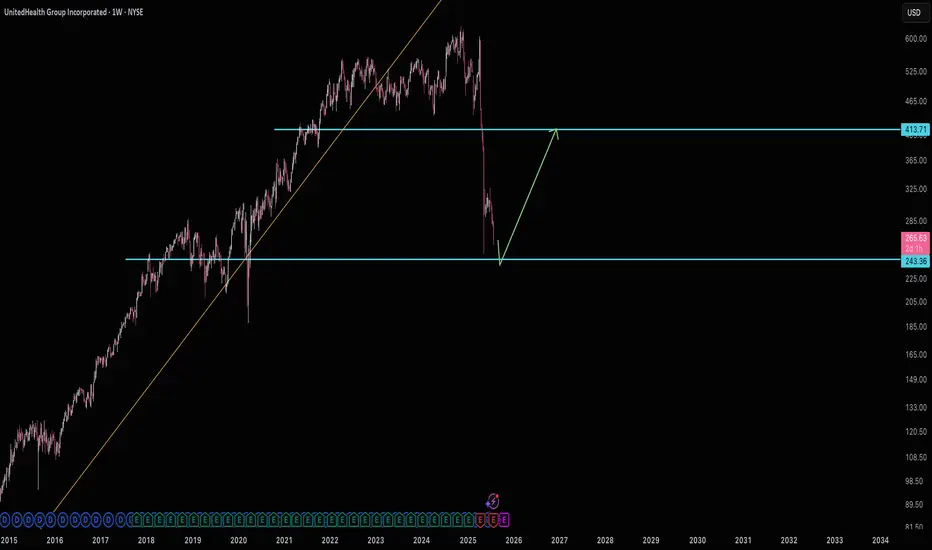
Waiting for $243 United HealthUNH has obviously taken a beating. It's managed to get so close to support many a few times now, yet hasn't hit yet. So if $243 does hit, then plan on targeting $410.
Good luck!
Trend Analysis
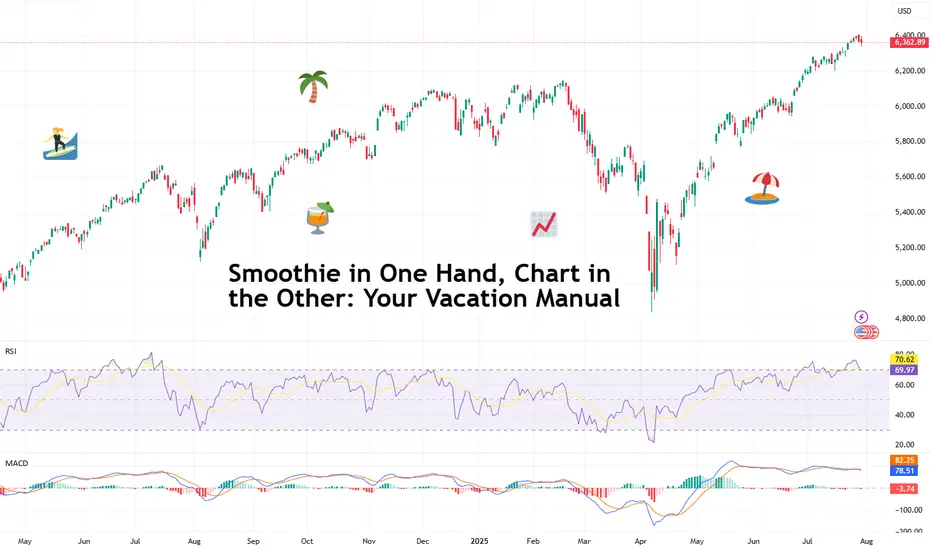
Smoothie in One Hand, Chart in the Other: Your Vacation ManualSome traders bring a beach read. Others bring their TradingView charts.
It’s the heat of the summer and we figured, why not take it easy with a breeze of lightweight lines to pair with your mezcal espresso martini? Let’s talk about how to relax while still watching the markets.
🏄♂️ Market Never Sleeps… But You Should
Vacations are supposed to be about unplugging, but for traders, that’s just code for “I’ll switch to the app instead.”
And we don’t blame you. With all that’s going on — US-EU tariff deal, stocks at record highs, and Ethereum BITSTAMP:ETHUSD outperforming Bitcoin BITSTAMP:BTCUSD in a monster July run — it’s only natural for market participants to be hooked at this time.
But watch for those signs of getting overly attached. Studies show performance suffers when you're overcooked — like your last scalp trade on Powell Day. So yes, that mojito matters. Just don’t place a leveraged position on a pool float.
📅 Timing the Market… and Your Booking
Let’s talk timing. The pros know not to schedule getaways during Nonfarm Payrolls week or FOMC decision day. (Unless your idea of relaxing is explaining yield curves to your kids on a ferry across lake Como.)
Instead, try planning your time off during historically low-volatility periods. Summer often sees volume dry up like your skin without sunscreen. Think August’s fairly dry weeks — when even the algorithms seem to be on holiday. As always, consult with the Economic Calendar to know when these are.
Bonus tip: if you’re flying and you wanna stay wired in, go for premarket or after-hours shifts. Nothing says “seasoned trader” like placing an order while the flight attendant gathers everyone’s attention for the safety demo.
🧴 SPF 50 and the S&P 500: Know Your Risk Exposure
In these scorchers outside, you wouldn’t step out without sunscreen, right? But would you let your positions roast unsupervised?
Use stop losses like you use sunblock: generously and repeatedly. Even better — scale back. Summer’s thin liquidity (and other summer trading traps ) can turn minor market moves into full-on tidal waves. No one wants to explain to their friends why they lost 40% of their portfolio during a snorkeling trip.
Adequate position sizing is your beach umbrella. It doesn’t stop the storm, but it’ll stop the burn.
🧭 Wi-Fi, but Make It Secure
Public Wi-Fi is great for scrolling memes, not executing trades. One accidental login from a beachside café in Mykonos and boom — your brokerage account may become a group project.
Trading from your vacation spot shouldn’t be a flex (no matter how much you want to look cool to the bunch of people around you). Focus on your game, trade in silence, and bask in sunlight and success.
☀️ Pack Light, Trade Lighter
The golden rule? If you’re not at your desk, don’t trade like you are.
Scale back positions, minimize leverage, and don’t try to outperform the market while someone’s kid is throwing a beach ball at your head. This is a maintenance phase, not a moonshot month.
Think: protect capital, avoid drawdowns, maybe sneak in a swing trade between sunscreen applications.
📲 Must-Have Apps for Sand-and-Screen Trading
You’re not bringing a full setup, but your phone can still do the heavy lifting. Load it with TradingView (obviously), your broker, ideally paired with TradingView, and a solid news feed . Bonus points for noise-canceling headphones that can drown out both market panic and crying toddlers.
Set up push notifications smartly — only the alerts you actually need. You don’t want your wrist buzzing every time Nvidia NASDAQ:NVDA moves 0.1%.
Question for the road : What’s your best summer trade… and was it worth checking your phone at dinner to place it?
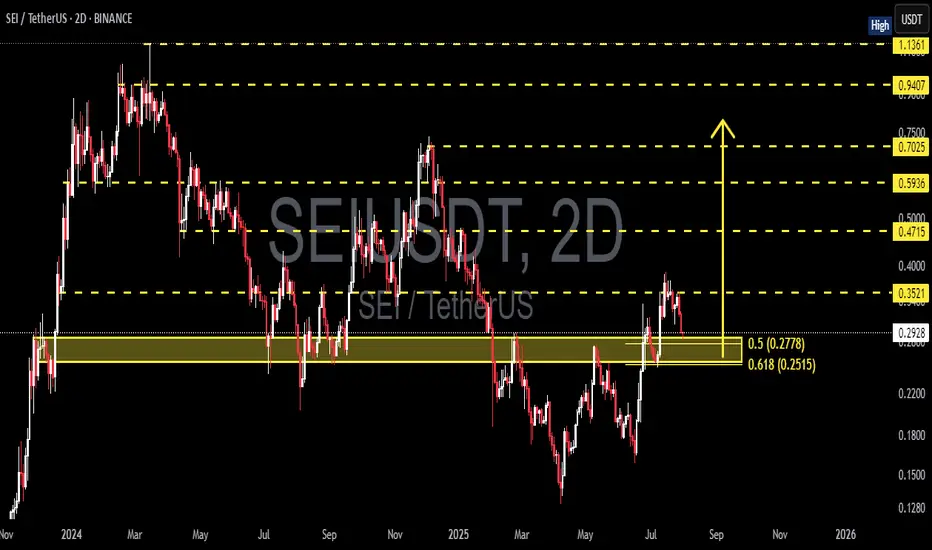
SEI/USDT at a Critical Level Golden Pocket Reaction Will Define?🔍 Technical Analysis:
1. Market Structure:
SEI/USDT is in a recovery phase after a significant downtrend.
Price is currently testing a crucial area between the Fibonacci retracement levels of 0.5 (0.2778) and 0.618 (0.2515) — known as the Golden Pocket Zone.
2. Key Support & Resistance Levels:
Strong support lies within the highlighted yellow zone (0.2515 – 0.2778), a historical support-resistance flip level.
Key resistance levels to watch:
🔸 0.3521
🔸 0.4715
🔸 0.5936
🔸 0.7025
🔸 0.9407
🔸 1.1361
---
📈 Bullish Scenario:
If price holds above the golden pocket:
A strong rebound is likely, forming a higher low structure.
Bullish confirmation occurs if price breaks and closes above 0.3521 with strong volume.
Upside targets: 0.4715 → 0.5936 → 0.7025 in sequence.
🔹 Additional Confirmation: Bullish reversal patterns (e.g., bullish engulfing or pinbar) around 0.25–0.28 would strengthen the bullish outlook.
---
📉 Bearish Scenario:
If the price breaks below the 0.2515 level:
It could trigger a deeper move toward 0.22 – 0.18 support area.
Further breakdown may bring price below the psychological level of 0.15.
🔻 Bearish confirmation if the price gets rejected from the 0.30–0.35 region with strong bearish candles.
---
📊 Pattern Insight:
Potential Double Bottom formation near the golden pocket zone.
A break above the 0.3521 neckline would validate this bullish reversal pattern.
---
🔖 Conclusion:
This zone (0.25–0.28) is a make-or-break area for SEI. A strong reaction from this golden pocket will determine whether SEI is ready to rally further or fall to new lows.
#SEI #SEIUSDT #CryptoAnalysis #AltcoinUpdate #TechnicalAnalysis #Fibonacci #SupportResistance #GoldenPocket #CryptoTrading #SEIpriceprediction
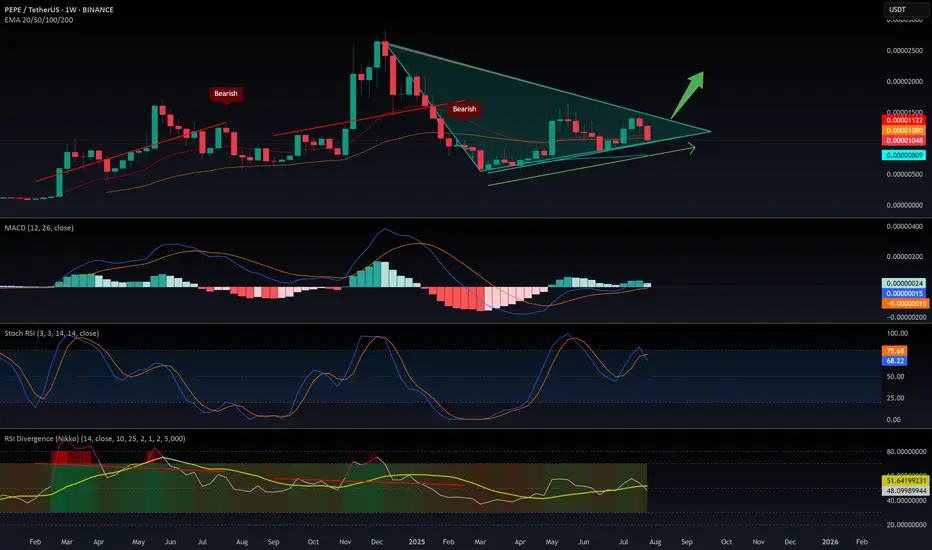
$PEPE: the big picture, 1W analysis.August 1st, 2025 – A tough day for altcoins, hit once again by tariff concerns.
But let’s talk about CRYPTOCAP:PEPE , one of my favorite altcoins to track. Why? No VC backing, the entire supply is community-held, and volume is consistently strong—making it a reliable market sentiment indicator.
Weekly Outlook:
CRYPTOCAP:PEPE remains in a macro uptrend, riding above the 100 EMA.
- My Momentum indicator has triggered two buy signals: at 0.00000634 and 0.00001040
- RSI is rising but still mid-range—there’s plenty of room to move higher.
- MACD is gradually ramping up.
- Stochastic RSI is cooling off, but given the strength of the other signals, further downside looks limited.
Technically, we’re seeing a bullish flag pattern. Price is currently testing support at the lower range—likely setting the stage for a decisive move in the coming weeks.
Conclusion:
Based on the current indicators and structure, the odds favor a bullish breakout and continuation of the uptrend—though, as always, DYOR.
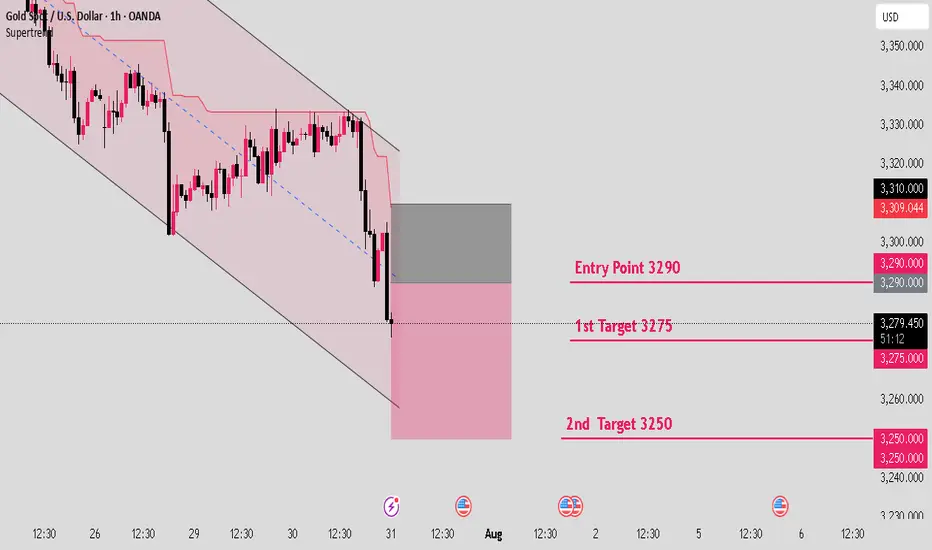
Gold will drop like rain till 3250.Hello IGT FOLLOWER'S
Here is my gold overview, According to me Gold is currently facing resistance around the 3290–3310 zone. This setup anticipates a rejection from this area, with bearish momentum expected to push price downward. A break above 3310 would invalidate the setup, so risk management is key.
Key points:
Entry point: 3290
1st target : 3275
2nd target: 3250
Follow me for more latest updates and signals
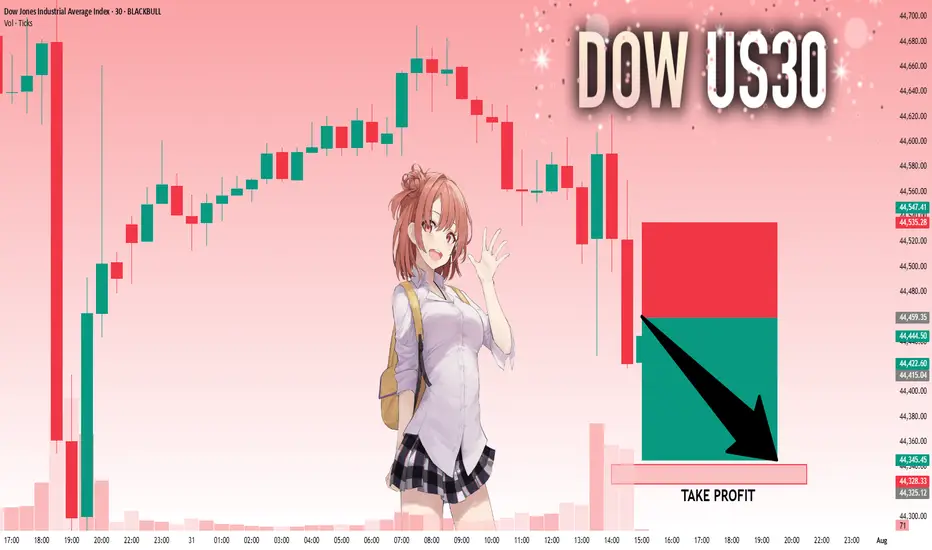
US30: Absolute Price Collapse Ahead! Short!
My dear friends,
Today we will analyse US30 together☺️
The in-trend continuation seems likely as the current long-term trend appears to be strong, and price is holding below a key level of 44,459.35 So a bearish continuation seems plausible, targeting the next low. We should enter on confirmation, and place a stop-loss beyond the recent swing level.
❤️Sending you lots of Love and Hugs❤️
NAS100 Trade Idea: Liquidity Sweep & Bullish Reversal Potential📊 NASDAQ 100 (NAS100) Trade Outlook 📈
The NASDAQ 100 is holding a strong bullish trend on the higher timeframes 🟢. However, we’re currently seeing a notable pullback into a key support zone ⚠️ — price has dipped beneath previous lows, tapping into what appears to be an institutional accumulation range 🏦.
This move is likely targeting the liquidity resting below those lows 💧, where sell stops are positioned. Price is also reacting off a significant bullish order block 🧱 — a confluence area that could produce a strong reversal.
🎯 What to look for next:
Wait for a bullish break in market structure 🔁 to confirm a potential entry. If that occurs, consider a long setup with your stop loss below the swing low 🛑 and a 1:2 risk-to-reward target 🎯.
🚫 This is for educational purposes only and not financial advice.

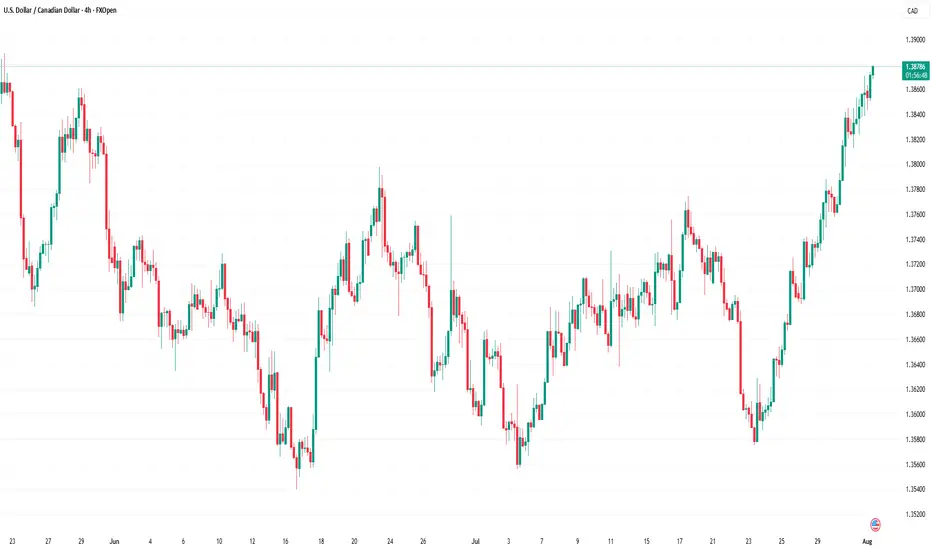
USD/CAD Rises to 2-Month HighUSD/CAD Rises to 2-Month High
Today, the USD/CAD exchange rate briefly exceeded the 1.3870 mark – the highest level seen this summer. In less than ten days, the US dollar has strengthened by over 2% against the Canadian dollar.
Why Is USD/CAD Rising?
Given that both the Federal Reserve and the Bank of Canada left interest rates unchanged on Wednesday (as expected), the primary driver behind the pair’s recent rally appears to be US President Donald Trump's decision to impose tariffs on several countries – including Canada:
→ Despite efforts by Prime Minister of Canada Mark Carney to reach an agreement with Trump, no deal was achieved;
→ Canadian goods exported to the US will now be subject to a 35% tariff;
→ The tariffs take effect from 1 August;
→ Goods compliant with the United States-Mexico-Canada Agreement (USMCA) are exempt.
Media analysts note that the tariffs are likely to increase pressure on the Canadian economy, as approximately 75% of the country's exports are destined for the United States.
USD/CAD Technical Analysis
At the end of July, the price formed a steep ascending channel (A-B), with bullish momentum confirmed by a decisive breakout above the 1.3790 resistance level, as illustrated by the arrow:
→ the pullback before the breakout was relatively shallow;
→ the bullish breakout was marked by a long bullish candlestick with a close near the session high;
→ following the breakout, the price confidently consolidated above 1.3790.
Provided that the fundamental backdrop does not undergo a major shift, bulls might attempt to maintain control in the market. However, the likelihood of a correction is also increasing, as the RSI indicator has entered extreme overbought territory.
Should USD/CAD show signs of a correction after its steep ascent, support might be found at:
→ line C, drawn parallel to the A-B channel at a distance of its width;
→ the previously mentioned 1.3790 level, which now acts as a support following the breakout.
This article represents the opinion of the Companies operating under the FXOpen brand only. It is not to be construed as an offer, solicitation, or recommendation with respect to products and services provided by the Companies operating under the FXOpen brand, nor is it to be considered financial advice.
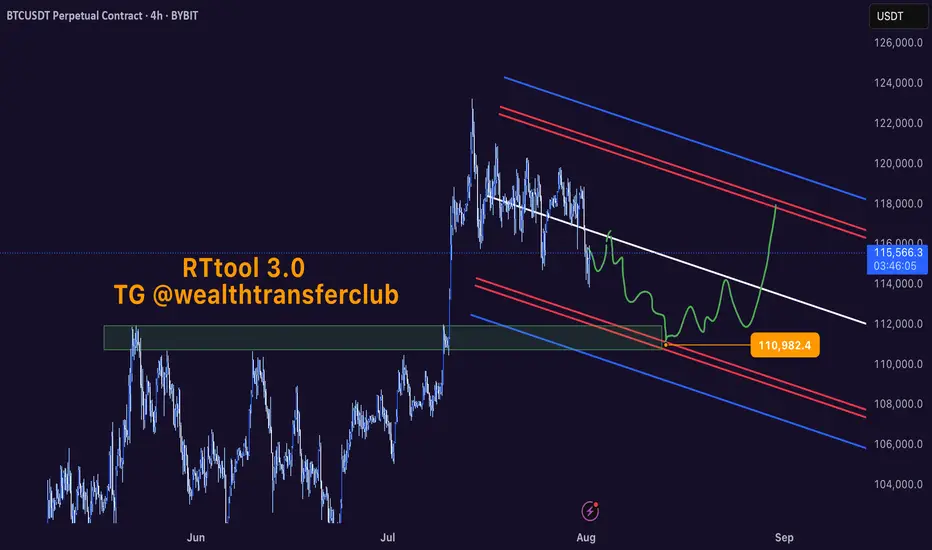
Potential Roadmap for BTC/USD In the next 30-40 daysVolatility incoming. It seems like BTC/USD is heading down to sweep some liquidity range at around 107-110,000.
However, market will recover after that, we are still in the "buy the dip" scenario.
End of August, I can personally still bet that BTC will sit higher than the current level

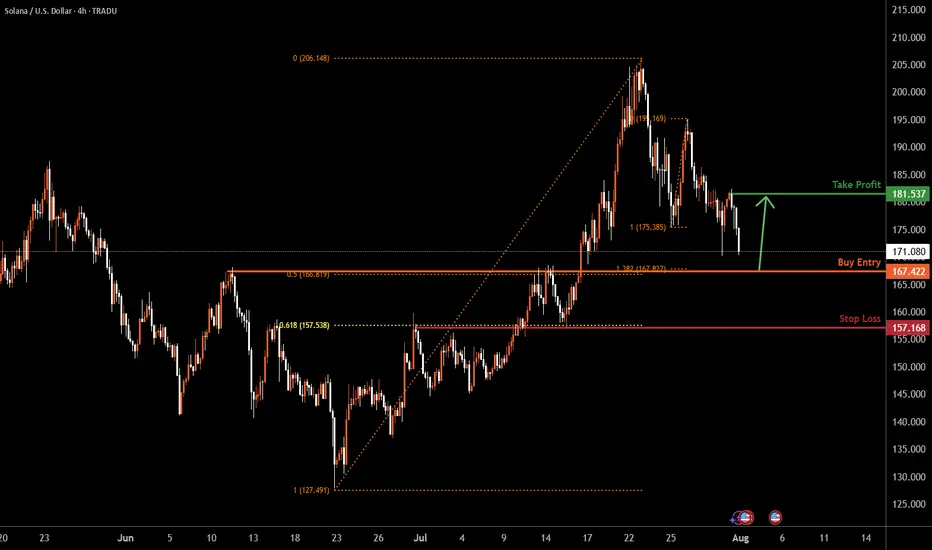
SOLUSD H4 | Bullish bounceBased on the H4 chart analysis, the price could fall to the buy entry, which acts as a pullback support that aligns with the 50% Fibonacci retracement and the 138.2% Fibonacci extension and could bounce to the upside.
Buy entry is at 167.42, which is a pullback support that aligns with the 50% Fibonacci retracement and the 138.2% Fibonacci extension.
Stop loss is at 157.16, which is an overlap support that aligns with the 61.8% Fibonacci retracement.
Take profit is at 181.53, which is a pullback resistance.
High Risk Investment Warning
Trading Forex/CFDs on margin carries a high level of risk and may not be suitable for all investors. Leverage can work against you.
Stratos Markets Limited (tradu.com ):
CFDs are complex instruments and come with a high risk of losing money rapidly due to leverage. 65% of retail investor accounts lose money when trading CFDs with this provider. You should consider whether you understand how CFDs work and whether you can afford to take the high risk of losing your money.
Stratos Europe Ltd (tradu.com ):
CFDs are complex instruments and come with a high risk of losing money rapidly due to leverage. 66% of retail investor accounts lose money when trading CFDs with this provider. You should consider whether you understand how CFDs work and whether you can afford to take the high risk of losing your money.
Stratos Global LLC (tradu.com ):
Losses can exceed deposits.
Please be advised that the information presented on TradingView is provided to Tradu (‘Company’, ‘we’) by a third-party provider (‘TFA Global Pte Ltd’). Please be reminded that you are solely responsible for the trading decisions on your account. There is a very high degree of risk involved in trading. Any information and/or content is intended entirely for research, educational and informational purposes only and does not constitute investment or consultation advice or investment strategy. The information is not tailored to the investment needs of any specific person and therefore does not involve a consideration of any of the investment objectives, financial situation or needs of any viewer that may receive it. Kindly also note that past performance is not a reliable indicator of future results. Actual results may differ materially from those anticipated in forward-looking or past performance statements. We assume no liability as to the accuracy or completeness of any of the information and/or content provided herein and the Company cannot be held responsible for any omission, mistake nor for any loss or damage including without limitation to any loss of profit which may arise from reliance on any information supplied by TFA Global Pte Ltd.
The speaker(s) is neither an employee, agent nor representative of Tradu and is therefore acting independently. The opinions given are their own, constitute general market commentary, and do not constitute the opinion or advice of Tradu or any form of personal or investment advice. Tradu neither endorses nor guarantees offerings of third-party speakers, nor is Tradu responsible for the content, veracity or opinions of third-party speakers, presenters or participants.
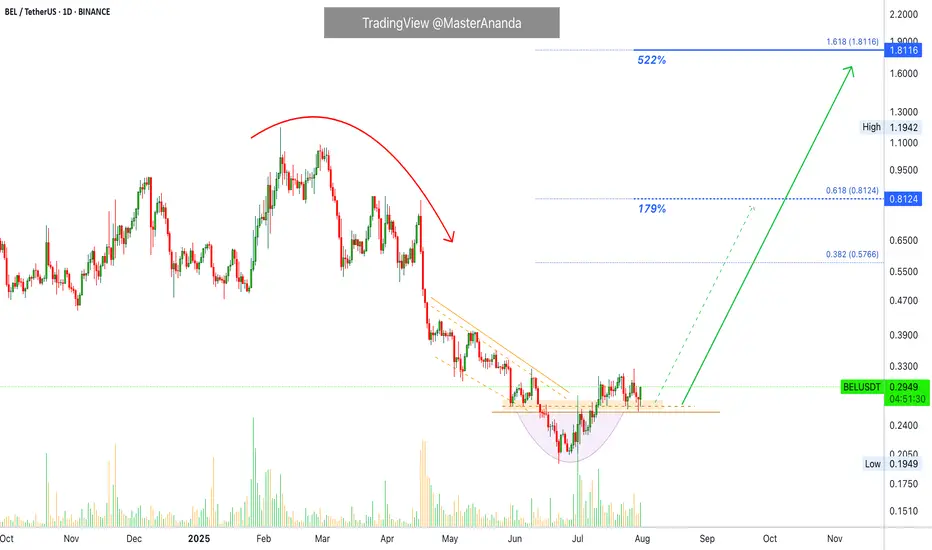
Bella Protocol 522% Easy Profits PotentialWe are going to be looking at many charts together every single day. We will go through all the altcoins basically. I am starting with some of those from the last period that didn't move. The charts look good but they filed to break their May high. These pairs are now ready to move before the rest of the market.
Here we have BELUSDT. A nice rounded bottom to end the downtrend. A small bullish recovery supported by high volume.
We have a perfect set of reversal signals and today a full green candle. This candle confirms those signals and opens up the chance of a strong advance. If the action starts now, you can be looking at the start of a major 2-3 months long move.
There will be some stops along the way but the action should be bullish nonetheless, higher highs and higher lows.
Strategy
In this setup we simply buy spot, no stop-loss. After buying we wait for as long as it is needed for prices to rise. Normally within 2-3 weeks, can be just a few days, but sometimes the wait can extend to 1-2 months. It varies. We are always prepared and ready to wait six full months, so if anything happens before this time horizon, even better but be ready to wait.
Even if you were to sell your current pair to buy a new one, the new one also requires waiting. We tend to sell wanting to find something that is moving but the moment we sell, we are faced with the same problem; even if the pair you chose is moving you have to wait for the bullish wave to develop. Even if prices rise 5% daily it would still take 20 days for a 100% price increase. 40 days for 200%. Etc. Patience is key.
So, simply, buy and hold. The market will take care of the rest.
Namaste.
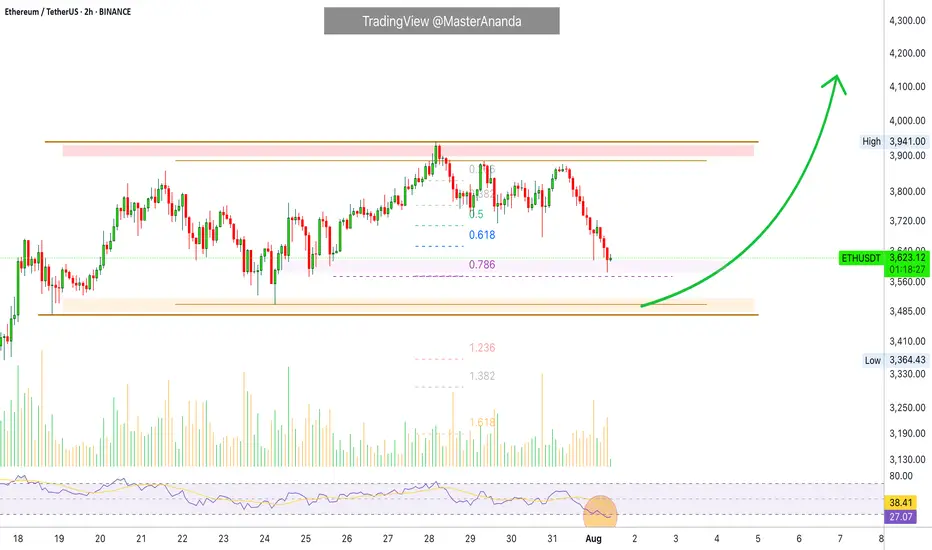
Ethereum Short-Term · Trading within Bullish RangeI am looking at Ethereum short-term using the same timeframe I used for Bitcoin, 2h. We have some interesting signals.
Here ETHUSDT is trading within higher lows. This is interesting because Bitcoin produced a lower low recently. The same volume signal is present here, ETHUSDT has been producing lower bearish volume since last month.
The RSI produced a lower low while ETHUSDT produced a higher low. This is called a hidden bullish divergence. Ethereum's bears did not only fail to take out the last low 24-July but also the previous one, and this clearly reveals bullish support.
The RSI being oversold is also a positive condition and can signal a reversal happening soon. Not truly a reversal because we are not in a downtrend, we are still witnessing a small pause after a strong rise; consolidation near resistance. A continuation reads better.
Ethereum's price continues really strong and the short-term signals are pointing to bullish action being favored in the coming days. We can wait easily and patiently because the best is yet to come. Never SHORT in a bull market, the market will surprise you with how fast things can turn. Better wait for support and go LONG.
Namaste.
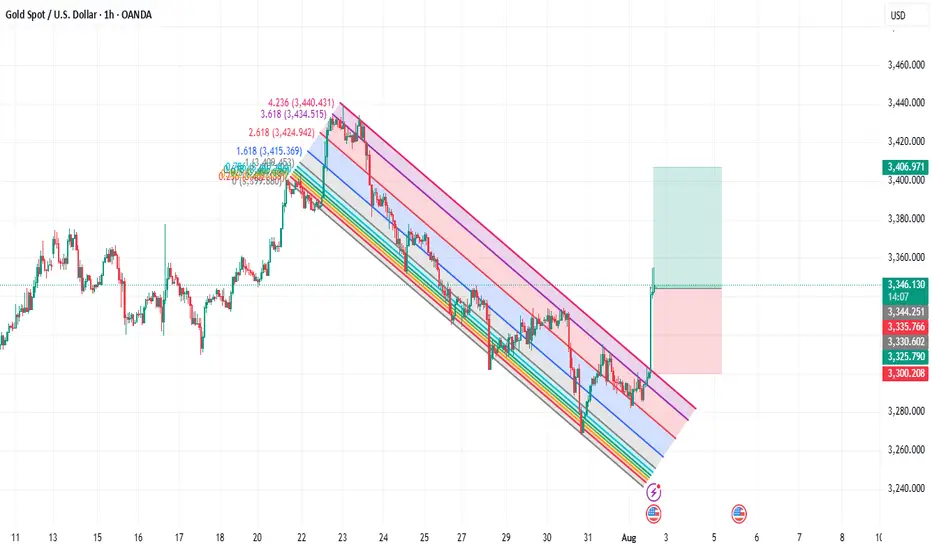
Gold you now totaly buy trend for next 3 to 5 days Gold you now totaly buy trend for next 3 to 5 days
If you want learn more fell free contrect me .
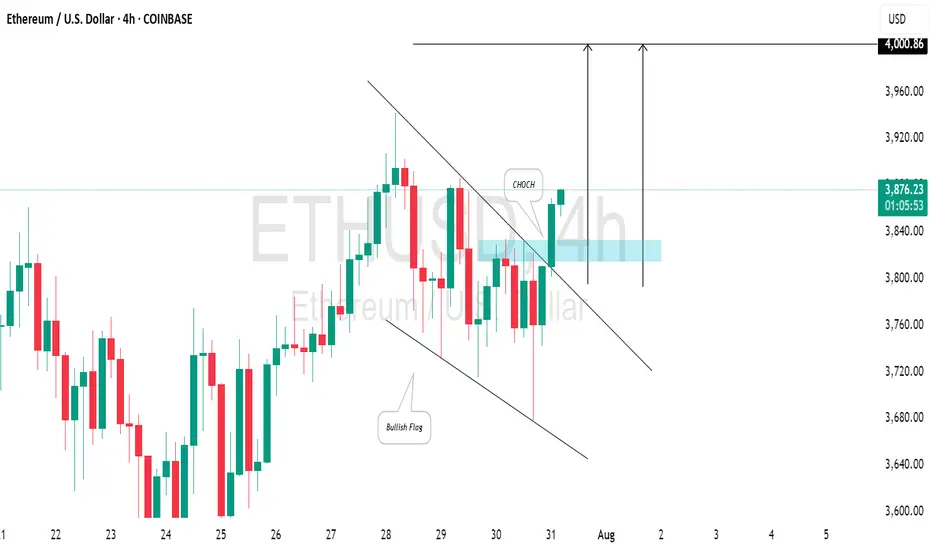
ETHEREUM (ETHUSD): Strong Bullish SignalsI spotted 2 important price action confirmations on 📈ETHEREUM:
The price has surpassed a resistance line of a bullish flag and established a confirmed change of character (CHoCH) on the 4-hour chart.
I believe the market will maintain a bullish trend, with the next resistance at the 4000 level.
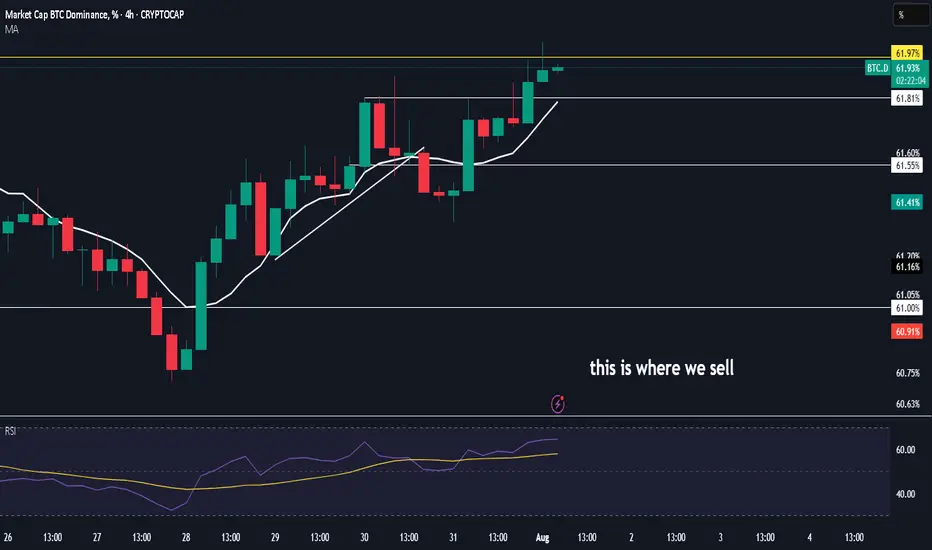
$btc.dok then are we deviating above one last time or ready to send it to hades ?
20 odd mins for 12h close lets see if to risk on more or chill
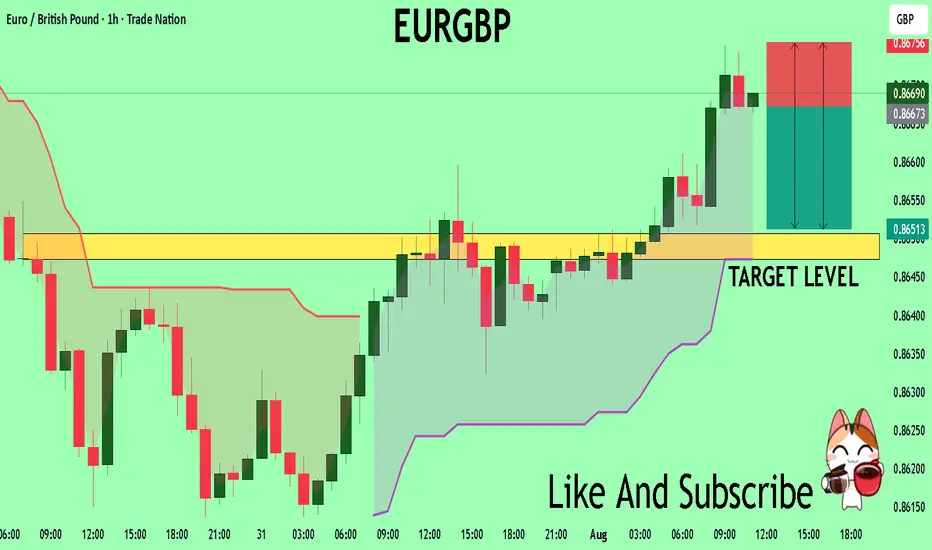
EURGBP Will Collapse! SELL!
My dear subscribers,
EURGBP looks like it will make a good move, and here are the details:
The market is trading on 0.8667 pivot level.
Bias - Bearish
My Stop Loss - 0.8675
Technical Indicators: Both Super Trend & Pivot HL indicate a highly probable Bearish continuation.
Target - 0.8650
About Used Indicators:
The average true range (ATR) plays an important role in 'Supertrend' as the indicator uses ATR to calculate its value. The ATR indicator signals the degree of price volatility.
Disclosure: I am part of Trade Nation's Influencer program and receive a monthly fee for using their TradingView charts in my analysis.
———————————
WISH YOU ALL LUCK
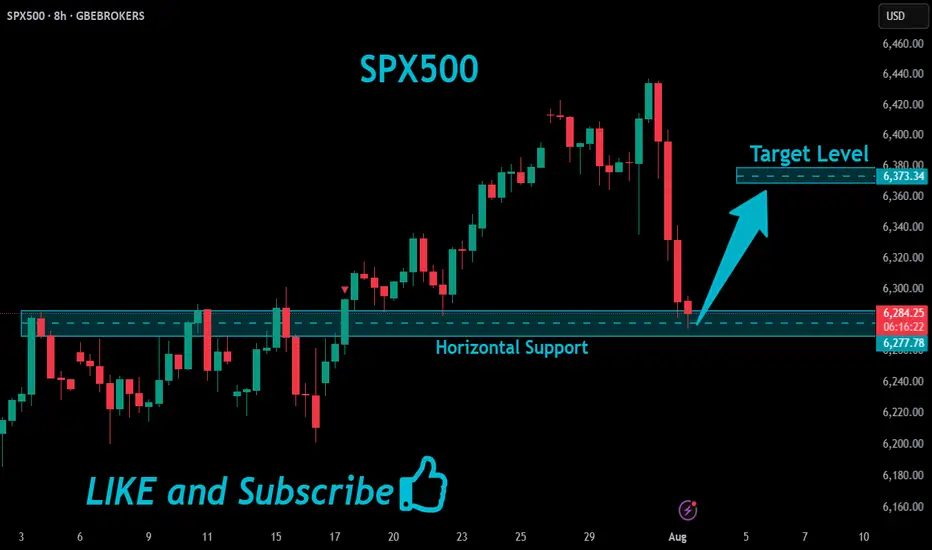
SPX500 Will Go UP!
HI,Traders !
#SPX500 made a retest
Of the horizontal support
Level of 6277.78 and we
Are already seeing a
Bullish rebound so we are
Locally bullish biased and
We will be expecting a
Further bullish move up !
Comment and subscribe to help us grow !
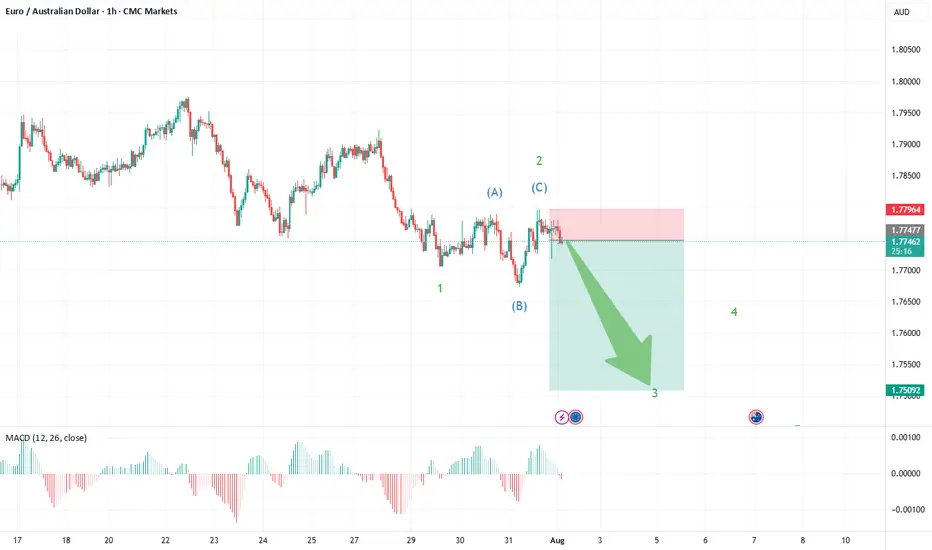
EUR/AUD: Short Setup Forming—Is the Downside Just Beginning?EUR/AUD is flashing the early signs of a new short trading opportunity, with the latest chart pointing toward a fresh move lower as the corrective phase may be wrapping up.
What the Current Structure Shows (Primary Scenario)
Corrective Pattern Complete: The strong advance off the May 14th, 2025 lows at 1.7247 unfolded as a classic double zigzag (WXY), culminating at recent highs. Price action has since reversed and formed an initial impulse down—clear evidence that the correction may be over.
Wave 1 Down, Expanded Flat for Wave 2: The chart now displays a completed wave 1 on the downside, followed by an expanded flat for wave 2—where price retraced upward but failed to break the previous peak, a sign of fading bullish momentum.
The recent structure shows a sharp, impulsive move down (wave 1), fitting Elliott Wave expectations for a new trend immediately after a complex correction.
The expanded flat for wave 2—where the B wave exceeded the start of A and C pushed higher—typically heralds a strong, extended wave 3. This supports a bearish outlook from current levels.
BTC - BIG OPPORTUNITY COMING SOON AGAIN!IF BTC does not hold the current low, 95% probability we will go for the green box. biggest support is around $110.000 guys. Once/should backtested we could see massive opportunity again on altcoins!
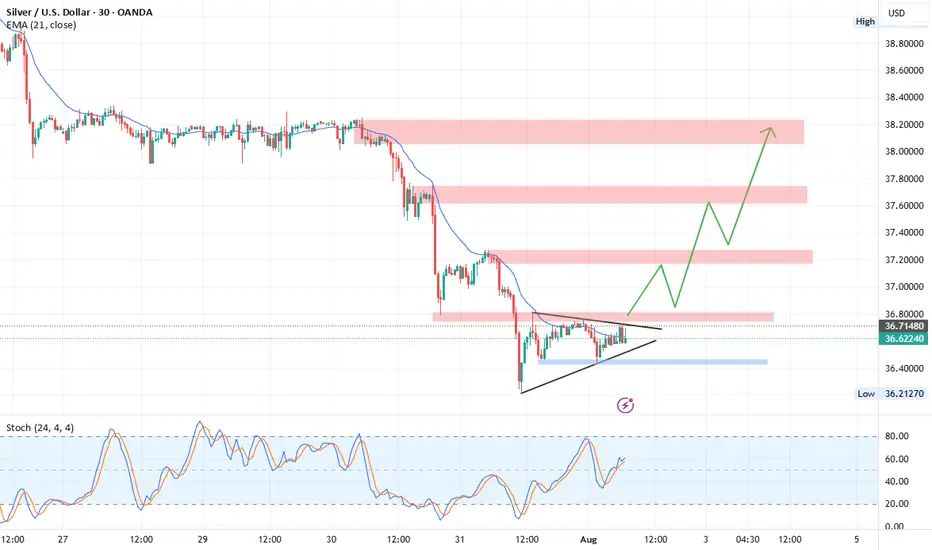
XAGUSD Technical Outlook (Silver/USD)Currently, Silver is trading inside a symmetrical triangle formation , signaling a potential breakout.
Upside Scenario:
A breakout above 36.80 resistance may trigger strong bullish momentum. The next target zone lies at 37.18 – 37.30, which is a relatively weak resistance and could potentially form a Head and Shoulders pattern . If momentum continues, Silver could extend gains toward 37.75 and 38.00 resistance levels.
Downside Scenario:
If the triangle breaks to the downside, we may see a short corrective move toward 3 6.25 – 36.20 support zone before any possible rebound.
Overall, the chart structure currently favors an upside breakout with continuation toward higher resistance zones.
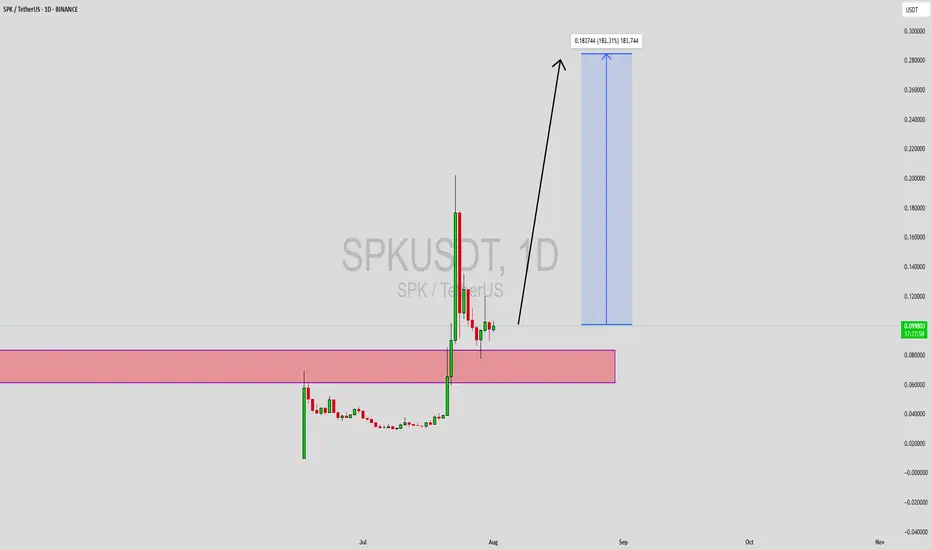
SPKUSDT Forming Bullish ReversalSPKUSDT is currently showing signs of a strong bullish reversal pattern, positioning itself as one of the most technically attractive altcoins on the radar. After an extended downtrend, the price has found solid support at a key demand zone, which has historically acted as a base for significant rallies. The latest price action has formed a clear reversal structure, signaling a potential shift in momentum from sellers to buyers. This early signal of trend reversal is supported by increasing volume, indicating strong accumulation at lower levels.
This setup is gaining traction among traders and crypto investors who are beginning to take interest in SPK due to its attractive risk-to-reward ratio and potential for explosive gains. The expected move targets a 140% to 150% upside, which aligns with previous recovery waves observed in similar patterns. Technical indicators such as the RSI and MACD may also begin to align in favor of bulls, further supporting the thesis for a major trend reversal. This gives traders the confidence to anticipate a breakout rally in the coming weeks.
The fundamentals behind SPKUSDT are also gaining visibility, as the project's roadmap and utility continue to attract community attention. In the current market cycle, low-cap and mid-cap assets that show early reversal signs often outperform during recovery phases. With growing investor interest and a chart that supports a major move, SPKUSDT is a pair that deserves close monitoring. The breakout confirmation above recent resistance levels could act as a strong signal for the next upward leg.
This is a prime opportunity for swing and mid-term traders to take advantage of a potentially explosive move. With volume building and sentiment improving, SPKUSDT could be setting up for a rally that outpaces many other altcoins in the same category.
✅ Show your support by hitting the like button and
✅ Leaving a comment below! (What is You opinion about this Coin)
Your feedback and engagement keep me inspired to share more insightful market analysis with you!
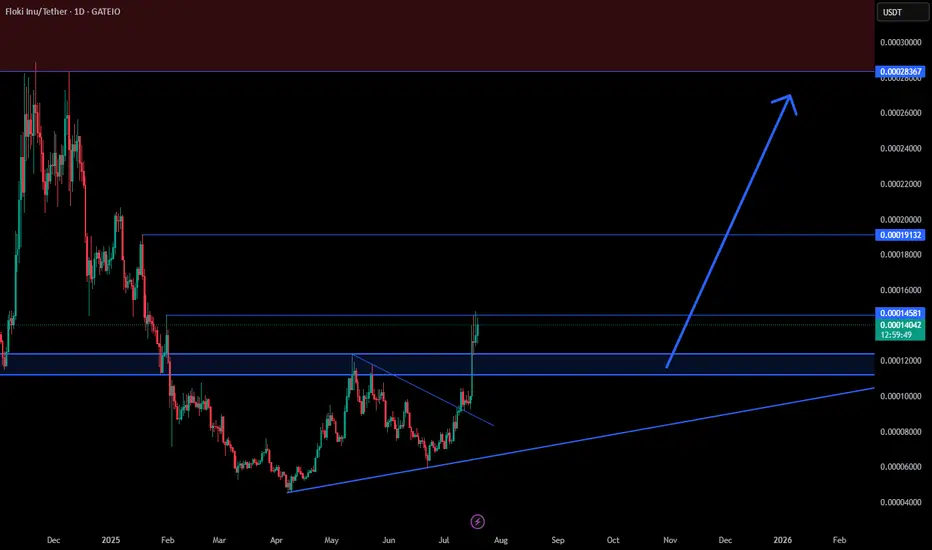
FLOKI Ready for a Big Move !📊 FLOKI/USDT Analysis
Floki just broke out of a falling wedge and flipped key resistance around 0.00012 into support. As long as price holds above this zone, I’m targeting the next major resistance levels at 0.00019 and 0.00028.
✅ Bullish market structure with strong momentum.
✅ Potential for a big move if current breakout holds.
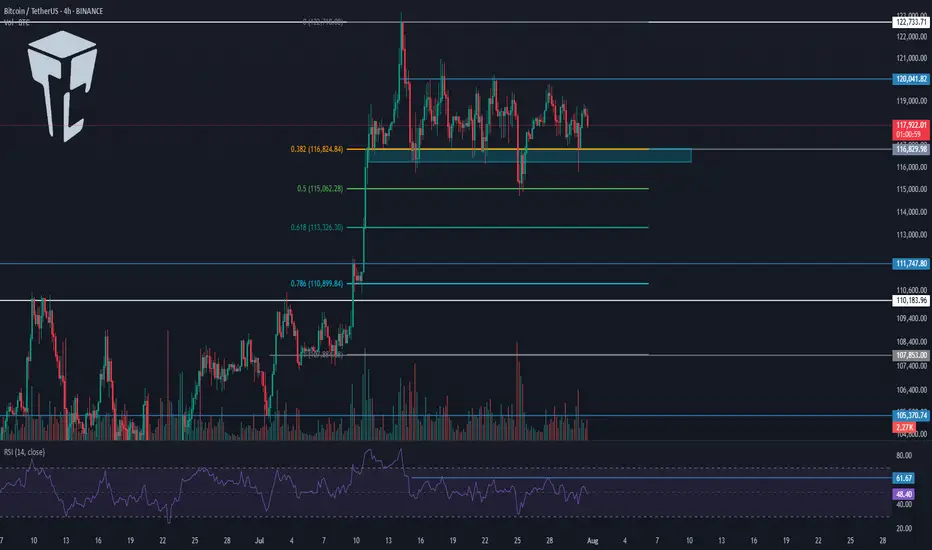
TradeCityPro | Bitcoin Daily Analysis #140👋 Welcome to TradeCity Pro!
Let’s dive into the Bitcoin analysis. Yesterday, the interest rate decision by the US Federal Reserve was announced, and once again, just like the past few months, it remained unchanged. Let’s see what impact it had on Bitcoin.
⏳ 4-Hour Timeframe
In the 4-hour timeframe, after the announcement of the unchanged interest rate and Powell’s speech, Bitcoin printed a red candle on the support zone and even wicked lower, but then recovered and the price returned back into the box.
✔️ Basically, we can say that this month’s rate decision had no real impact on the market, and Bitcoin is still moving inside its range box. The fact that the support zone wasn’t lost is a positive sign for the continuation of the trend.
⭐ But the important point is this: if the uptrend is going to continue, the price must print a higher high or at least a level equal to 120041, and in my opinion, if for any reason a lower high gets printed, the chances of breaking below 116829 significantly increase.
📊 I currently have no new position on Bitcoin, and all my entries are below 110000. But if 120041 breaks, I’ll open a long position for the next bullish wave that Bitcoin might start.
💥 A major trigger for starting a new leg is the 61.67 level on the RSI. As long as RSI remains below this level, there’s no bullish momentum in the market — and considering that the number of touches to 116829 has increased, the probability of a correction is also rising.
❌ Disclaimer ❌
Trading futures is highly risky and dangerous. If you're not an expert, these triggers may not be suitable for you. You should first learn risk and capital management. You can also use the educational content from this channel.
Finally, these triggers reflect my personal opinions on price action, and the market may move completely against this analysis. So, do your own research before opening any position.