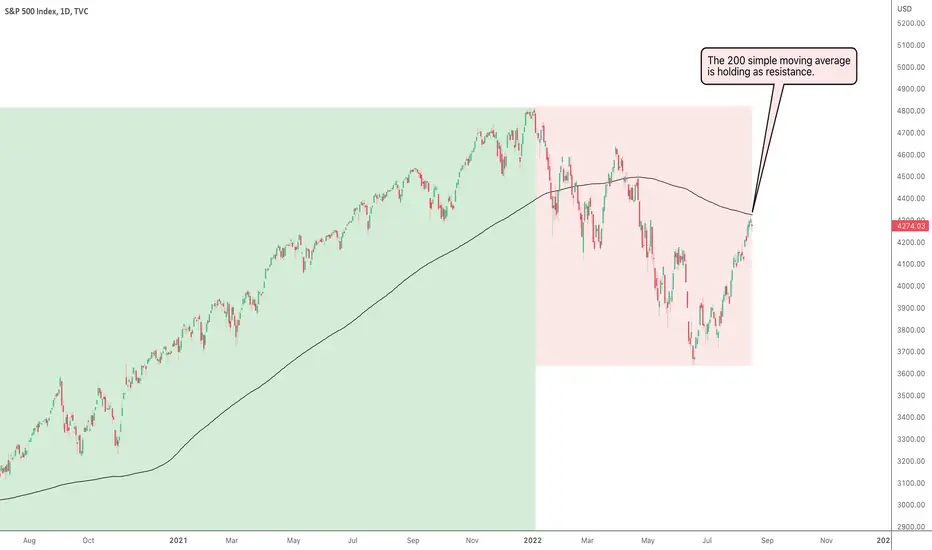
S&P 500 Signalling Buying Opportunities?As expected, the S&P 500 has reacted to the daily 200 simple moving average
which is acting as resistance.
Basic indicators such as the moving average can tell us before the fact where
price may struggle and potentially reverse.
This move is not a reversal at the moment, a barrier has been formed, and it
will just take the buyers a bit more effort to break above this level.
We have seen some bullish impulsive moves recently, and if the long-term trends
are still intact, then the 200 sma should be broken soon, and then we want to
see price go on to create new all-time highs. Patience for now, but we may soon
be looking for buying opportunities again.
If you like enjoyed this post, make sure to like, and follow for more quality content!
If you have any questions or comments, comment below. We reply to every comment!
See below for more information on our trading techniques.
As always, keep it simple, keep it Sublime.
Trendfollowing
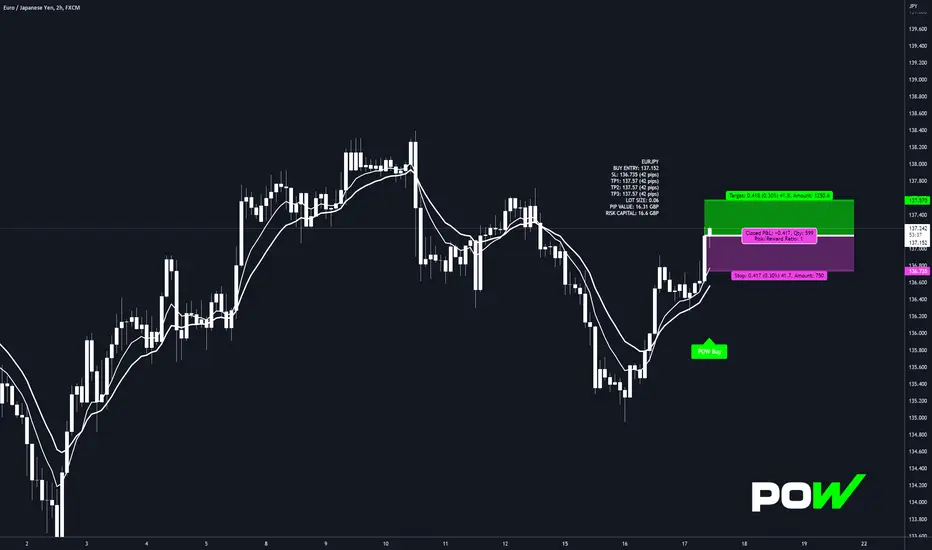
We have a EURJPY alert 📳Long trade alert for EURJPY has signalled.
Trend trade identified and entered.
Working H2 timeframe.
Trade details can be found on the chart in printed label.
All the TP values same in label as that's what I'm aiming for on this strategy.
Trade box is tracking the trade.
Want to know how I identified this trade you know what to do.
Yesterdays CADJPY share hit TP lets see if this Yen pair idea can also.
Thanks for looking
Darren🙌
Time for a long on CADJPY 💹I have a trade alert for CADJPY.
Trend trade identified and entered.
Working H1 timeframe.
Trade details can be found on the chart in printed label.
All the TP values same in label as that's what I'm aiming for on this strategy.
Trade box is tracking the trade.
Want to know how I identified this trade you know what to do.
Thanks for looking
Darren🙌

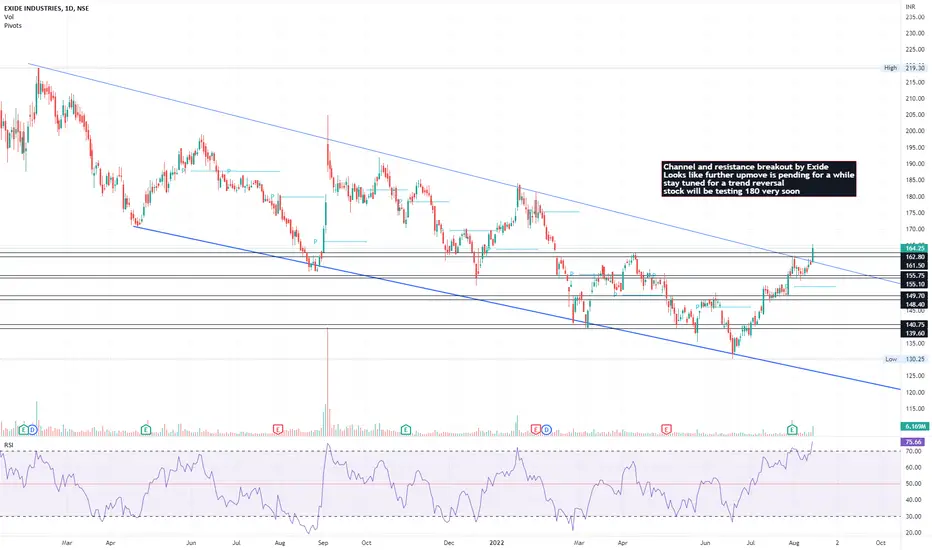
Exide has given multiple confirmations of a breakoutChannel and resistance breakout by Exide
Looks like further upmove is pending for a while
stay tuned for a trend reversal
stock will be testing 180 very soon
Fincables showing signs of a reversalInverted head and shoulder at support and now a breakout with volumes
A perfect spot of trend reversal, stay tuned!

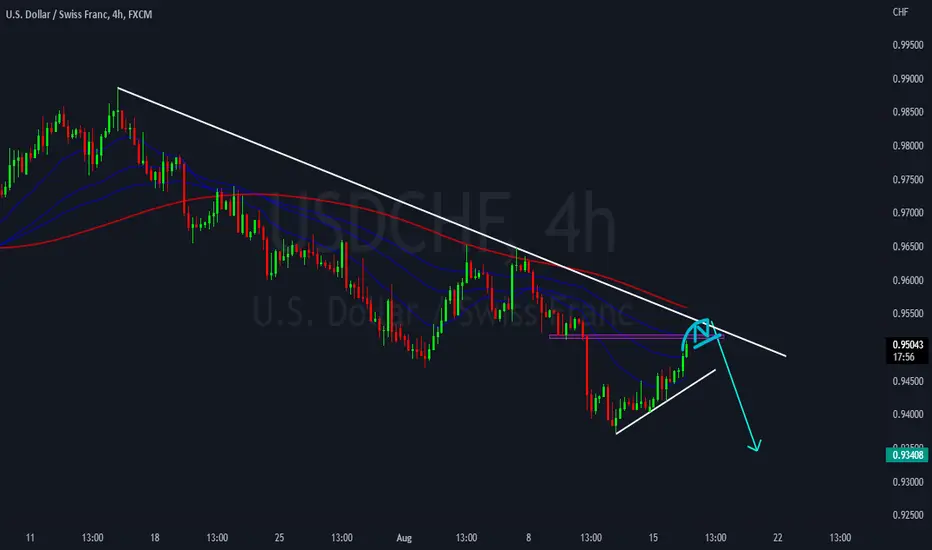
USDCHF H4I am looking to short from the top if price give us a price action on the top good luck....
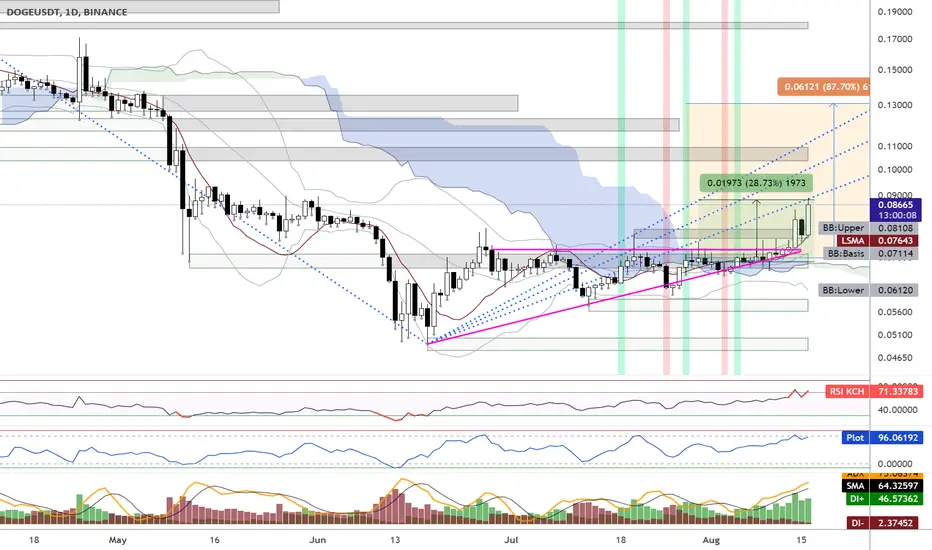
Update DOGE: Up 28.73% ! 86% potential gains 🚀🚀Since the first post. Doge pumped 28.73% already.
Time to move the stoploss higher, to lock in even more profits. I'm not seeing any bearish divergences yet. Still enough room to go.
Let's see how high it can go!
Remember to always take profits and use proper risk management!
Thank you for reading.
Namasté 🙏
Disclaimer: Ideas are for entertainment purposes only. Not financial advice. Your own due diligence is highly advised before entering trades. Past performance is no guarantee of future returns.
What Indicators Do I Like To Use:
I am using the "Supertrend Ninja - Clean", which is a trend-following indicator (Green and red vertical lines on the background). When the background of the candlestick closes green (vertical line). It indicates a possible bullish (up)trend. And red for possible downtrends.
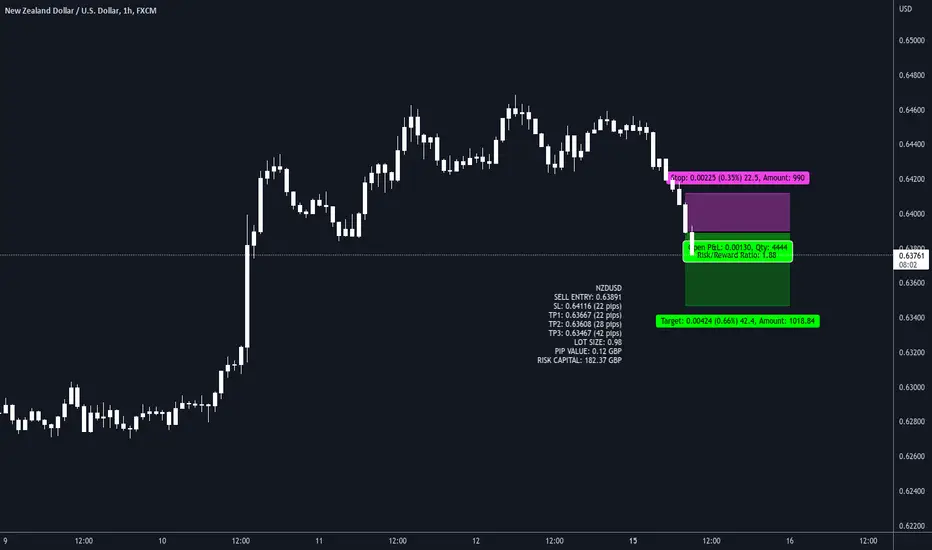
NZDUSD time for a short ⏰↘️We start the week with a NZDUSD short trade .
Trend trade identified and entered.
Working H1 timeframe.
Trade details can be found on the chart in printed label.
Trade box is tracking the trade.
Want to know how I identified this trade you know what to do.
Thanks for looking
Darren🙌
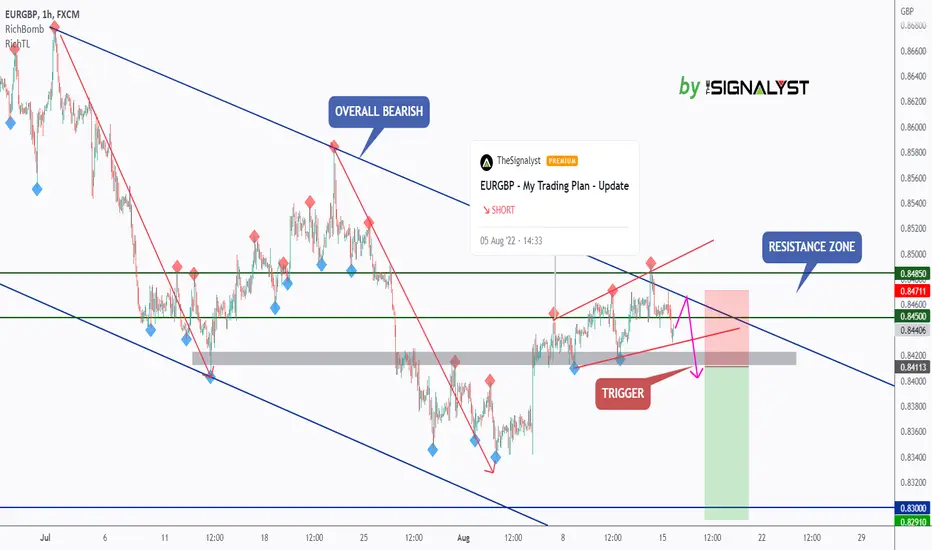
EURGBP - Wait For The Trigger!Hello TradingView Family / Fellow Traders. This is Richard, as known as theSignalyst.
As per my previous EURGBP idea, highlighted on the chart, we will be looking for sell setups as price approaches the green resistance zone.
on H1: EURGBP is forming a channel in red but the lower trendline is not valid yet.
So we will be waiting for a third swing to form around it to consider it our trigger swing.
Trigger => waiting for that third swing to form and then sell after a momentum candle close below the gray zone.
Meanwhile, until the sell is activated, EURGBP can still trade higher.
Which scenario do you think is more probable and why?
Always follow your trading plan regarding entry, risk management, and trade management.
Good luck!
All Strategies Are Good; If Managed Properly!
~Rich
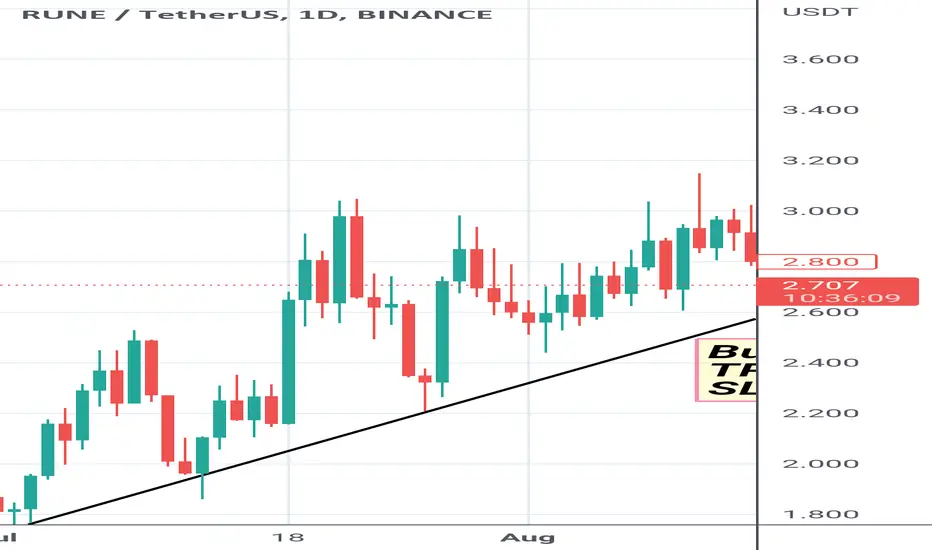
Buy Rune/USDTHello, Rune/Usdt is hovering Near Trend Line Support.You Can buy it And Make Profit. Also it is Fundamentally Good Coin 😇
CHZ +68% after BULL signal 🚀🚀 Retrace imminent of Leg B?CHZ pumped 68% (green price range) after the bull Supertrend Ninja - Clean signals (green vertical line on the background). A retrace is likely, see Elliot Wave Leg B. Which can retrace as far as 0.1250 (0.618). Finding support on the Ichimoku cloud. (If this is the top of Leg A.)
RSI isn't heavily oversold. Which means there is still room for more bullishness. I do see some bearish divergence forming on the RSI Brown. Which indicates a retrace is likely. If we take a look at the Average Directional Index ( ADX DI) its still in the bullish zone. Currently CHZ is above its Basis Bollinger Band, Band Basis 20 Period SMA . And above the LSMA as well.
A healthy retrace first, before another run up to form Leg C is a possible scenario.
Remember to always take profits and use proper risk management!
Thank you for reading.
Namasté 🙏
Disclaimer: Ideas are for entertainment purposes only. Not financial advice. Your own due diligence is highly advised before entering trades. Past performance is no guarantee of future returns.
What Indicators Do I Like To Use:
I am using the "Supertrend Ninja - Clean", which is a trend-following indicator (Green and red vertical lines on the background). When the background of the candlestick closes green (vertical line). It indicates a possible bullish (up)trend. And red for possible downtrends.

Update SHIB: Up 40% ! 143% potential gainsSince the previous post. SHIB pumped 40% already.
Time to move the stoploss above my entry point, to lock in some profits. The rest is free trading.
Remember to always take profits and use proper risk management!
Thank you for reading.
Namasté 🙏
Disclaimer: Ideas are for entertainment purposes only. Not financial advice. Your own due diligence is highly advised before entering trades. Past performance is no guarantee of future returns.
What Indicators Do I Like To Use:
I am using the "Supertrend Ninja - Clean", which is a trend-following indicator (Green and red vertical lines on the background). When the background of the candlestick closes green (vertical line). It indicates a possible bullish (up)trend. And red for possible downtrends.
ADA bullish signal. Potential gain of 114% !! 🚀🚀ADA Bullish case:
1. Bull Supertrend Ninja - Clean signals (green vertical line on the background).
2. Ascending Triangle (pink lines)
3. Breakout Ichimoku imminent
4. RSI Bullish zone, at the edge of breaking out of the ranging zone
5. ADX Bullish zone and DI+ upwards pointing
6. RSI Higher high, higher lows
7. Price Higher high, higher lows
8. Price above BB: Basis
9. Price above LSMA
Potential gain (orange price range) of 114% to 1.15 USD forming Leg A of the Elliot Wave. Let the GAINS begin !!
Supports and resistances are highlighted in grey blocks. Remember to always take profits and use proper risk management!
Thank you for reading.
Namasté 🙏
Disclaimer: Ideas are for entertainment purposes only. Not financial advice. Your own due diligence is highly advised before entering trades. Past performance is no guarantee of future returns.
What Indicators Do I Like To Use:
I am using the "Supertrend Ninja - Clean", which is a trend-following indicator (Green and red vertical lines on the background). When the background of the candlestick closes green (vertical line). It indicates a possible bullish (up)trend. And red for possible downtrends.

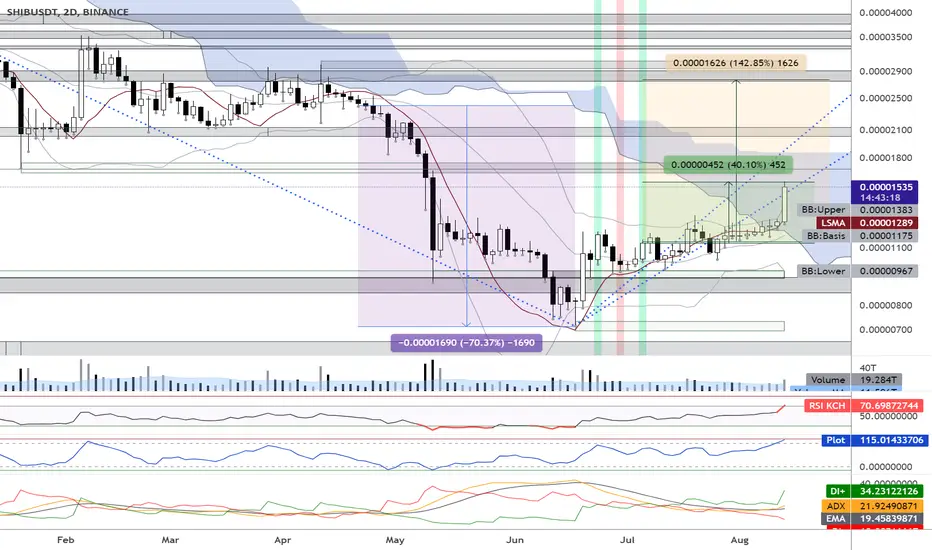
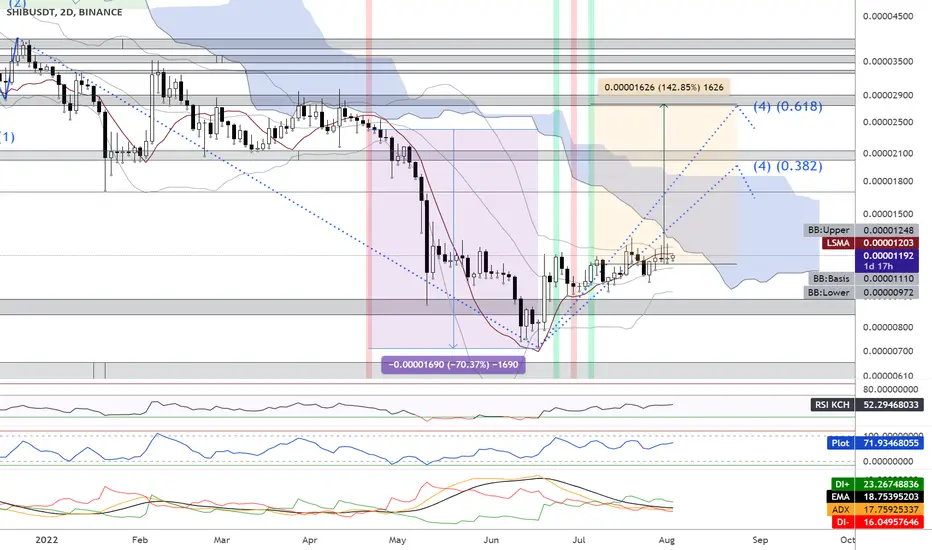
Shiba dropped 70% after signal - now potential rise of 143%?SHIB dumped 70% (purple price range) after the bear Supertrend Ninja - Clean signals (red vertical line on the background). Now there is a bull signal (green vertical line on the background) indicating a possible bull run to around to 2000 sats (0.382) or 2800 (0.618)) forming Wave 4. Which is about 143% (orange price range) possible gain.
SHIB is still below the the Ichimoku Cloud , which is considered bearish . Currently it is trying to break a resistance area at 1200. The RSI is still in a range/ slightly bullish at 52. RSI Brown at 72. If we take a look at the Average Directional Index ( ADX DI) its indecisive, as it is ranging. Almost horizontal. Currently SHIB is above its Basis Bollinger Band , Band Basis 20 Period SMA . While it is below the LSMA .
In short, SHIB is still stuck in a range on the 2Day chart. Although I am leaning towards a bullish scenario. Since SHIB price and the RSI are still forming a higher low. I do see an Ascending Triangle. Which is a bullish sign as well. Time will tell.
Remember to always take profits and use proper risk management!
Thank you for reading.
Namasté 🙏
Disclaimer: Ideas are for entertainment purposes only. Not financial advice. Your own due diligence is highly advised before entering trades. Past performance is no guarantee of future returns.
What Indicators Do I Like To Use:
I am using the "Supertrend Ninja - Clean", which is a trend-following indicator (Green and red vertical lines on the background). When the background of the candlestick closes green (vertical line). It indicates a possible bullish (up)trend. And red for possible downtrends.
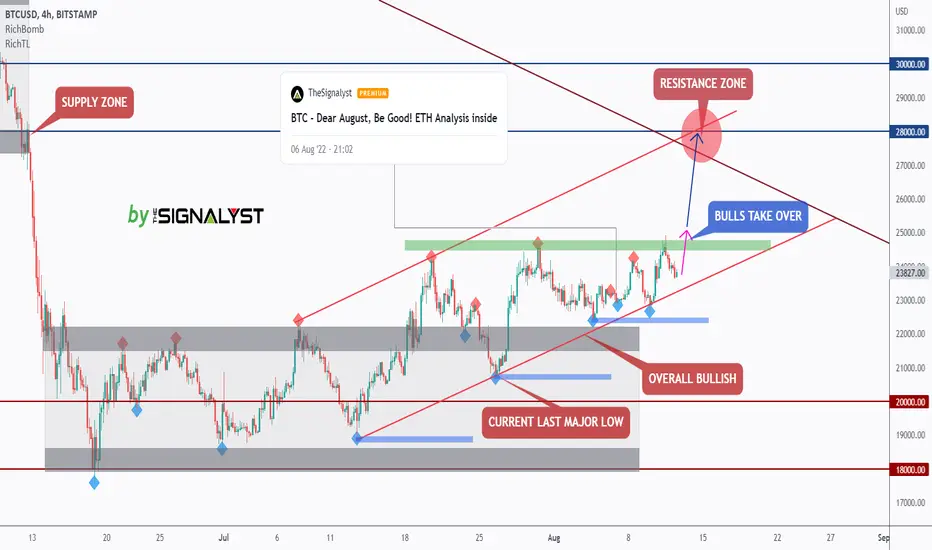
📌 BTC - Dear August, Be Good! Update Hello TradingView Family / Fellow Traders. This is Richard, as known as theSignalyst.
As per my last picture idea, highlighted in the chart, the bulls took over by breaking above the orange zone.
Now What?
For the bulls to take over from a medium-term perspective, we need a break above the last major high from H4 highlighted in green.
In this case, a movement till the 28k-30k resistance / supply zone would be expected.
Meanwhile are bullish, unless the bears manage to break below the last major low highlighted in blue.
Which scenario do you think is more likely to happen? and Why?
Always follow your trading plan regarding entry, risk management, and trade management.
Good luck!
All Strategies Are Good; If Managed Properly!
~Rich
TWTR UP 14% after bullish signal - Ready for more 🚀TWTR dumped 13.62% (purple price range) after the bearish Supertrend Ninja signal (red vertical line on the background). Then the price pumped 14.61% (green price range) after the bull Supertrend Ninja - Clean signals (green vertical line on the background). TWTR is forming Leg C with a possible bull run to around to 70 USD (1.618) or 55 USD (1.0). Which is about 82% (orange price range) possible gain.
TWTR is about to break out of the Ichimoku Cloud , which is considered bullish . The RSI is starting to warm up for a bullrun at 71. RSI Brown at 103. If we take a look at the Average Directional Index ( ADX DI) its in the bullish zone, and pointing upwards. Currently TWTR is above its Upper Bollinger Band , Band Basis 20 Period SMA . And above the LSMA as well. A bullish trend is likely to happen.
Price and the RSI are still forming a higher low. Which is a bullish sign as well. Let the GAINS begin !!
Remember to always take profits and use proper risk management!
Thank you for reading.
Namasté 🙏
Disclaimer: Ideas are for entertainment purposes only. Not financial advice. Your own due diligence is highly advised before entering trades. Past performance is no guarantee of future returns.
What Indicators Do I Like To Use:
I am using the "Supertrend Ninja - Clean", which is a trend-following indicator (Green and red vertical lines on the background). When the background of the candlestick closes green (vertical line). It indicates a possible bullish (up)trend. And red for possible downtrends.

Berli Jucker Cellox LTD (BJC, SET) still in wave CBJC is still in a downtrend, look and head to old resistance.
SET:BJC
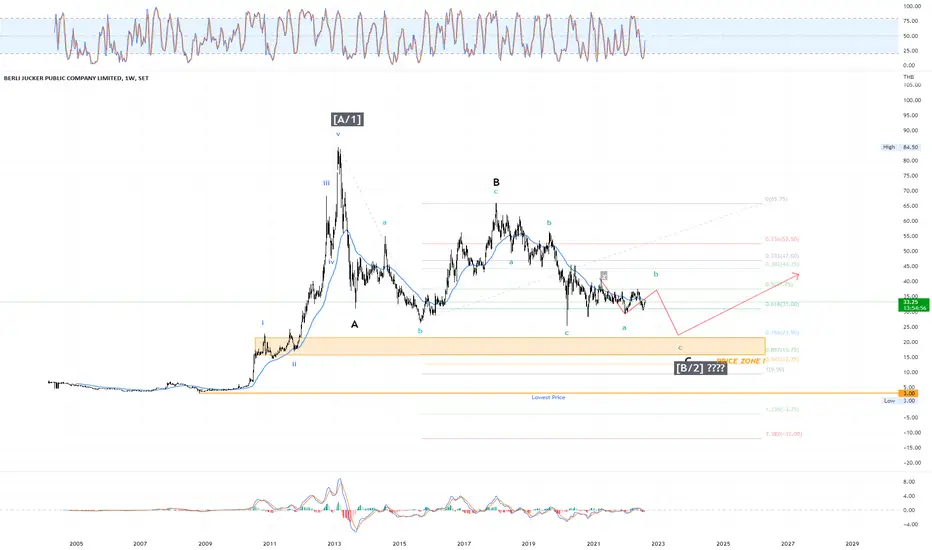
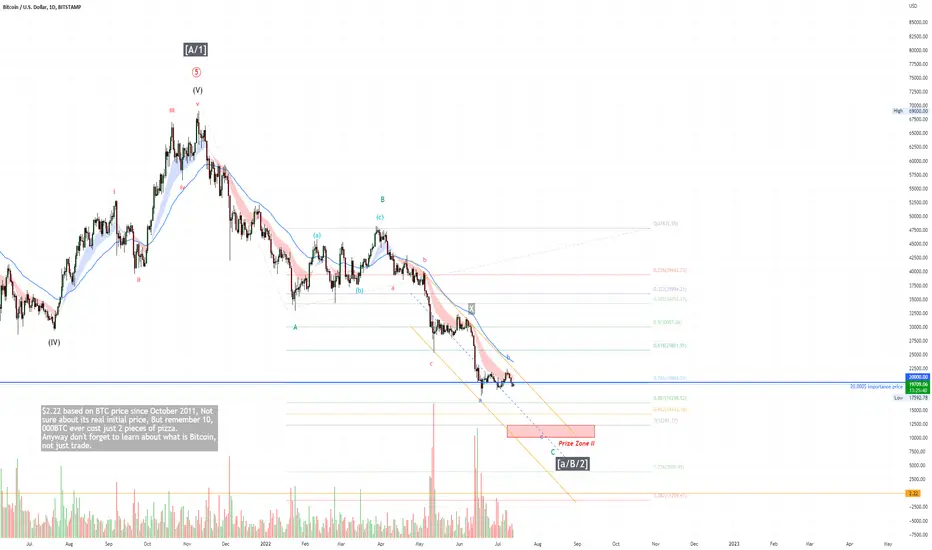
BTCUSD NEXT TARGET MAYBE "AROUND" 12,200$ ?According last post on 2022-05-06, I recount and It maybe end up with this, 69,000$ isn't B but just v, Then next correction is Zigzag (Still not finished yet)
BITSTAMP:BTCUSD
100% of A is most of Zigzag target. Main trend is still Down trend, But Bigger trend still in up!!! (Since 2010)
$GPRO - Trend Reversal with upside of 10% - 60% Technical Analysis
Breaking out of downward trend and showing signs of reversal
Price Target
Buy between $6.24-$6.45
Target 1: $7
Target 2: $9

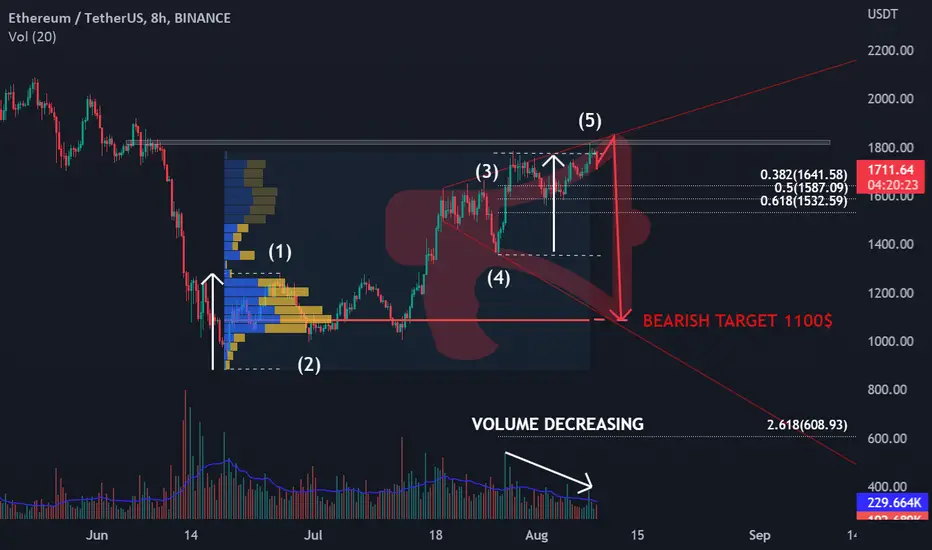
Don't get surprised if ETH plummets to 1KETH made an incredible relief rally from a bottom of 880$ to spikes above 1760$ and it means incredible returns (100%) for investors that risked capital when everyone believed ETH was heading to 500$. It's been an insane rally and ETH surpased BTC in gains but now market might correct.
Trend analysis indicates that the trend is beginning to be tired. Biggest wave seems to be completed and corrected (3 to 4), and now the price is in its last impulse with decreasing volume. It could even spike the price close to 1900$, triggering many stop loss of short positions, but from trend analysis perspective it is hard to believe that price can continue to rise up.
Observing the formation we can find a megaphone (broadening triangle) and this pattern occurs when there is disagreement between investors and high volatility too. The fixed volume range profile reafirms that 1100$ is an interesting point to buyers and sellers.
This idea is more like a warning than a trading idea, entering to the market in short position right now would be aggresive but the idea also shows the risks about being in long positions. From trend analysis perspective is needed to wait the confirmation of the correction trend to enter safer short positions. In next posts I will follow the correction trend if that correction happens. A rebound at fibonacci levels might confirm the entry for short positions.
The best trader doesn't think in how much won today, this week or month, thinks in which is the best next option to trade.
BTC Bull signal and Ascending Triangle - Target 29,000-30,000 🚀BTC Bullish case:
1. Bull Supertrend Ninja - Clean signals (green vertical line on the background).
2. Ascending Triangle (pink lines)
3. Breakout Ichimoku
4. RSI Bullish zone
5. ADX Bullish zone
6. RSI Higher high, higher lows
7. Price Higher high, higher lows
8. Price above BB: Basis
Potential gain of 24% to Fib Extension 1.618 around 29,000 USD. Let the GAINS begin !!
Remember to always take profits and use proper risk management!
Thank you for reading.
Namasté 🙏
Disclaimer: Ideas are for entertainment purposes only. Not financial advice. Your own due diligence is highly advised before entering trades. Past performance is no guarantee of future returns.
What Indicators Do I Like To Use:
I am using the "Supertrend Ninja - Clean", which is a trend-following indicator (Green and red vertical lines on the background). When the background of the candlestick closes green (vertical line). It indicates a possible bullish (up)trend. And red for possible downtrends.

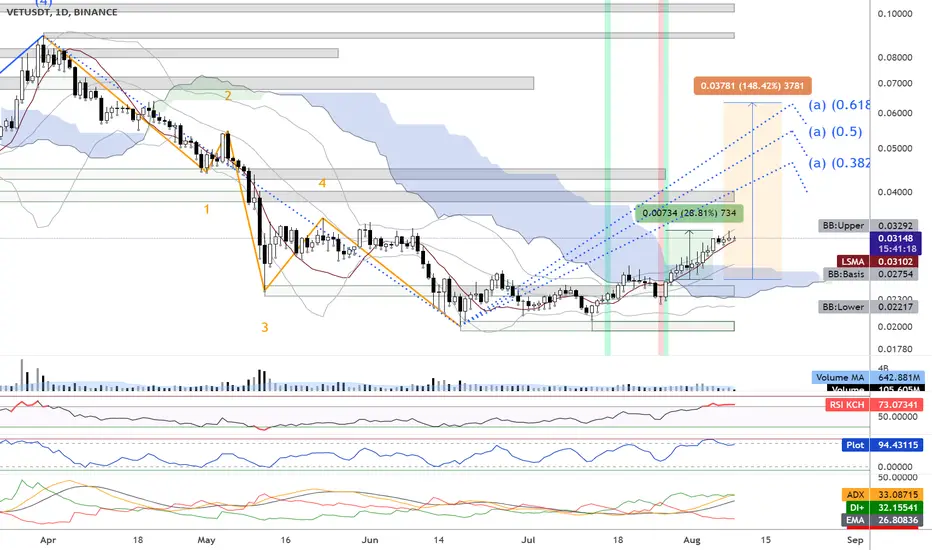
UPDATE: VET UP 29% after bullish signal - Ready for 148% 🚀🚀🚀VET pumped 29% (green price range) after the bull Supertrend Ninja - Clean signals (green vertical line on the background). VET is forming Leg A with a possible bull run to around to 0.063 USD (0.618) or 0.054 USD (0.5). Which is about 148% (orange price range) possible gain.
VET is breaking out of the Ichimoku Cloud , which is considered bullish. The RSI is starting to warm up for a bullrun at 73. RSI Brown at 96. If we take a look at the Average Directional Index ( ADX DI) its in the bullish zone, now starting to move sideways. Currently VET is above its Basis Bollinger Band, Band Basis 20 Period SMA . And above the LSMA as well.
I see more bullish than bearish elements. Since VET price and the RSI are still forming a higher low. Which is a bullish sign as well. Let the GAINS begin !!
Remember to always take profits and use proper risk management!
Thank you for reading.
Namasté 🙏
Disclaimer: Ideas are for entertainment purposes only. Not financial advice. Your own due diligence is highly advised before entering trades. Past performance is no guarantee of future returns.
What Indicators Do I Like To Use:
I am using the "Supertrend Ninja - Clean", which is a trend-following indicator (Green and red vertical lines on the background). When the background of the candlestick closes green (vertical line). It indicates a possible bullish (up)trend. And red for possible downtrends.
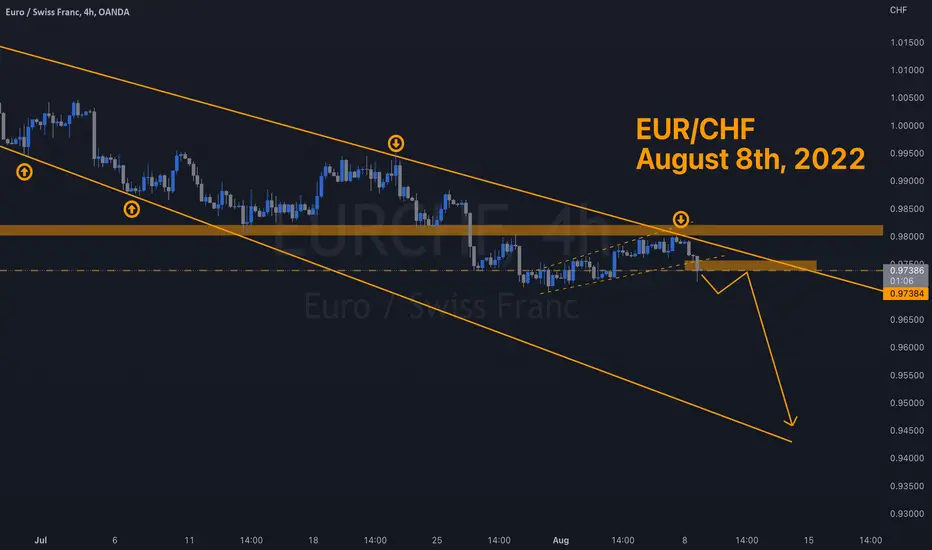
MichFX | EURCHF can possibly dive into a deep bearish movement
EURCHF is actually on a very critical support level which it didn't reach it since January 2015. Breaking this level and rejecting a pull back will open up the opportunity to take new short positions.
Share your opinion in the comments and support the idea with like.