S&P 500 Bullish Continuation?Last month, the S&P 500 bounced off a significant support level in the form of
last year’s low at $3662, and this support has held strong ever since.
This month’s candle is looking healthy and bullish following that strong bounce,
and we now want to see this bullish momentum continue.
The $4000 round number is a psychological level of resistance and could force
price back down if it struggles to break through.
On the lower timeframe price has been making a pattern of lower lows and lower
highs, but if we see a break in the pattern then that would be the early signs of a
bullish continuation.
We are waiting for confirmation of bullish momentum, and then we will be ready
to start taking long positions once again as we have our watchlist prepared.
If you like enjoyed this post, make sure to like, and follow for more quality content!
If you have any questions or comments, comment below. We reply to every comment!
See below for more information on our trading techniques.
As always, keep it simple, keep it Sublime.
Trendfollowing
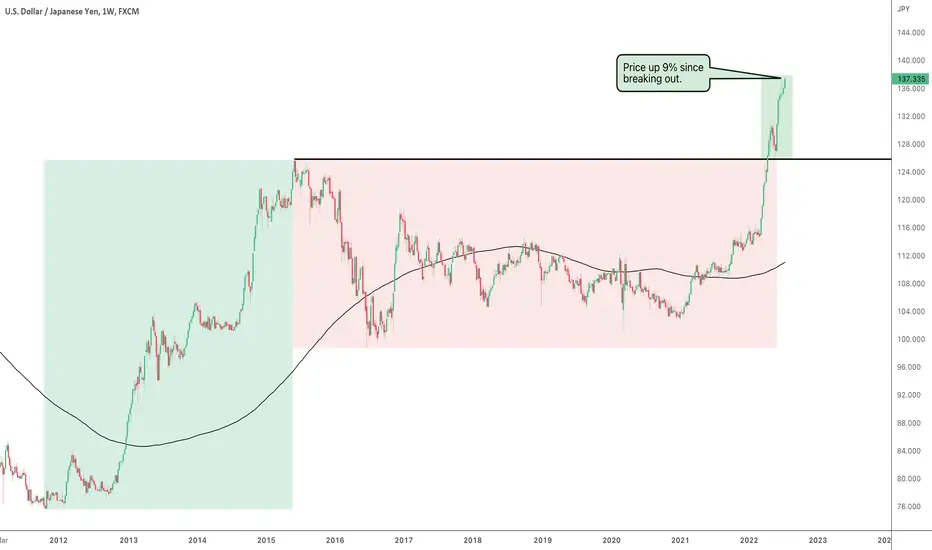
USDJPY Up 10% Now!In the last post on the USDJPY, price was up 9% since breaking above resistance
at 125.85, which is the high from June 2015. Price has now moved up an extra 1%,
bringing the total to 10%.
Price is forming a neat linear trend with small clean pullbacks along the way up.
The 20 simple moving average on the daily timeframe has been acting as support.
The next major level of resistance is at 147.67, which is from the high formed back
in August 1998. There is still enough room to compound in this trend which could
even see price exceed levels of resistance if it remains impulsive.
Patience for now, as usual, as we wait for the next setup signal to add further positions.
If you like enjoyed this post, make sure to like, and follow for more quality content!
If you have any questions or comments, comment below. We reply to every comment!
See below for more information on our trading techniques.
As always, keep it simple, keep it Sublime.
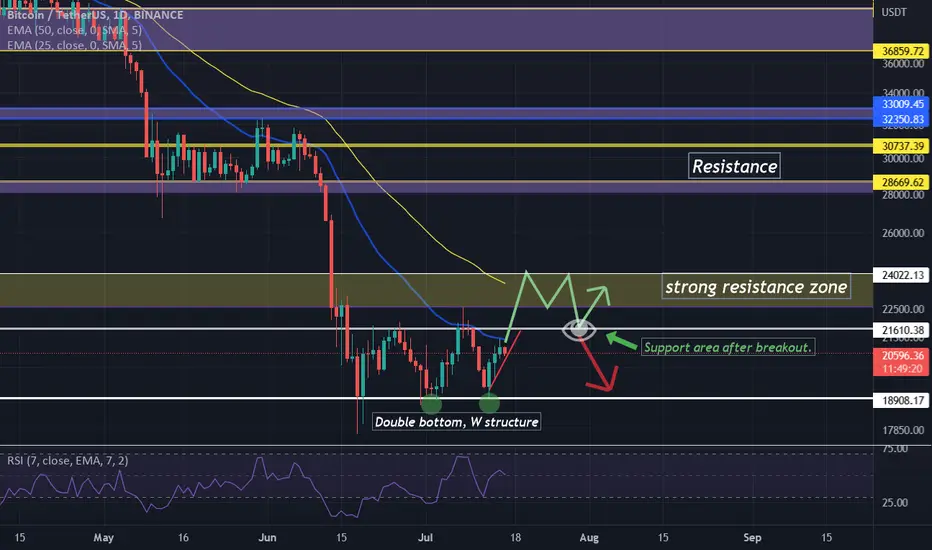
Double Bottom structure in Bitcoin!!!Hello Everyone,
I am sure you all must have seen this structure. Yes, It is Double Bottom in DAY Chart and it shows some hope for upwards movement in #Bitcoin. However, this journey is not that easy for bitcoin, we can see a very strong resistance in front of BTC from the level of 22500 to 24000. Will the buyers have enough strength to break this barrier and make the 24000 a support level? This chart shows my analysis for upcoming days. share your thoughts about this in comments.
Weekly candle closing is also very important. if everything is right, than we may see "A morning star" pattern in weekly chart. which will be very important to understand where we are moving with Bitcoin.
my positions right now: (Kindly manage your risk accordingly. my recommendations is for spot trading only)
First Trade @ 20500
Long;
Target: 22250
Stop loss: 20250
Second Trade @ 22250-22750
Long
Target: 23500
Stop loss: 22000
Please like and comment to share your ideas. Happy & Safe Trading!!!
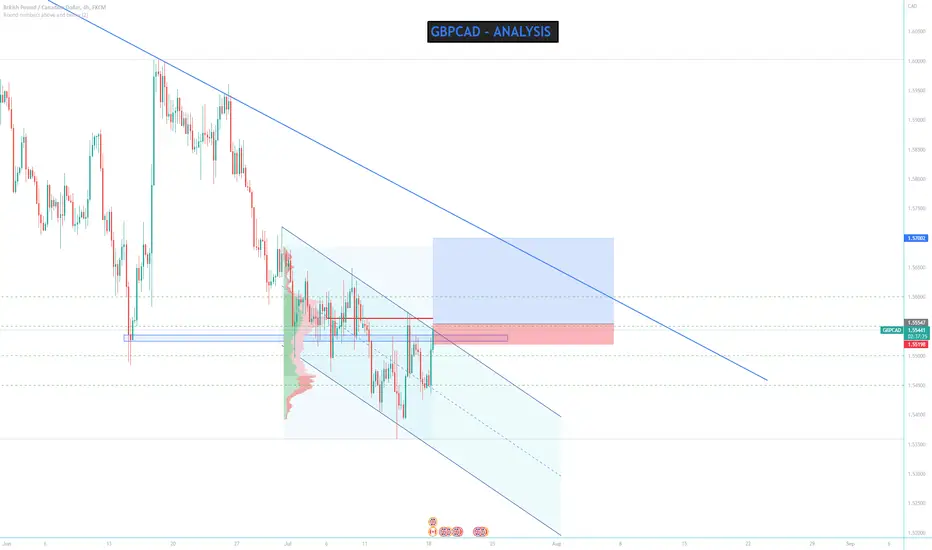
GBPCAD TREND CHANNEL BREAKPair: GBPCAD
Timeframe: 4H
Analysis: Round number level, Strong resistance, Trend Channel, volume profile, Currency strength index
Key Takeaway: Break of trend channel
—————
Level needed: Need to see price hit 1.5545
—————
Trade: Long
RISK:REWARD : 1:4
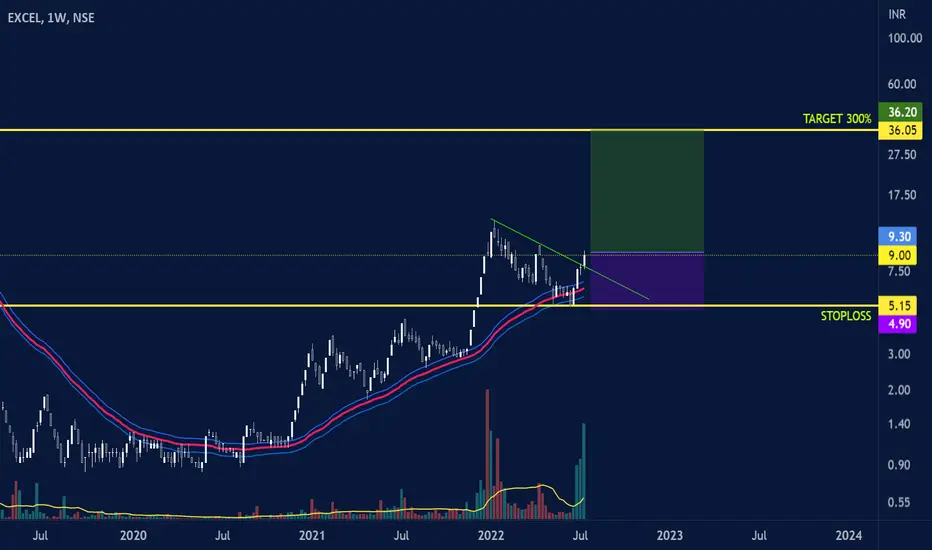
EXCEL : TARGET 300%HELLO FRIENDS!
Excel is bullish as it's trading above the band as per my strategy explained in in the video on my channel POWER OF MOMENTUM by Amit Mandal. So we can take entry at cmp as price has given breakout above the trendline decisively. Sl and Target are mentioned clearly in the chart. One can take entry with proper position sizing & risk management. RISK VS REWARD is more than 6.
DISCLAIMER : Trading is risky. I hereby explain my trading ideas for knowledge purposes only.
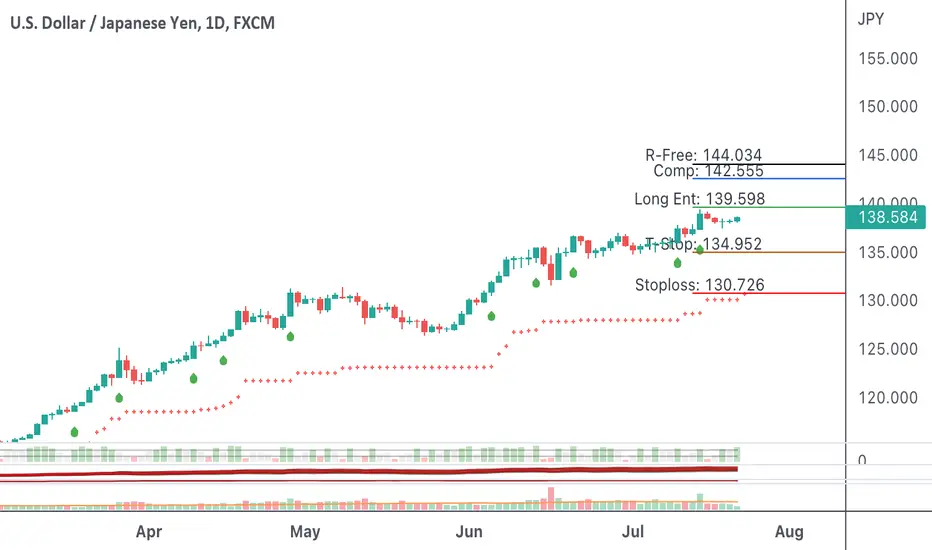
USDJPY Up 9% After Breaking Out!With the US Dollar now on the move, some forex pairs are forming trends and one of them
is the USDJPY, which recently broke out from long-term consolidation.
Price started to consolidate in June 2015 and broke above resistance in April 2022.
There was a nice move up, and then a pullback, then price continued to move back to the upside.
Since breaking out, price has moved up 9%. This forex pair has trended really well in the
past and is likely to do the same going forward now that we have a breakout.
The current trend appears linear and clean, and if we continue to see a pattern of higher highs
and higher lows with small pullbacks, that will confirm a linear trend is in play.
If today’s bar closes with a break and close above the previous high, it will confirm a trend continuation.
If you like enjoyed this post, make sure to like, and follow for more quality content!
If you have any questions or comments, comment below. We reply to every comment!
See below for more information on our trading techniques.
As always, keep it simple, keep it Sublime.
Pressure to break supportas you see we have a little trading range area which is below its downward trend line and Considering the support that has now become a resistance zone, the pressure to break TR has increased downwards, and sell transactions can be considered in pullbacks.
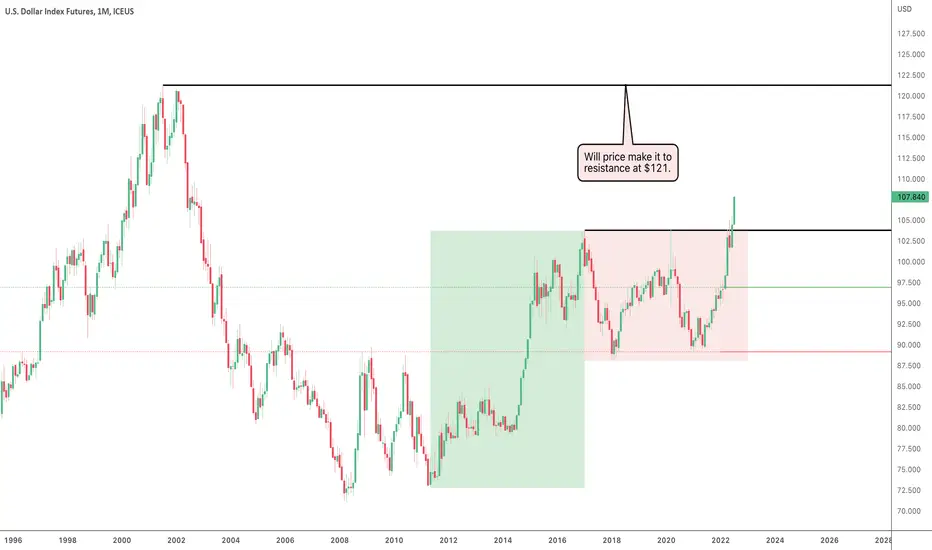
US Dollar Up 3%The US Dollar has moved up 3% so far this month and entering price levels
we haven’t seen since 2002 and still climbing.
Price was previously in an area of consolidation, which ran from 2017. With a
breakout from a long period of consolidation, we can expect a strong move in
the direction of the breakout.
The 3% move to the upside this month equates to $3 and price may continue
to climb and if it does then forex pairs that the US Dollar influences are likely
to move as well.
The next level of resistance in the way is at $121, which is the high of July 2001.
A move to this level would create a trend large enough to allow us as trend-followers
to compound and profit heavily from such a move.
If you like enjoyed this post, make sure to like, and follow for more quality content!
If you have any questions or comments, comment below. We reply to every comment!
See below for more information on our trading techniques.
As always, keep it simple, keep it Sublime.
Datatec at an area of valueJSE:DTC reached a 52-week high today, it also broke above a resistance level. If you zoom into the monthly time frame you'll see that it's near a potential resistance as well, old resistance level. I'm bullish on JSE:DTC on D/W time frames, the resistance level could be an issue but it's an old level.

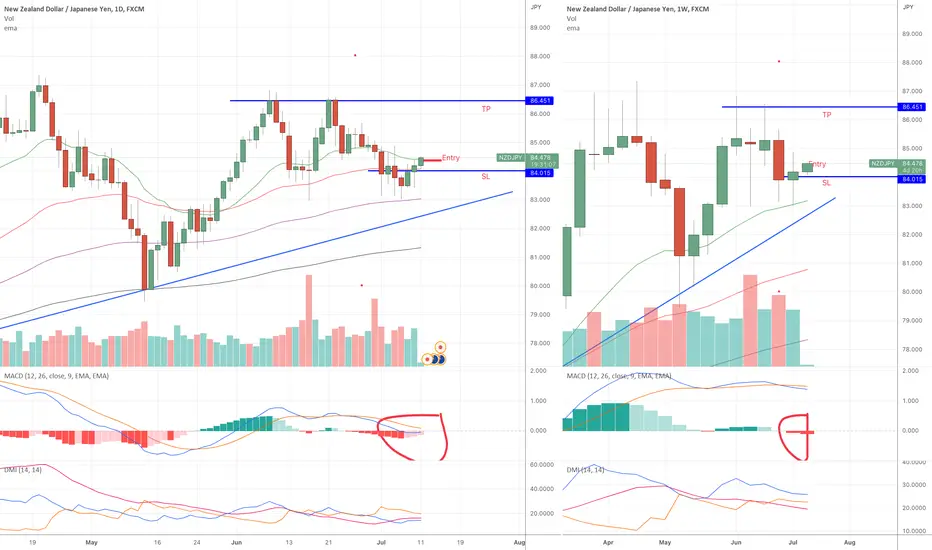
NZDJPY may push upward 50EMA break 100EMA Bounce 1D Trend Follow50EMA break
Trendline upward
100EMA bounced
50EMA > 100EMA > 200EMA
MACD: Near Zero
Entry: High of Candle that Break 50EMA
Stop Loss: Slighty below 50EMA (Red EMA)
Initial Target Price: Upper Blue Line
Trailing Stop Loss: Previous Day Low
Risk: 1-2 %
GBPJPY may push upward 50EMA break Trenline Bounced 1D50EMA break 2 days ago
Bounce from major trendline upward
50EMA > 100EMA > 200EMA
Entry: 20EMA - Green EMA
Stop Loss: Slighty below 50EMA (Red EMA)
Trailing Stop Loss: Previous Day Low
Initial Target Price - Higher High
Risk: 1-2 %

ANZ.ASX - FUNCHARTS - Countertrend Trading with a Trend FilterNote: Funcharts are interesting charts I have found that offer a potentially unique perspective on a stock. Sometimes I’ll throw something out there that you might find controversial or wrong headed. If that’s the case your 2 cents worth is most welcome.
ANZ, one of the big four banks listed on the Australian Stock Exchange is a pretty tricky stock to trade, conforming more to a six month cycle between dividend and earnings dates. However from a purely technical standpoint, on a medium term basis there are opportunities to trade in line with a longer term trend, and on a short term basis to enter the stock on very short term pull backs.
In this analysis we looked at the Supertrend Strategy using a 50 period length with a 6xATR Factor to capture longer term trends and then looked at buying short term dips and selling short term rallies.
In the longer term timeframe this worked quite well with ANZ making good money based on the Performance Summary but entries and exits are few and far between with this approach. Bringing the time frame back to a swing trading standpoint, the best results came from using the Supertrend STRATEGY in a countertrend way, buying dips and selling rallies using just a 3 period ATR Length with a 1 period factor, giving plenty of trades. Filtering the short term system with the longer term trend also resulted in more frequent winning trades so trading countertrend in the very short term with a longer term trend filter worked nicely.
The catch is when you get a longer term trend change without a resulting rally to exit on the countertrend system, which can at times result in very large losses, like during Covid. It is for this reason a stop loss should be set, even when trading countertrend to prevent large losses on a stock that does often trend. Using the blue trailing stop line is a common sense area to position a stop loss as insurance against a big fall.

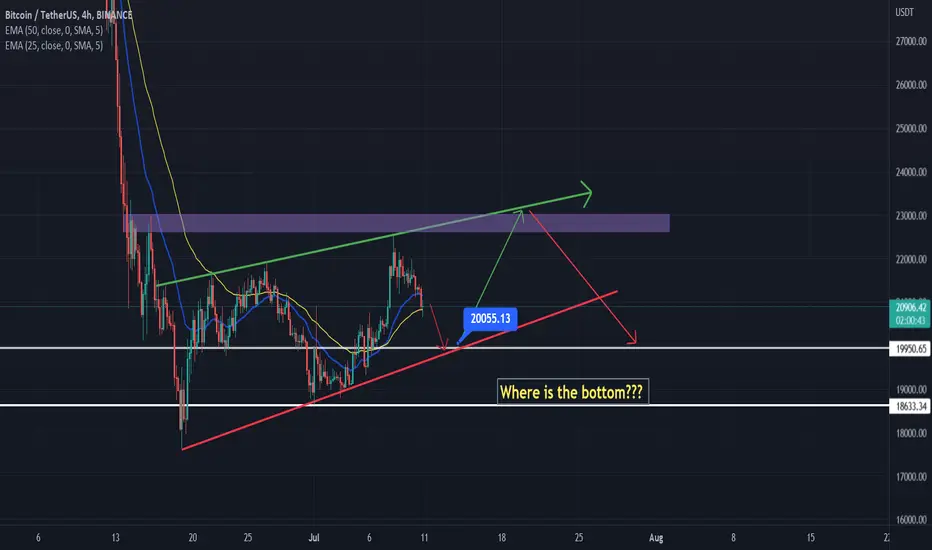
Where is the Bottom??? BTC GOING DOWN!!!Hello Everyone,
something is clearly visible for this month. i want you all to recall upward wedge, the price is hypothesized to breakthrough the support.
So here is my analysis. We are going to retest 20000 support. and i am 100% sure we are going to see bounce back from 20k support line to test 22500 again. If we break this support next time, we have seen the bottom. But, if BTC fall back to retest 20K, we don't know where is the bottom. May be between 12500 to 16500.
So, this is a short term SHORT call. Your target should be 20100.
Happy and Safe trading. Please manage your risk management accordingly.
Kindly Like, and let me know in the comment section about this analysis.
Worst is over - BTC 2022 - BULLISHAs a result of the current market instability, some investors are panic selling, while others are clinging on in the hopes of a recovery. In just three months, the value of Bitcoin has fallen by more than 60%... On the weekly TF, we've reached the 200 SMMA trendline. Since 2015, we've been relying on this support trendline... Is this time any different? Well soon we'll find out.
Looking at the monthly TF we also are testing the 50 SMMA trendline. It is only if we lose this key level that we can consider a new idea:
The shark harmonic pattern, which has a target of approximately $12,000 for the next long opportunity.
Right now, though, we've reached a bottom and this represents one of the best buying opportunities.
Altcoins retraced more than 90% and showing great chart setups.
Does it mean we won't see any further decline? No doubt we can, however if we look at the overall picture, we can argue that purchasing cryptocurrency at a discount is a good deal.
ABBV - FUNCHARTS - Follow the TrendNote: Funcharts are interesting charts I have found that offer a potentially unique perspective on a stock. Sometimes I’ll throw something out there that you might find controversial or wrong headed. If that’s the case your 2 cents worth is most welcome.
Abbvie (ABBV) listed on the US market sets up nicely as a Trend Following stock. If you are in Tradingview insert the Supertrend Strategy and change the inputs to a 50 period ATR length with a factor of 2 times ATR trailing stop.
The strategy will buy when the daily closing price closes above the ATR trailing stop and go short when the price closes below the ATR trailing stop (shown in blue and red on the chart).
A look at the performance summary for long trades shows 44% winning trend with a win:loss ratio of 2.22 with a profit of over 109% through the period. Whilst buy and hold was the best strategy overall the drawdown was much lower for the trend following strategy and almost as much money was made. Stock like this that trend nicely, whilst allowing you to manage downside risk can be used with a certain amount of leverage as it follows the age old mantra of letting profits run and cutting losses early.
As with all trend following strategies, a low win rate but high win:loss ratio is to be expected.

AXP - FUNCHARTS - American Express MusingsNote: Funcharts are interesting charts I have found that offer a potentially unique perspective on a stock. Sometimes I’ll throw something out there that you might find controversial or wrong headed. If that’s the case your 2 cents worth is most welcome.
So much for stock selection, American Express ( AXP ) was the first stock on my list, even above AAPL , and here I was thinking my list was in Alphabetical order, of which my offsider will be quick to point out that I should be using a Mac, not a PC... moving on, What is the best way to trade American Express based on the Technical numbers?
There are two tests I run to determine the best way to trade. Firstly let's run the numbers on long term trends. I used the Supertrend Strategy for this. Adjust the inputs so we use a length of 50, thus smoothing out the ATR volatility and then use an ATR value of 6. In layman's terms this means we are running a 6 x ATR (chandelier) trailing stop. When price closes below the trailing the test generates results for entering short trades, and when price closes above the trailing stop the test generates results for long trades. Refer to the performance report below (and be aware there is a drop down menu on the strategy name to flick between the longer term trend following system and the shorter term mean reversion system). Also, make sure you view the Performance Summary, not Overview, we are specifically looking at the comparison between long and short trades.
The first test - Taking Long Trades in line with the trend (when price is above the blue line) made money, 274% to be exact with profitable trades 38% of the time, meaning the win:loss ratio at 2.67 had to be favourable, which it was. But wait going short into a down trend (selling when price is below the red line) lost big! 322% to be exact, so historically you made (slightly) more money buying the big pull backs, as opposed to the breakouts but the drawdown was bigger as you get stuck in losing trades. However, what this is really saying is more money was made from Buy and Hold on AXP (historically), as opposed to breaking the market into an uptrend/downtrend regime.
The second test - Let's now look at the short term. Again we will use the Supertrend Strategy, this time we will use 3 periods for the ATR length and 1.5 as the ATR factor, thus looking at very short term trends (sub 30 days). Further I have flipped the signals so it buys into a short term downtrend and sells into a short term uptrend. Use the Performance Summary below (not Overview) to take a look at Long Trades and Short trades, the strategy name is Supertrend STRATEGY (with STRATEGY in uppercase, not lowercase). Here buying the dips made money but not much winning 66% of trades with a profit factor of 1.18 (low) so buying short term dips was sub optimal. Looking at selling short term rallies however was very poor, you lost money. If you went short a rally (in the short term, when the close crossed above the supertrend trailing stop and exiting when it crossed below) the resulting loss was 147%. It therefore made more sense to enter long AXP in line with the short term trend, as opposed to entering early and buying the dip. Nonetheless, the result in the short term wasn't staggering either trading either long or short.
Given the results were not great on a daily chart either way, I changed the chart to a weekly chart, after all, if you are following so far, you would have seen that AXP was (slightly) better as a countertrend strategy in the longer term. Running the same strategy as in the second test on a weekly graph the results improve significantly, going long on a dip made 172%, winning 82% of the time. That is a great setup, in fact pretty good as a stand along trade. But if you want to run stops and manage risk, rather than being stuck in losing trades for a long term, you could use the week chart as a setup, and then enter in line with the short term trend on a daily chart using the second tests strategy above...
Overall the conclusion is you should use a mean reversion strategy (buy the dips) on American Express with a weekly chart, but use a shorter term trend following system to trade it on a daily chart .
Where are we now? Well it just so happens that on a weekly time frame the stock is in buy territory according the the Supertrend STRATEGY and on a daily chart is pretty close to a short term uptrend...
Did this make sense, let me know if you have any questions!

US Oil Battles With 2011 HighThe price of US Oil has not consistently traded above the May 2011 high at $114.79
since the high was formed as price has not remained above this level.
Price did move above this resistance in March, May, and June, but the sellers forced
price back down again.
We have a major support level below price in the form of the $100 round number,
which may prevent price from declining further.
So far this month, the candle is bullish, but this could change as we are only a few
days into the month. If the buyers can gather enough momentum, we should see
another attempt above resistance.
There is nothing to do now except wait for a clear trend direction to form. Trying to
go long now could see your position close out for a loss if price reverses sharply at
resistance again.
If you like enjoyed this post, make sure to like, and follow for more quality content!
If you have any questions or comments, comment below. We reply to every comment!
See below for more information on our trading techniques.
As always, keep it simple, keep it Sublime.

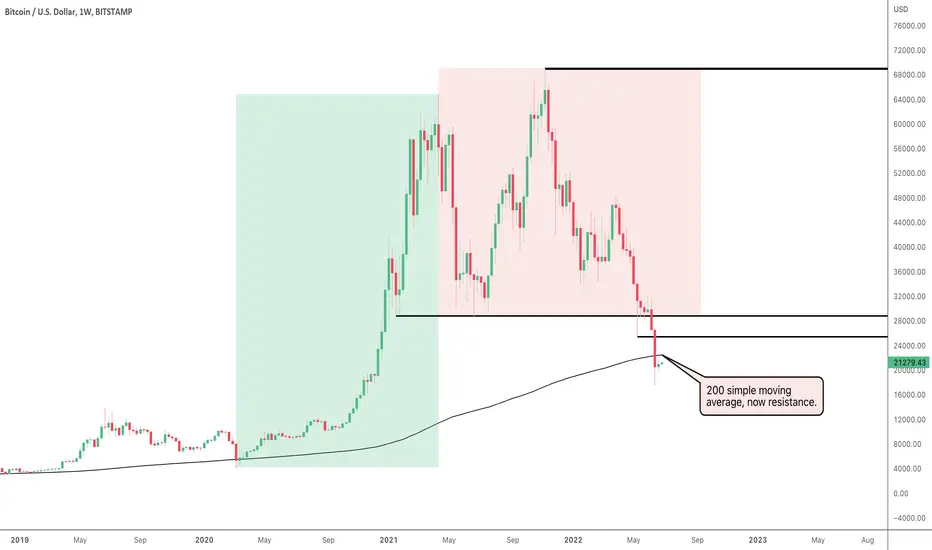
Bitcoin Breaks Major Support From 2017It is still early in the month, and the week has only just started, but Bitcoin is now trading
below a major support level which has now turned resistance.
Last month, price bounced off the December 2017 high support level at $19,666. The sellers
have taken control so far this month but will price close above this level by the end of the month.
Bitcoin has been displaying signs of weakness since November 2021, so we are now waiting
for a strong support level to prevent price from declining further.
Once we see a change in this market’s behaviour, we will look for opportunities to go long.
The early signs of a bullish reversal is a pattern of higher highs and higher lows on the daily
timeframe. The next sign is price breaking above multiple resistance levels. Patience until then.
If you like enjoyed this post, make sure to like, and follow for more quality content!
If you have any questions or comments, comment below. We reply to every comment!
See below for more information on our trading techniques.
As always, keep it simple, keep it Sublime.

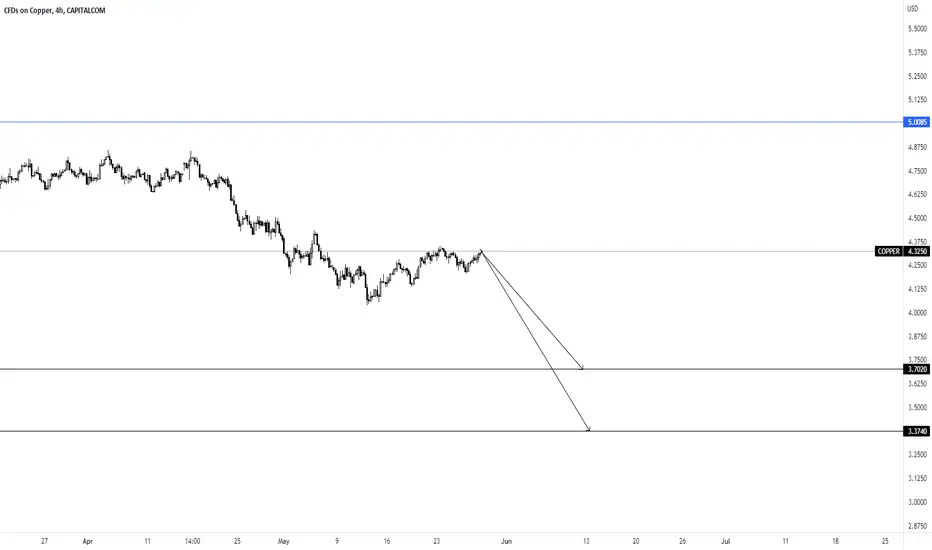
COPPER Copper has rejected an important level also violated EMA's to show a clear correction. Natural gas following the same path lagging but to follow the similar path I think, Option Volatility in commodity currencies such as AUD,NZD have been of interest the past two weeks.
Selling commodities and Commodity currencies, Buying the Dollar and waiting for and an entry signal to get back in to Equities, My ideal trades till September.
Silver is leading Copper.
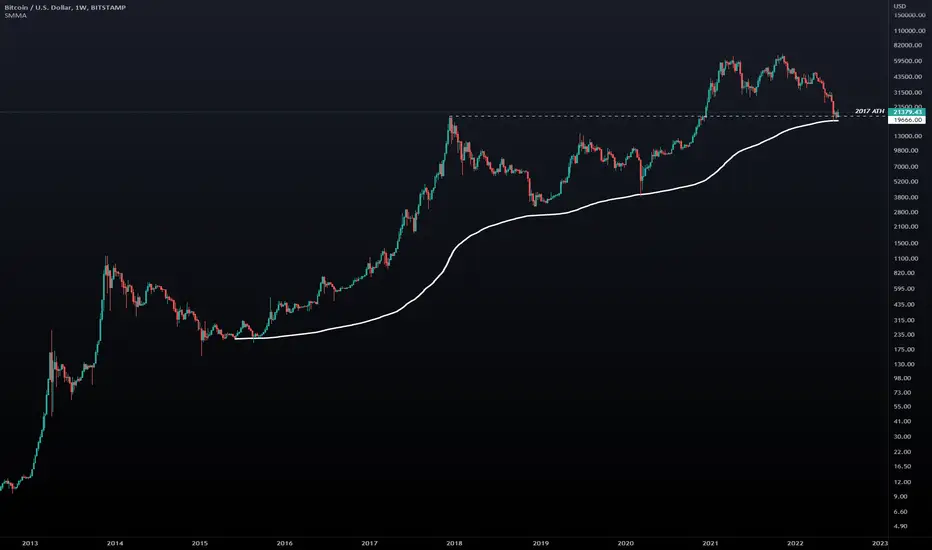
Will Bitcoin Go Higher Or Lower?Bitcoin has declined further since the last post, dropping down through the
weekly 200 simple moving average which is now resistance.
Price also declined below the $20,000 round number but has since moved
back above this level and is slowly creeping back towards the moving average.
This current move up does resemble a pullback, and if it is then we will likely
see a continuation to the downside.
Historically, a trend has usually followed a bounce off the weekly 200 simple
moving average so we will have to see if history is set to repeat itself.
There is nothing much to do with Bitcoin right now and the best position to
hold is standing aside until we start to see signs of bullish moves to long,
or bearish moves to go short.
If you like enjoyed this post, make sure to like, and follow for more quality content!
If you have any questions or comments, comment below. We reply to every comment!
See below for more information on our trading techniques.
As always, keep it simple, keep it Sublime.
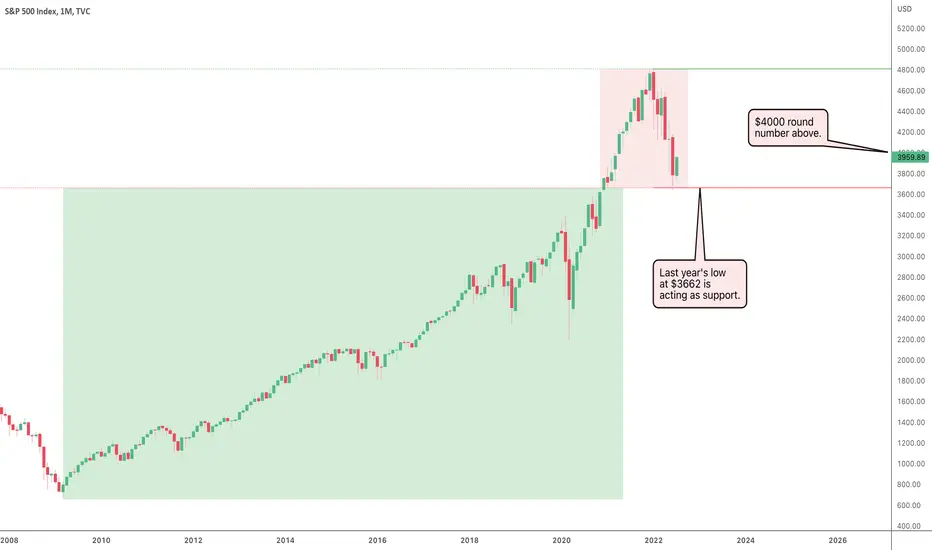
S&P To Break $4000?The S&P 500 has moved further away from last year’s low support level at $3662
which is proving to be a strong level to break.
There is now a long wick below June’s candle after price bounced hard off that
level, but will it be the start of the resumption of the bull trend.
May’s candle closed as an indecision candle with a long wick but price still exceeded
the low of May. A long wick does not guarantee a trend resumption but a pattern of
higher highs and higher lows on the daily timeframe suggests a possible trend resumption.
Price still remains below the $4000 round number so we have a monthly close above
this level which will further suggest price may continue to move to the upside.
As for now, the overall trend is bullish so we just need to wait patiently for signs of a
continuation on the lower timeframe as mentioned.
If you like enjoyed this post, make sure to like, and follow for more quality content!
If you have any questions or comments, comment below. We reply to every comment!
See below for more information on our trading techniques.
As always, keep it simple, keep it Sublime.
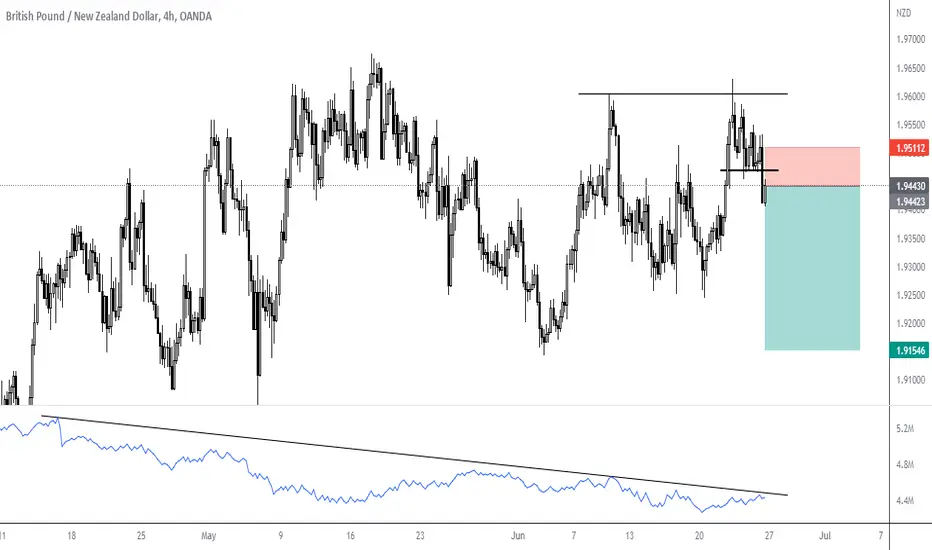
GBPNZD A Great Selling Opportunity 🤨👌Trade Proposal:
There is a probability of first tp to the proposed ( 1.91500 ) Direction line. So, Traders can set orders based on Price Action and expect to reach short-term goals.
Technical analysis:
GBPNZD is in Downtrend and It is Expected to Continue Downtrend.