TSLA - My Trading Plan in a video!Hello everyone, if you like the idea, do not forget to support with a like and follow.
Here is the top-down analysis for TSLA, feel free to request any pair/instrument or ask any questions in the comment section below.
Best of luck!
Trendfollowing

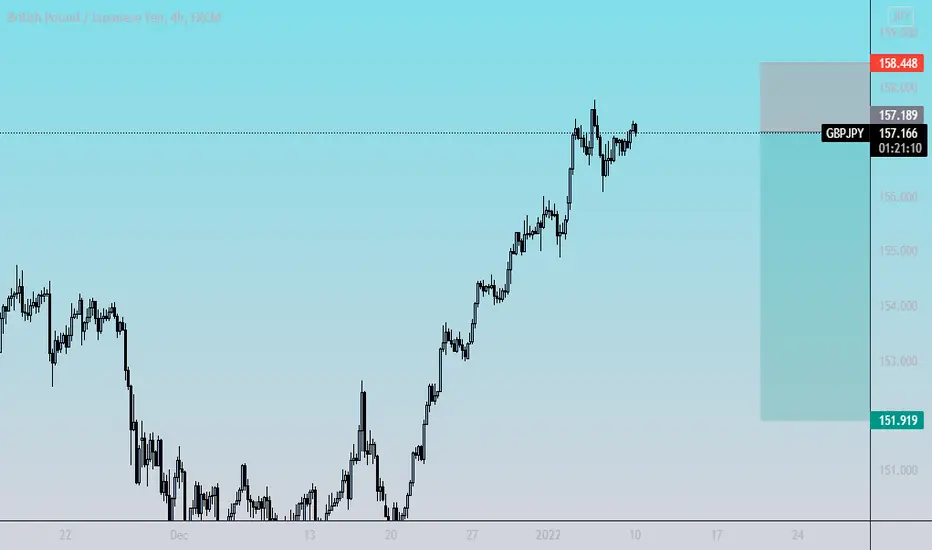
#GBPJPY more than 300 pip profit will be in th way FX:GBPJPY
i think this is best chance to runing a big down move in gbp jpy , im in this trade with 0.75 of my equity i
if in h1 create a new down trend , i will put again into this trade in the correction of h1 trend and i will gain more than 8:1
#gbpjpy #trendfollowing #structure #daytrading #forex
Bitcoin Same Price One Year LaterWill Bitcoin finally hold from declining any further? Only time will tell, but this level
has held strong before so let’s see what happens next.
A high was formed in January 2021 at $42,000 but the following month price surged
past this level. From then on we have seen a sideways market.
This level was then used as support in September 2021 before we saw a bounce and
price go on top create another new all-time high briefly.
Price has since declined from the all-time high of $69,000 and come down to the
January 2021 support zone.
So far this week we are seeing a bounce and we may well start to see another
bullish move. The $50,000 round number does stand in the way but with enough
momentum, this level can be broken again.
A surge in the price in Bitcoin should see the rest of the cryptocurrency market
form strong bullish moves as well.
See below for more information on our trading techniques.
As always, keep it simple, keep it Sublime.

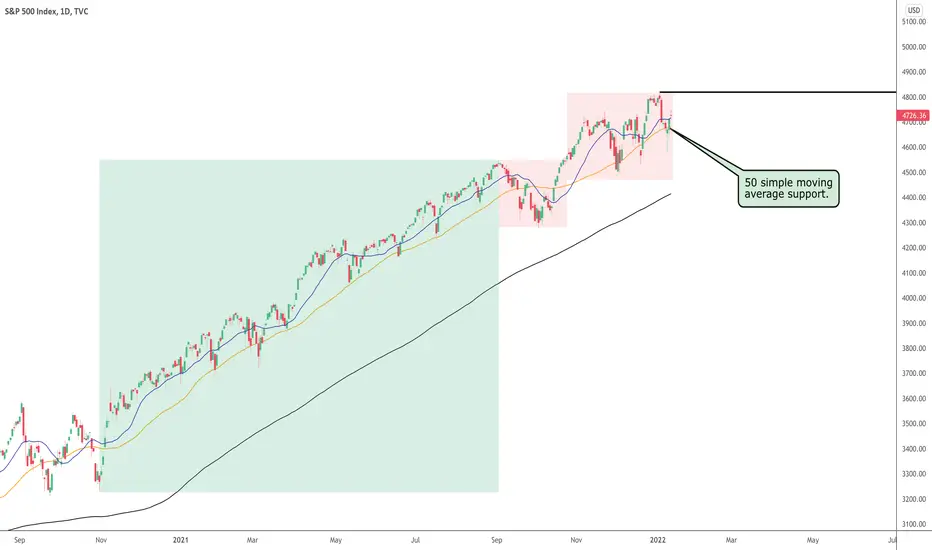
S&P New Year's DeclineIt’s the start of the year, and already, the markets are displaying a bit of
turbulence to shake off the dumb money investors.
This is merely a pullback for now, and there are clear signs to confirm this.
We can see that the S&P has been using the 20 and 50 simple moving averages
as support since the breakout in November 2021.
At times when price moved lower than the 50 simple moving average, it didn't
take too long before it resumed the bullish trend.
On January 4th 2022, price started to decline from a height of $4818 and pulled
back to the 50 simple moving average, and did move below this indicator but
didn’t close too far from it, forming a reversal candle.
This was our indication that a pullback was in play unless we continue to see
further weakness. So what we want to see now is a move towards the current
all-time high at $4818 and then a break and close above this level.
We continue to look for bullish stocks as the overall market still looks strong.
See below for more information on our trading techniques.
As always, keep it simple, keep it Sublime.
Deepak Nitrite - inverse head and sholdersDeepak Nitrite showing inverse cup and handle with BO at 2400.
Final target is 3000 so hold your reigns and keep enormous patience to make wealth.
Panic only causes regret and loss.

Another ALTSEASON after this correction? Trading kept Simple.Please Like or Follow if you enjoyed this content.
UPDATE: Total3 (Cryptomarketcap minus BTC and ETH martketcap) dips into support. Altcoin marketcap is moving in a range. So it's not man over board. Fear is high. Marketcap can dip to 700B, and we are still in the same range. Either it goes sideways here or one more dip. And we are gonna see another Altseason. Question is are we gonna see a mini Altseason or a MONSTER ALTSEASON?
RSI is now about the same level as the May bottom. One more leg down to scare people out, so the whales can pump one more time? The price is currently on the negative side of the Ichimoku . But that's not something we haven't seen before.
My 'Supertrend Ninja' indicator gave only 3 bullish signals for ALTSEASONS in 2021. Making each signal very reliable. I am patiently waiting for the first bullish ALTSEASON signal in 2022. "The Crypto market is a device to transfer money from the impatient to the patient.”
With each trade proper risk management is essential. Either by using my script "Trailing Stoploss Bottom Activation indicator", visible as grey dots below the candles. Which sends an alert, when current price goes below the previous candle low. Or using my "Heikin Ashi Trailing Stoploss Activation", the indicator(in my scripts) with green and red blocks. Or third option, exit when the Supertrend Ninja indicator displays a vertical red line with a downwards pointing black arrow. Remember, the first stop(loss) is always the cheapest stop.
Supports and Resistances are highlighted as grey blocks. Supports and resistances are automatically drawn using my indicator "Yo Show Me Some Support - and Resistances". Pun intended.
Thank you for reading.
Namasté 🙏
What Indicators Do I Use:
In the chart I am using my "Supertrend Ninja indicator", which is a trend-following indicator (Green and red vertical line with arrows).
When the background of the candlestick closes green (vertical line) with an upwards pointing pink arrow. It indicates a possible bullish (up)trend.
Disclaimer: Ideas are for entertainment purposes only. Not financial advice. Your own due diligence is highly advised before entering trades. Past performance is no guarantee of future returns.

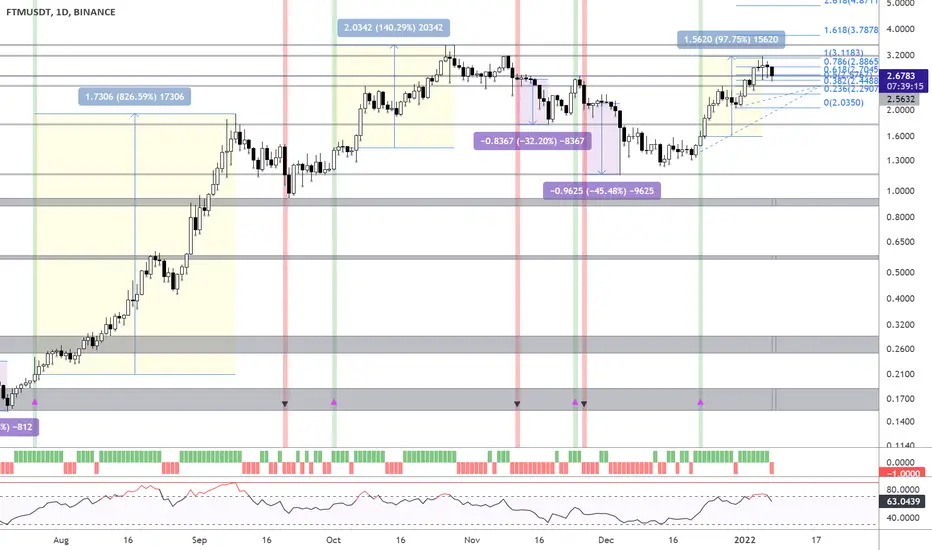
UPDATE: FTM UP 4117% after bull signal - Another 40% next?Please Like or Follow if you enjoyed this content.
UPDATE: The price went sideways for two months before the big pump in Jan 2021. Making a whopping 4117+% after the bullish "Supertrend Ninja" signal. That's a life changing trade for many people. Gains are in yellow. It also predicted some heavy drops (in purple) of -70% and more recently 46%. FTM went up 98% after the latest bullish "Supertrend Ninja signal". And it still has room to go another 40% to 3.78 USDT (1.618 fib)
FTM doesn't care what Bitcoin does. It's gonna break ATH very soon. With each trade proper risk management is essential. Either by using my script "Trailing Stoploss Bottom Activation indicator", visible as grey dots below the candles. Which sends an alert, when current price goes below the previous candle low. Or using my "Heikin Ashi Trailing Stoploss Activation", the indicator below with green and red blocks. Or third option, exit when the Supertrend Ninja indicator displays a vertical red line with a downwards pointing black arrow. Remember, the first stop(loss) is always the cheapest stop.
Supports and Resistances are highlighted as grey blocks. Profits can be taken at each grey block. Supports and resistances are automatically drawn using my indicator "Yo Show Me Some Support - and Resistances". Pun intended.
Thank you for reading.
Namasté 🙏
What Indicators Do I Use:
In the chart I am using my "Supertrend Ninja indicator", which is a trend-following indicator (Green and red vertical line with arrows).
When the background of the candlestick closes green (vertical line) with an upwards pointing pink arrow. It indicates a possible bullish (up)trend.
Disclaimer: Ideas are for entertainment purposes only. Not financial advice. Your own due diligence is highly advised before entering trades. Past performance is no guarantee of future returns.
UPDATE: BTC UP 493% after bullish signal - Done correcting?Please Like or Follow if you enjoyed this content.
UPDATE: The price dumped into support around 42,000 USDT. I added two supports in blue, in case BTC isn't done correcting. Next line of defense is around 40,000 USDT. Break that, we will go down to 37,500 USDT.
I wouldn't be surprised if BTC went sideways here for few weeks, before starting another bull run. Fear is at its highest. Nothing goes down forever. My "Supertrend Ninja" indicator hasn't given a bullish signal as of yet. Based on the old gains (yellow). And the corrections (purple). The Supertrend Ninja seems to be very reliable. So I'll be waiting patiently for the market to change its trend. You don't need to buy the bottom. You just need to ride a big part of the uptrend.
Generally my "Supertrend Ninja" indicator gives around 2-8 bullish signals a year. In 2021 it only gave 4 bullish signals, with both being very reliable. Making gains of 50% and 43%.
Supports and Resistances are highlighted as grey blocks. Profits can be taken at each grey block. Supports and resistances are automatically drawn using my indicator "Yo Show Me Some Support - and Resistances". Pun intended.
Thank you for reading.
Namasté 🙏
What Indicators Do I Use:
In the chart I am using my "Supertrend Ninja indicator", which is a trend-following indicator (Green and red vertical line with arrows).
When the background of the candlestick closes green (vertical line) with an upwards pointing pink arrow. It indicates a possible bullish (up)trend.
With each trade proper risk management is essential. Either by using my script "Trailing Stoploss Bottom Activation indicator", visible as grey dots below the candles. Which sends an alert, when current price goes below the previous candle low. Or using my "Heikin Ashi Trailing Stoploss Activation", the indicator below with green and red blocks. Or third option, exit when the Supertrend Ninja indicator displays a vertical red line with a downwards pointing black arrow. Remember, the first stop(loss) is always the cheapest stop.
Disclaimer: Ideas are for entertainment purposes only. Not financial advice. Your own due diligence is highly advised before entering trades. Past performance is no guarantee of future returns.

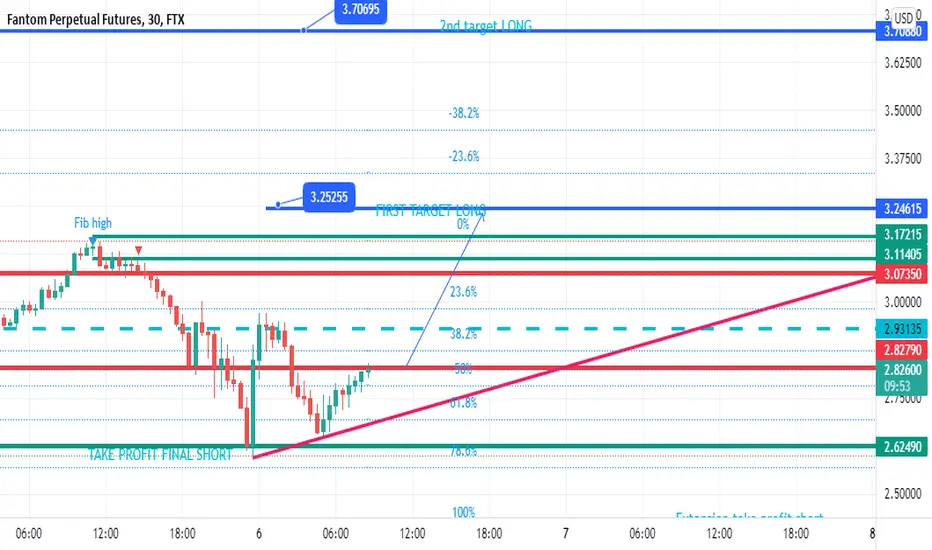
LONG FTM 2.78 TARGET 3.2 and 3.7the stoploss is at 2.60 which is yesterday's target, if price turns back from here we could get an extension down. The overall structure is bullish. I've just checked the 2 hrs time frame it shows that the bounce happened at its 38% which is a sweet zone for bounce. MY reasons to play long is that there's more growth opportunity than the decline probabilities from here. Yesterdays downfall was almost expected and quite violent, it was needed to shakeoff a few noobs which were long and induce a bear mindset, this is how the market gets you shorting the bottom while it goes slowly and steadily up. Yesterday we shorted the top now we long a bounce, it's the most probable trade to do
If you find this helpful please help by subscribing to ftx using my referral link, i'll be giving you quality signals for free here ,
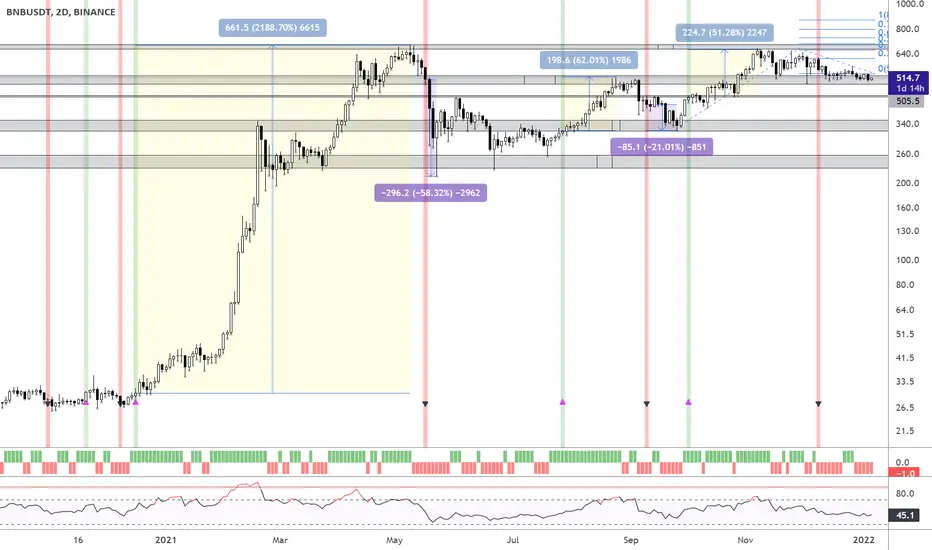
UPDATE: BNB UP a MASSIVE 2190% after bull signal - What Next?Please Like or Follow if you enjoyed this content.
UPDATE: The price went sideways for a while before the big pump in Dec 2020. Making a whopping 2190+% after the bullish "Supertrend Ninja" signal. That's a life changing trade for many people. Gains are in yellow. It also predicted two big drops (in purple) of -67% and -58%.
Currently the price seems to be in a range. Which is visible in the RSI as well. Another drop here to 435 USDT before making a bull run, or continue moving sideways in this range wouldn't surprise me as well. Generally my "Supertrend Ninja" indicator gives around 2-8 bullish signals a year. In 2021 it only gave 2 bullish signals, with both being very reliable. Making gains of 52% and 62%.
Take profit levels are shown in blue using Fibs. I foresee BNB going to 1073 USDT (1.618 fib) in the next bullrun.
Supports and Resistances are highlighted as grey blocks. Profits can be taken at each grey block. Supports and resistances are automatically drawn using my indicator "Yo Show Me Some Support - and Resistances". Pun intended.
Thank you for reading.
Namasté 🙏
What Indicators Do I Use:
In the chart I am using my "Supertrend Ninja indicator", which is a trend-following indicator (Green and red vertical line with arrows).
When the background of the candlestick closes green (vertical line) with an upwards pointing pink arrow. It indicates a possible bullish (up)trend.
With each trade proper risk management is essential. Either by using my script "Trailing Stoploss Bottom Activation indicator", visible as grey dots below the candles. Which sends an alert, when current price goes below the previous candle low. Or using my "Heikin Ashi Trailing Stoploss Activation", the indicator below with green and red blocks. Or third option, exit when the Supertrend Ninja indicator displays a vertical red line with a downwards pointing black arrow. Remember, the first stop(loss) is always the cheapest stop.
Disclaimer: Ideas are for entertainment purposes only. Not financial advice. Your own due diligence is highly advised before entering trades. Past performance is no guarantee of future returns.
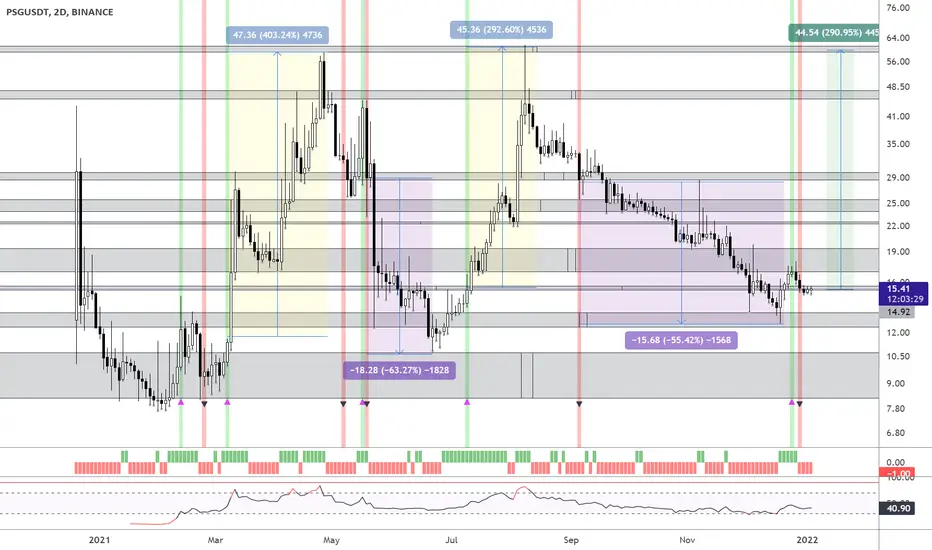
UPDATE: PSG UP 404% after bull signal - Another 291% to come? 🚀Please Like or Follow if you enjoyed this content.
UPDATE: My "Supertrend Ninja" indicator predicted two life changing pumps in March (403%) and July (293%) 2021. It also predicted two big drops (in purple) of -63% and -56%.
Currently the price is finding resistance from the previously starting point of the big bull run of July 2021. Getting back to previously two all time highs, means a whopping potential of 291% gain. The "Supertrend Ninja" hasn't turned green as of yet. But it's only a matter of time. Then again a small drop to 13.40 USDT before another bull run, would not surprise me either. I like this one a lot. The risk to reward for this one is very favorable.
Supports and Resistances are highlighted as grey blocks. Profits can be taken at each grey block. Supports and resistances are automatically drawn using my indicator "Yo Show Me Some Support - and Resistances". Pun intended.
Thank you for reading.
Namasté 🙏
What Indicators Do I Use:
In the chart I am using my "Supertrend Ninja indicator", which is a trend-following indicator (Green and red vertical line with arrows).
When the background of the candlestick closes green (vertical line) with an upwards pointing pink arrow. It indicates a possible bullish (up)trend.
With each trade proper risk management is essential. Either by using my script "Trailing Stoploss Bottom Activation indicator", visible as grey dots below the candles. Which sends an alert, when current price goes below the previous candle low. Or using my "Heikin Ashi Trailing Stoploss Activation", the indicator below with green and red blocks. Or third option, exit when the Supertrend Ninja indicator displays a vertical red line with a downwards pointing black arrow. Remember, the first stop(loss) is always the cheapest stop.
Disclaimer: Ideas are for entertainment purposes only. Not financial advice. Your own due diligence is highly advised before entering trades. Past performance is no guarantee of future returns.
Twitter
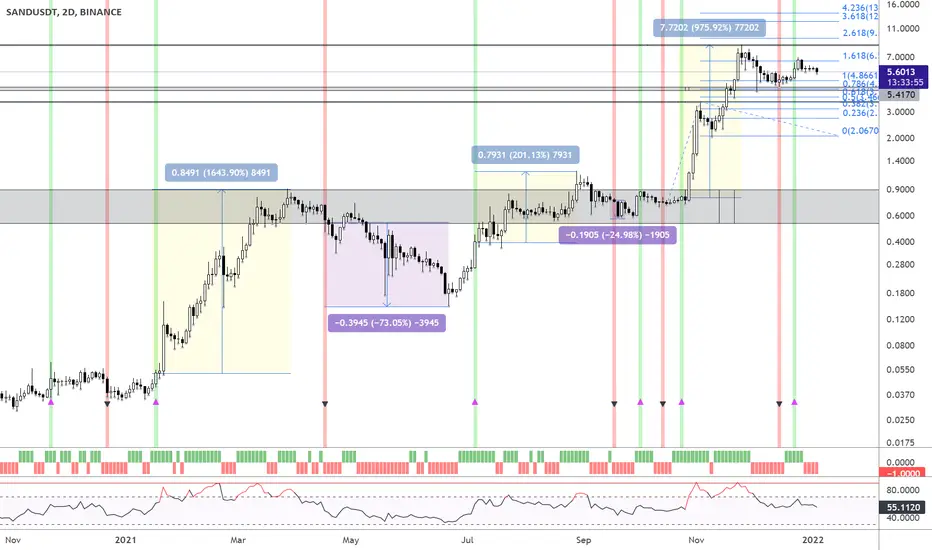
UPDATE: SAND UP 1644% after bull signal - What Next?Please Like or Follow if you enjoyed this content.
UPDATE: The price went sideways for a while before the big pump in Jan. Making a whopping 1644+% after the bullish "Supertrend Ninja" signal in Jan 2021. That's a life changing trade for many people.The second signal went 201%. While the fourth gave another 976%. It also predicted two big drops (in purple) of -73% and -25%.
Currently the price seems to be in a range. Which is visible in the RSI as well. Another drop here before making a bull run, or continue moving sideways in this range wouldn't surprise me as well. Generally the "Supertrend Ninja" gives around 2-8 bullish signals a year. Take profit levels are shown in blue using Fibs.
Supports and Resistances are highlighted as grey blocks. Profits can be taken at each grey block. Supports and resistances are automatically drawn using the indicator "Yo Show Me Some Support - and Resistances". Pun intended.
Thank you for reading.
Namasté 🙏
What Indicators Do I Use:
In the chart I am using my "Supertrend Ninja indicator", which is a trend-following indicator (Green and red vertical line with arrows).
When the background of the candlestick closes green (vertical line) with an upwards pointing pink arrow. It indicates a possible bullish (up)trend.
With each trade proper risk management is essential. Either by using my script "Trailing Stoploss Bottom Activation indicator", visible as grey dots below the candles. Which sends an alert, when current price goes below the previous candle low. Or using my "Heikin Ashi Trailing Stoploss Activation", the indicator below with green and red blocks. Or third option, exit when the Supertrend Ninja indicator displays a vertical red line with a downwards pointing black arrow. Remember, the first stop(loss) is always the cheapest stop.
Disclaimer: Ideas are for entertainment purposes only. Not financial advice. Your own due diligence is highly advised before entering trades. Past performance is no guarantee of future returns.
Twitter
UPDATE: TESLA UP 286% after bull signal - 70% more to come?Please Like or Follow if you enjoyed this content.
UPDATE: The price jumped 286+% after the bullish Supertrend Ninja signal in April 2020. With the latest being 85% in Aug 2021. The Supertrend Ninja also predicted some heavy drops (see purple price ranges).
A few days ago my indicator Supertrend Ninja gave another bullish signal. Using Fibs price might go up as high as 1850 USDT at 1.618 fib. Which is a potential gain of 70%. Right now the price is in the middle of two grey blocks. Price is still on the positive side of the Ichimoku. Heikin Ashi is bullish as well. Are we ready for some new all time highs? I know Elon is.
Supports and Resistances are highlighted as grey blocks. Profits can be taken at each grey block. Supports and resistances are drawn using the indicator 'Yo Show Me Some Support - and Resistances'. Pun intended.
Thank you for reading.
Namasté 🙏
What Indicators Do I Use:
In the chart I am using my Supertrend Ninja indicator, which is a trend-following indicator (Green and red vertical line with arrows).
When the background of the candlestick closes green (vertical line) with an upwards pointing pink arrow. It indicates a possible bullish (up)trend.
With each trade proper risk management is essential. Either by using my script Trailing Stoploss Bottom Activation indicator, visible as grey dots below the candles. Which sends an alert, when current price goes below the previous candle low. Or using my Heikin Ashi Trailing Stoploss Activation, the indicator below with green and red blocks. Or third option, exit when the Supertrend Ninja indicator displays a vertical red line with a downwards pointing black arrow. Remember, the first stop(loss) is always the cheapest stop.
Disclaimer: Ideas are for entertainment purposes only. Not financial advice. Your own due diligence is highly advised before entering trades. Past performance is no guarantee of future returns.

UPDATE: ATOM UP 367% after bull signal - What Next?Please Like or Follow if you enjoyed this content.
UPDATE: The price jumped 367+% after the bullish Supertrend Ninja signal in Jan 2021. And 262% in Aug 2021. The Supertrend Ninja also predicted the heavy Covid drop of 75% in Febr 2020. Big drops of May 2021 and Nov 2021.
On Christmas ATOM got another bullish signal of the Supertrend Ninja. First it started with a correction, falling exactly on the support level on 26.60 USDT. Where it bounced back up. Right now it's finding resistance from an orderblock. Get pas this, we will find resistance around 43.40 USDT.
Supports and Resistances are highlighted as grey blocks. Profits can be taken at each grey block. Supports and resistances are drawn using the indicator 'Yo Show Me Some Support - and Resistances'. Pun intended.
Thank you for reading.
Namasté 🙏
What Indicators Do I Use:
In the chart I am using the Supertrend Ninja indicator, which is a trend-following indicator (Green and red vertical line with arrows).
When the background of the candlestick closes green (vertical line) with an upwards pointing pink arrow. It indicates a possible bullish (up)trend.
With each trade proper risk management is essential. Either by using my script Trailing Stoploss Bottom Activation indicator, visible as grey dots below the candles. Which sends an alert, when current price goes below the previous candle low. Or using my Heikin Ashi Trailing Stoploss Activation, the indicator below with green and red blocks. Or third option, exit when the Supertrend Ninja indicator displays a vertical red line with a downwards pointing black arrow. Remember, the first stop(loss) is always the cheapest stop.
Disclaimer : Ideas are for entertainment purposes only. Not financial advice. Your own due diligence is highly advised before entering trades. Past performance is no guarantee of future returns.

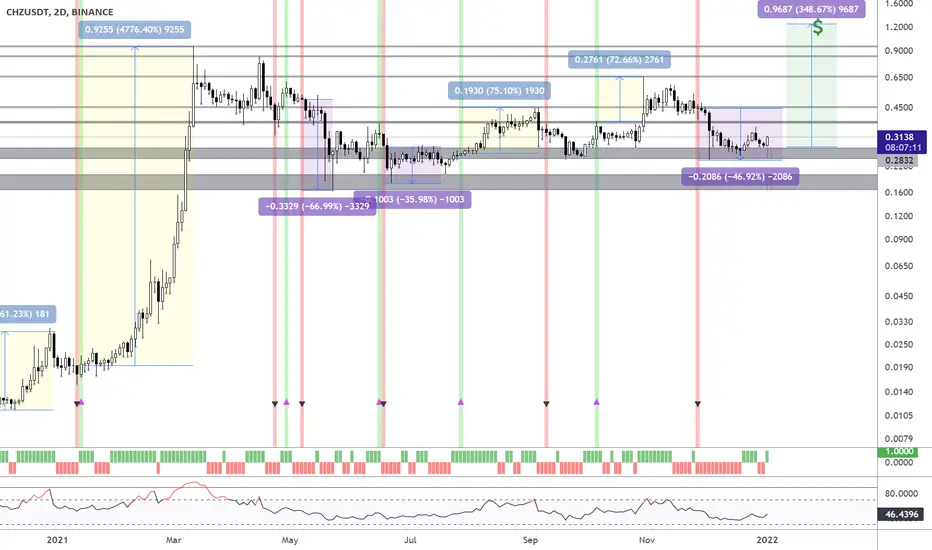
UPDATE: CHZ UP 4777% after bull signal - 350% more to come?Please Like or Follow if you enjoyed this content.
UPDATE: The price jumped 4777+% after the bullish Supertrend Ninja signal. The Supertrend Ninja also predicted the big Covid drop of 64% in March 2020. Drops of May 2021, June 2021 and Nov 2021. If this is the bottom, CHZ can go another 350% in the next bull run, till USD Dollar sign on the chart, around 1.20 USDT. Although the Supertrend Ninja hasn't given a bull signal as of yet.
It's only a matter of time. Nothing keeps going down forever. Be patient.
Supports and Resistances are highlighted as grey blocks. Next resistance around 0.37 USDT. If we break down here, next support is around 0.20 USDT. Profits can be taken at each grey block. Supports and resistances are drawn using the indicator 'Yo Show Me Some Support - and Resistances'. Pun intended.
In the chart I am using the Supertrend Ninja indicator, which is a trend-following indicator (Green and red vertical line with arrows).
When the background of the candlestick closes green (vertical line) with an upwards pointing pink arrow. It indicates a possible bullish (up)trend.
With each trade proper risk management is essential. Either by using my script Trailing Stoploss Bottom Activation indicator, visible as grey dots below the candles. Which sends an alert, when current price goes below the previous candle low. Or using my Heikin Ashi Trailing Stoploss Activation, the indicator below with green and red blocks. Or third option, exit when the Supertrend Ninja indicator displays a vertical red line with a downwards pointing black arrow. Remember, the first stop(loss) is always the cheapest stop.
Thank you for reading.
Namasté
Disclaimer: Ideas are for entertainment purposes only. Not financial advice. Your own due diligence is highly advised before entering trades. Past performance is no guarantee of future returns.
UPDATE: DOT UP 700% after bull signal - 300% more to come?Please Like or Follow if you enjoyed this content.
UPDATE: The price jumped 700+% after the bullish Supertrend Ninja signal. The Supertrend Ninja also predicted the drops of April 2021, May 2021 and Nov 2021. Using fibs. Price can go at least another 300% up, if this is the bottom. Although the Supertrend Ninja hasn't given a bull signal as of yet.
Supports and Resistances are highlighted as grey blocks. Next resistance around 39 USDT. Profits can be taken at each grey block. Supports and resistances are drawn using the indicator 'Yo Show Me Some Support - and Resistances'. Pun intended.
In the chart I am using the Supertrend Ninja indicator, which is a trend-following indicator (Green and red vertical line with arrows).
When the background of the candlestick closes green (vertical line) with an upwards pointing pink arrow. It indicates a possible bullish (up)trend.
With each trade proper risk management is essential. Either by using my script Trailing Stoploss Bottom Activation indicator, visible as grey dots below the candles. Which sends an alert, when current price goes below the previous candle low. Or using my Heikin Ashi Trailing Stoploss Activation, the indicator below with green and red blocks. Or third option, exit when the Supertrend Ninja indicator displays a vertical red line with a downwards pointing black arrow. Remember, the first stop(loss) is always the cheapest stop.
Thank you for reading.
Namasté
Disclaimer: Ideas are for entertainment purposes only. Not financial advice. Your own due diligence is highly advised before entering trades. Past performance is no guarantee of future returns.

UPDATE: Unicorn UP 908% after bull signal - now 25% correction?Please Like or Follow if you enjoyed this content.
UPDATE: The price jumped 908+% after the bullish Supertrend Ninja signal. Second 49% and third time 61%. The Supertrend Ninja predicted the drops of May 2021, July 2021 and Nov 2021. And is giving another potential drop signal 2 days ago.
Supports and Resistances are highlighted as grey blocks. Next support around 14 USDT. Which means a potential drop of 25%. Profits can be taken at each grey block (if shorting). Supports and resistances are drawn using the indicator 'Yo Show Me Some Support - and Resistances'. Pun intended.
In the chart I am using the Supertrend Ninja indicator, which is a trend-following indicator (Green and red vertical line with arrows).
When the background of the candlestick closes green (vertical line) with an upwards pointing pink arrow. It indicates a possible bullish (up)trend.
With each trade proper risk management is essential. Either by using my script Trailing Stoploss Bottom Activation indicator, visible as grey dots below the candles. Which sends an alert, when current price goes below the previous candle low. Or using my Heikin Ashi Trailing Stoploss Activation, the indicator below with green and red blocks. Or third option, exit when the Supertrend Ninja indicator displays a vertical red line with a downwards pointing black arrow. Remember, the first stop(loss) is always the cheapest stop.
Thank you for reading.
Namasté
Disclaimer: Ideas are for entertainment purposes only. Not financial advice. Your own due diligence is highly advised before entering trades. Past performance is no guarantee of future returns.

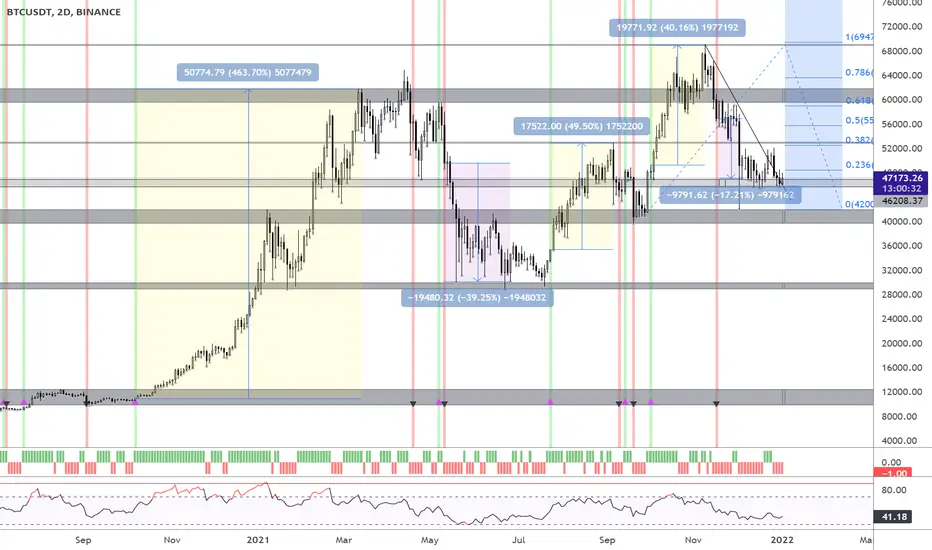
UPDATE: BITCOIN UP 464% after bull signal - 140% more to come?Please Like or Follow if you enjoyed this content.
UPDATE: The price jumped 464+% after the bullish Supertrend Ninja signal. Using fibs, are we in for another 140%? Target at 114000 USDT, if this is the bottom. If we break down here, 42000 USDT is next support. The Supertrend Ninja predicted the drops of March 2020. May 2021 and Nov 2021. RSI is in a accumulation zone though.
2022 hasn't shown a bullish signal yet for the Supertrend Ninja. Only a matter of time. Supports and Resistances are highlighted as grey blocks. Profits can be taken at each grey block.
In the chart I am using the Supertrend Ninja indicator, which is a trend-following indicator (Green and red vertical line with arrows).
When the background of the candlestick closes green (vertical line) with an upwards pointing pink arrow. It indicates a possible bullish (up)trend.
With each trade proper risk management is essential. Either by using my script Trailing Stoploss Bottom Activation indicator, visible as grey dots below the candles. Which sends an alert, when current price goes below the previous candle low. Or using my Heikin Ashi Trailing Stoploss Activation, the indicator below with green and red blocks. Or third option, exit when the Supertrend Ninja indicator displays a vertical red line with a downwards pointing black arrow. Remember, the first stop(loss) is always the cheapest stop.
Thank you for reading.
Namasté
Disclaimer: Ideas are for entertainment purposes only. Not financial advice. Your own due diligence is highly advised before entering trades. Past performance is no guarantee of future returns.
UPDATE: ETH UP 436% after bullish signal - 220% more to come?Please Like or Follow if you enjoyed this content.
UPDATE: The price jumped 436+% after the bullish Supertrend Ninja signal. Second time 134%. Third time 80%. Using fibs, are we in for another 220%? Target at 11300 USDT, if this is the bottom.
2022 hasn't shown a bullish signal yet for the Supertrend Ninja. Only a matter of time. Supports and Resistances are highlighted as grey blocks. Profits can be taken at each grey block.
In the chart I am using the Supertrend Ninja indicator, which is a trend-following indicator (Green and red vertical line with arrows).
When the background of the candlestick closes green (vertical line) with an upwards pointing pink arrow. It indicates a possible bullish (up)trend.
With each trade proper risk management is essential. Either by using my script Trailing Stoploss Bottom Activation indicator, visible as grey dots below the candles. Which sends an alert, when current price goes below the previous candle low. Or using my Heikin Ashi Trailing Stoploss Activation, the indicator below with green and red blocks. Or third option, exit when the Supertrend Ninja indicator displays a vertical red line with a downwards pointing black arrow. Remember, the first stop(loss) is always the cheapest stop.
Thank you for reading.
Namasté
Disclaimer: Ideas are for entertainment purposes only. Not financial advice. Your own due diligence is highly advised before entering trades. Past performance is no guarantee of future returns.

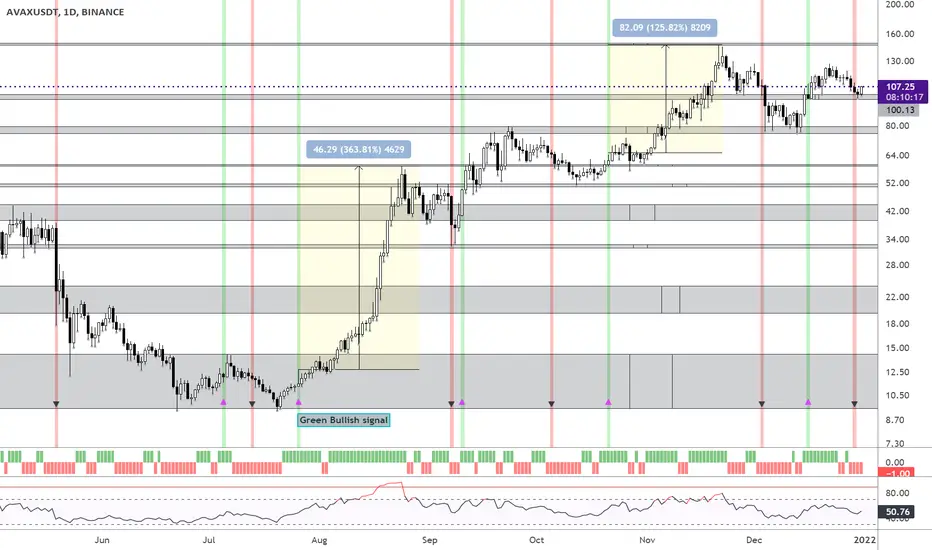
UPDATE: AVAX UP 364% after bullish signal Please Like or Follow if you enjoyed this content.
UPDATE: The price jumped 364+% after the bullish Supertrend Ninja signal. And the third time 126%. Supports and Resistances are highlighted as grey blocks. Profits can be taken at each grey block.
In the chart I am using the Supertrend Ninja indicator, which is a trend-following indicator (Green and red vertical line with arrows).
When the background of the candlestick closes green (vertical line) with an upwards pointing pink arrow. It indicates a possible bullish (up)trend.
With each trade proper risk management is essential. Either by using my script Trailing Stoploss Bottom Activation indicator, visible as grey dots below the candles. Which sends an alert, when current price goes below the previous candle low. Or using my Heikin Ashi Trailing Stoploss Activation, the indicator below with green and red blocks. Or third option, exit when the Supertrend Ninja indicator displays a vertical red line with a downwards pointing black arrow. Remember, the first stop(loss) is always the cheapest stop.
Thank you for reading.
Namasté
Disclaimer: Ideas are for entertainment purposes only. Not financial advice. Your own due diligence is highly advised before entering trades. Past performance is no guarantee of future returns.
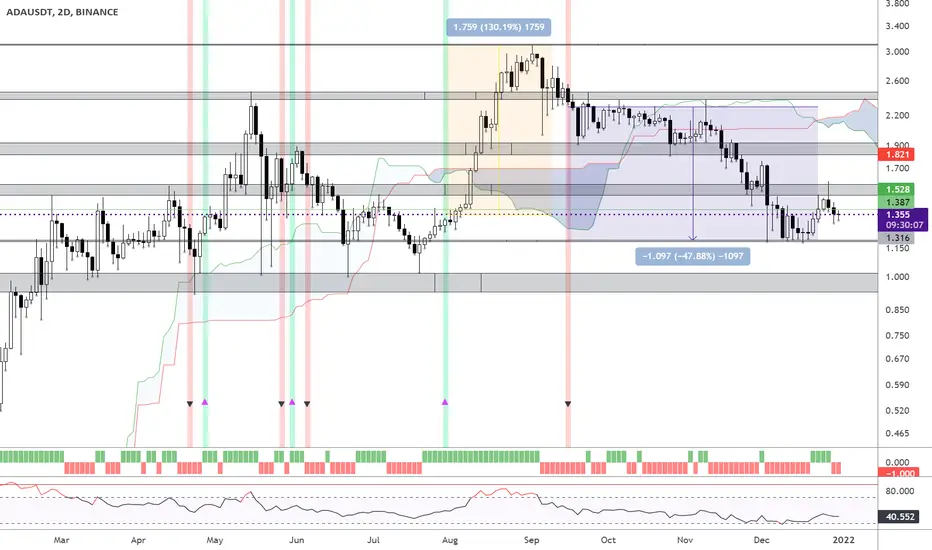
UPDATE: ADA UP 130% after bullish signal Please Like or Follow if you enjoyed this content.
UPDATE: The price jumped 130+% after bullish Supertrend Ninja signal. After the bearish signal (ideal for shorts), the price went down 48%. The RSI is slightly above 40. Which indicates we are still in a bearish (down) trend or sideways range. Supports and Resistances are highlighted as grey blocks.
In the chart I am using the Supertrend Ninja indicator, which is a trend-following indicator (Green and red vertical line with arrows).
When the background of the candlestick closes green (vertical line) with an upwards pointing pink arrow. It indicates a possible bullish (up)trend.
With each trade proper risk management is essential. Either by using my script Trailing Stoploss Bottom Activation indicator, visible as grey dots below the candles. Which sends an alert, when current price goes below the previous candle low. Or using my Heikin Ashi Trailing Stoploss Activation, the indicator below with green and red blocks. Or third option, exit when the Supertrend Ninja indicator displays a vertical red line with a downwards pointing black arrow. Remember, the first stop(loss) is always the cheapest stop.
Thank you for reading.
Namasté
Disclaimer: Ideas are for entertainment purposes only. Not financial advice. Your own due diligence is highly advised before entering trades. Past performance is no guarantee of future returns.
UPDATE: LUNA UP 50% after bullish signal Please Like or Follow if you enjoyed this content.
UPDATE: The price jumped 50+% after bullish Supertrend Ninja signal. Combining this with the indicator Heikin Ashi Trailing Stoploss activition proves to be worth it again.
In the chart I am using the Supertrend Ninja indicator, which is a trend-following indicator (Green and red vertical line with arrows).
When the background of the candlestick closes green (vertical line) with an upwards pointing pink arrow. It indicates a possible bullish (up)trend.
With each trade proper risk management is essential. Either by using my script Trailing Stoploss Bottom Activation indicator, visible as grey dots below the candles. Which sends an alert, when current price goes below the previous candle low. Or using my Heikin Ashi Trailing Stoploss Activation, the indicator below with green and red blocks. Or third option, exit when the Supertrend Ninja indicator displays a vertical red line with a downwards pointing black arrow. Remember, the first stop(loss) is always the cheapest stop.
Thank you for reading.
Namasté
Disclaimer: Ideas are for entertainment purposes only. Not financial advice. Your own due diligence is highly advised before entering trades. Past performance is no guarantee of future returns.

UPDATE: FTM UP 43% after bullish signal Please Like or Follow if you enjoyed this content.
UPDATE: The price jumped 43+% after bullish Supertrend Ninja signal. Finding resistance from the Ichimoku Cloud.
In the chart I am using the Supertrend Ninja indicator, which is a trend-following indicator (Green and red vertical line with arrows).
When the background of the candlestick closes green (vertical line) with an upwards pointing pink arrow. It indicates a possible bullish (up)trend.
With each trade proper risk management is essential. Either by using my script Trailing Stoploss Bottom Activation indicator, visible as grey dots below the candles. Which sends an alert, when current price goes below the previous candle low. Or using my Heikin Ashi Trailing Stoploss Activation, the indicator below with green and red blocks. Or third option, exit when the Supertrend Ninja indicator displays a vertical red line with a downwards pointing black arrow. Remember, the first stop(loss) is always the cheapest stop.
Thank you for reading.
Namasté
Disclaimer: Ideas are for entertainment purposes only. Not financial advice. Your own due diligence is highly advised before entering trades. Past performance is no guarantee of future returns.
