ABB @ 27 DEC 2021Text me if you have any questions/comments for me.
-----
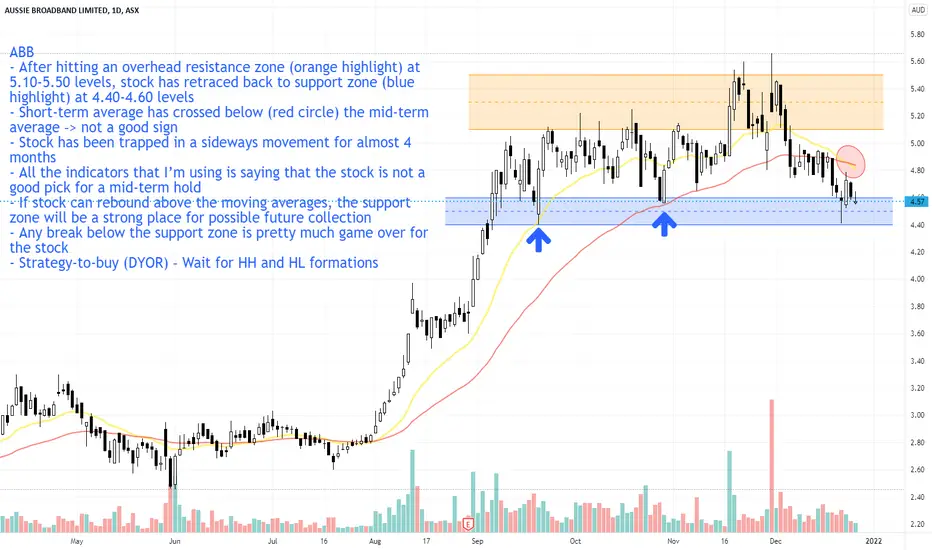
ABB
- After hitting an overhead resistance zone (orange highlight) at 5.10-5.50 levels, stock has retraced back to support zone (blue highlight) at 4.40-4.60 levels
- Short-term average has crossed below (red circle) the mid-term average –> not a good sign
- Stock has been trapped in a sideways movement for almost 4 months
- All the indicators that I’m using is saying that the stock is not a good pick for a mid-term hold
- If stock can rebound above the moving averages, the support zone will be a strong place for possible future collection
- Any break below the support zone is pretty much game over for the stock
- Strategy-to-buy (DYOR) – Wait for HH and HL formations
Trendfollowing
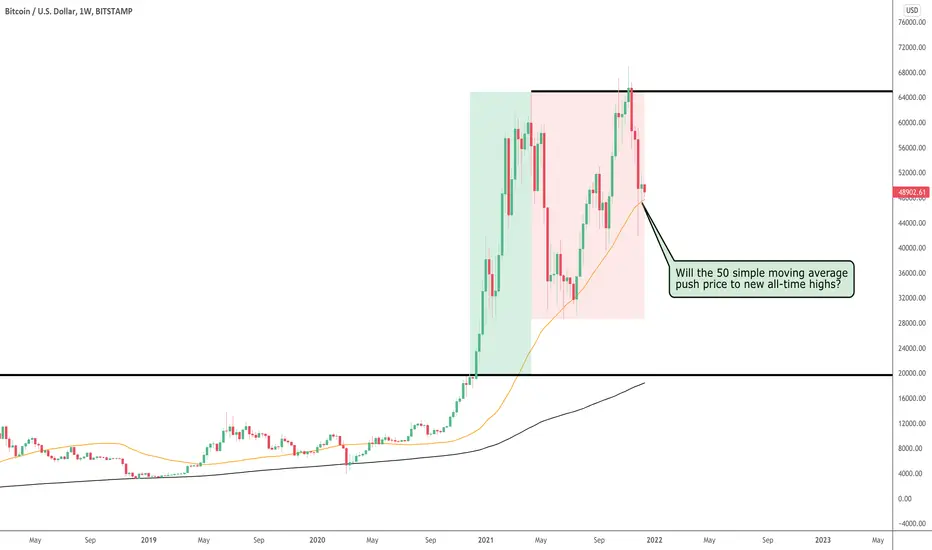
Bitcoin Set For A Late Christmas Rally?April 2021 saw price decline 51% from a high of just under $65k to a low
of $30k, where the 50 simple moving average was used as support.
There was a reversal back to the upside after hitting this indicator and
price went back towards $65k, even exceeding the high from April.
In November, price fell again and came back to the 50 simple moving average,
and so far this week, price is starting to reverse back to the upside again.
There is a clear pattern where the resistance remains around $65k and the
lows are getting higher and supported by the weekly 50 simple moving average.
If history repeats itself, then we should see another attempt at $65k, and we
may even see price continue much further past this level.
Let’s see what happens as we go ino into the new year and see if the buyers
can build enough bullish momentum to make price form another trend.
See below for more information on our trading techniques.
As always, keep it simple, keep it Sublime.
S&P 500 Christmas Breakout?The S&P is moving along well but is also encountering a few stumbling
blocks along the way.
In September and October 2021, price went into consolidation, which
was due for that time of the year, and a breakout followed this.
The start of November saw the beginning of another period of consolidation,
which price currently remains in.
Price has attempted to break out on several occasions and most recently
was the last trading day before Christmas.
When the market reopens following Christmas, we may see price remain
in consolidation or a breakout finally.
What is clear is that the overall trend remains bullish, so we are anticipating
a breakout to the upside, but let price dictate the next move.
See below for more information on our trading techniques.
As always, keep it simple, keep it Sublime.
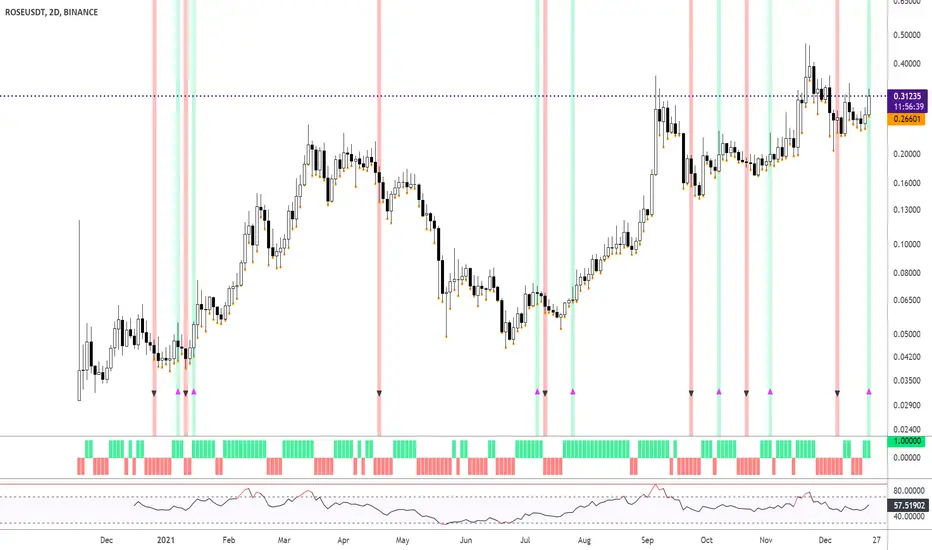
ROSE/USDT starting to look bullish.Please LIKE or FOLLOW if you like this idea.
RSI is moving towards 60, which is a bullish signal. The Heikin Ashi indicator is also showing green blocks (indicator below). Which also confirms we're in a possible uptrend.
In the chart I am using the Supertrend Ninja indicator, which is a trend-following indicator (Green and red vertical line with arrows).
When the background of the candlestick closes green (vertical line) with an upwards pointing pink arrow. It indicates a possible bullish (up)trend.
The Supertrend Ninja indicator is forming its 7th bullish signal in 2021.
With each trade proper risk management is essential. Either by using my script Trailing Stoploss Bottom Activation indicator, visible as orange dots below the candles. Which sends an alert, when current price goes below the previous candle low. Or using my Heikin Ashi Trailing Stoploss Activation, the indicator below with green and red blocks. Or third option, exit when the Supertrend Ninja indicator displays a vertical red line with a downwards pointing black arrow. Remember, the first stop(loss) is always the cheapest stop.
Thank you for reading.
Namasté
Disclaimer: Ideas are for entertainment purposes only. Not financial advice. Your own due diligence is highly advised before entering trades. Past performance is no guarantee of future returns.
Analysis ATOM/USDT on 2Days chartPlease LIKE or FOLLOW if you like this idea.
RSI is above 50, which indicates a possible upmarket. The Heikin Ashi indicator is also showing green blocks (indicator below). Which also confirms we're most likely looking at a possible uptrend.
In the chart I am using the Supertrend Ninja indicator, which is a trend-following indicator (Green and red vertical line with arrows).
When the background of the candlestick closes green (vertical line) with an upwards pointing pink arrow. It indicates a possible bullish (up)trend.
The Supertrend Ninja indicator is forming its 7th bullish signal in 2021.
Supports and resistances are displayed in grey. With price finding support.
With each trade proper risk management is essential. Either by using my script Trailing Stoploss Bottom Activation indicator, visible as orange dots below the candles. Which sends an alert, when current price goes below the previous candle low. Or using my Heikin Ashi Trailing Stoploss Activation, the indicator below with green and red blocks. Or third option, exit when the Supertrend Ninja indicator displays a vertical red line with a downwards pointing black arrow. Remember, the first stop(loss) is always the cheapest stop.
Thank you for reading.
Namasté
Disclaimer: Ideas are for entertainment purposes only. Not financial advice. Your own due diligence is highly advised before entering trades. Past performance is no guarantee of future returns.

Analysis VET/USDT on Daily chartRSI is slowly moving towards 50, which indicates a possible upmarket. The Heikin Ashi indicator is also showing green blocks (indicator below). Which also confirms we're most likely looking at a possible uptrend.
In the chart I am using the Supertrend Ninja indicator, which is a trend-following indicator (Green and red vertical line with arrows).
When the background of the candlestick closes green (vertical line) with an upwards pointing pink arrow. It indicates a possible bullish (up)trend.
The Supertrend Ninja indicator is forming its 9th bullish signal for the 1 day chart in 2021. Six out of 9 signals, the price indeed went higher with a Monster Trend on March 2021.
Supports and resistances are displayed in grey. With below the price a strong support.
With each trade I make, proper risk management is essential. Either by using the Trailing Stoploss Bottom Activation indicator, visible as orange dots below the candles. Which sends an alert, when current price goes below the previous candle low. Or using the Heikin Ashi Trailing Stoploss Activation, the indicator below with green and red blocks. Or third option, exit when the Supertrend Ninja indicator displays a vertical red line with a downwards pointing black arrow. Remember, the first stop(loss) is always the cheapest stop.
Thank you for reading.
Namasté
Disclaimer: Ideas are for entertainment purposes only. Not financial advice. Your own due diligence is highly advised before entering trades.
Past performance is no guarantee of future returns.

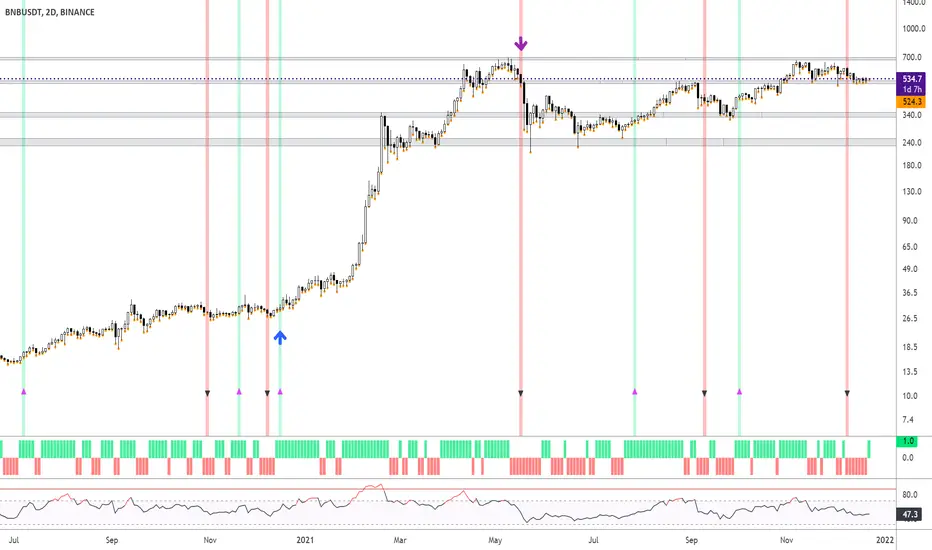
How to detect a trend and trail an uptrend? How do I detect an uptrend?
In the chart BNB/USDT I am using the Supertrend Ninja indicator, which is a trend-following indicator (Green and red vertical line with arrows).
When the background of the candlestick closes green with an upwards pointing pink arrow. It indicates a possible bullish (up)trend.
The Supertrend Ninja indicator gave only 6 bullish signals for the 2 day chart in 2021. And 2 bullish signal in 2020. Which in my opinion makes each bullish signal very reliable.
It warned about the March 2020 and May 2021 (possible) corrections (big purple down arrows). And also the big uptrend of Dec 2020 (big blue up arrow).
How do I trail an uptrend?
With each trade I make, proper risk management is essential. Either by using the Trailing Stoploss Bottom Activation indicator, visible as orange dots below the candles. Which sends an alert, when current price goes below the previous candle low. Or using the Heikin Ashi Trailing Stoploss Activation, the indicator below with green and red blocks. Remember, the first stop(loss) is always the cheapest stop. Using one of these, or both offers me the possibility to ride bigger parts of the trend. Whichever triggers an alert first.
(For completeness, the grey blocks are supports and resistances)
Thank you for reading.
Namasté
Disclaimer: Ideas are for entertainment purposes only. Not financial advice. Your own due diligence is highly advised before entering trades.
Past performance is no guarantee of future returns.
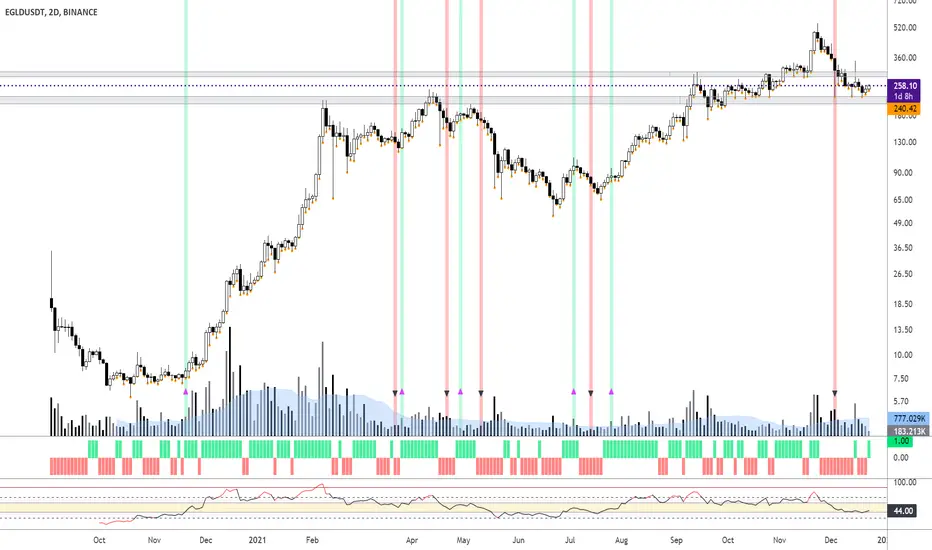
Analysis EGLD/USDT on 2Days chartI was asked to chart EGLD /USDT. And how the Supertrend Ninja indicator performed on it since the listing.
Currently price is bouncing between support and resistance (2 grey blocks). Which makes/made EGLD ideal for a gridbot.
RSI is slowly moving towards 44, which means it is still in a range (displayed in the RSI as a yellow block). Right now as things stand it's not so interesting for trend traders. On the other hand volume is going down, which means a big move is likely to happen very soon. Before making any trades. I'll be waiting for confirmation from the Supertrend Ninja indicator showing some bullishness first. Ideally I would like to see some more green blocks on the Heikin Ashi indicator below as well.
In the chart I am using the Supertrend Ninja indicator, which is a trend-following indicator (Green and red vertical line with arrows).
When the background of the candlestick closes green with an upwards pointing pink arrow. It indicates a possible bullish (up)trend.
The Supertrend Ninja indicator gave only 4 bullish signals for the 2 day chart in 2021. And 1 bullish signal in 2020. Which in my opinion makes each bullish signal very reliable.
With each trade I make, proper risk management is essential. Either by using the Trailing Stoploss Bottom Activation indicator, visible as orange dots below the candles. Which sends an alert, when current price goes below the previous candle low. Or using the Heikin Ashi Trailing Stoploss Activation, the indicator below with green and red blocks. Remember, the first stop(loss) is always the cheapest stop.
Thank you for reading.
Namasté
Disclaimer: Ideas are for entertainment purposes only. Not financial advice. Your own due diligence is highly advised before entering trades.
Past performance is no guarantee of future returns.
Analysis Doge/USDT on 2Days chartCurrently price is consolidating in support (pink block) right now. Ideally I would link to see price close above pink support first.
RSI is slowly moving towards 42, which means it is still in a range. Which could work for a grid bot. Not so good for trend traders. 'll be waiting for confirmation from the Supertrend Ninja indicator. And a close above pink support. Ideally I would like see some more green blocks on the Heikin Ashi indicator below as well. Before entering any trades. I have also drawn two grey resistance areas for the people interested.
In the chart I am using the Supertrend Ninja indicator, which is a trend-following indicator (Green and red vertical line with arrows).
When the background of the candlestick closes green with an upwards pointing pink arrow. It indicates a possible bullish (up)trend.
The Supertrend Ninja indicator gave only 3 bullish signals for the 2 day chart in 2021. And 4 bullish signals in 2020. Including two monstertrends (displayed with Purple dollar signs) triggered bij Elon Musks tweets. And a smaller third trend on 5th of July 2020 (pump of 86%). This indicator showed bullishness well before the tweets of Elon Musk. Which helped me a lot.
Thank you for reading.
Namasté
Disclaimer: Ideas are for entertainment purposes only. Not financial advice. Your own due diligence is highly advised before entering trades.
Past performance is no guarantee of future returns.

SHIB/USDT bounced on support. Bullish?In the chart I am using the Supertrend Ninja indicator, which is a trend-following indicator.
When the background of the candlestick closes green with an upwards pointing pink arrow. It indicates a possible bullish (up)trend. I expect a signal within few days.
Price bounced on support (grey block). Which is a good sign.
The Supertrend Ninja indicator gave only 3 bullish signals for the 2 day chart in 2021. Including the monstertrend on 30th Sept. Entering on the blue arrow, and exit on the red down arrow (using Trailing Stoploss Bottom Activation indicator) made a whopping 250%. The Trailing Stoploss Bottom Activation, visible as orange dots below the candles. Sends an alert, when current price goes below the previous candle low (red horizontal line). This stoploss sell alert (using Tradingview webhook) worked great in combination with a bot. This happened on 14th Oct.
Heikin Ashi is showing green blocks in the indicator below as well. Which means an uptrend is likely. Also RSI is slowly moving towards 50, which is a bullish signal. SHIB looks done correcting. I'll be waiting for confirmation from the Supertrend Ninja indicator. Before entering any trades.
Namasté
Disclaimer: Ideas are for entertainment purposes only. Not financial advice. Your own due diligence is highly advised before entering trades.
Past performance is no guarantee of future returns.

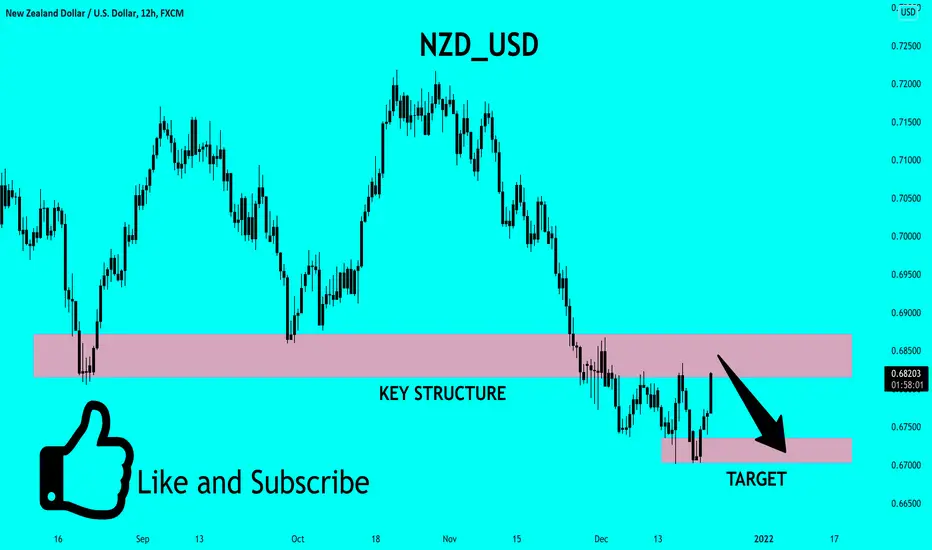
✅NZD_USD BEARISH SETUP|SHORT🔥
✅NZD_USD is going up locally and will
Soon retest a horizontal resistance level
And because the pair is in the downtrend
This presents a classical
Trend following selling opportunity
SHORT🔥
✅Like and subscribe to never miss a new idea!✅
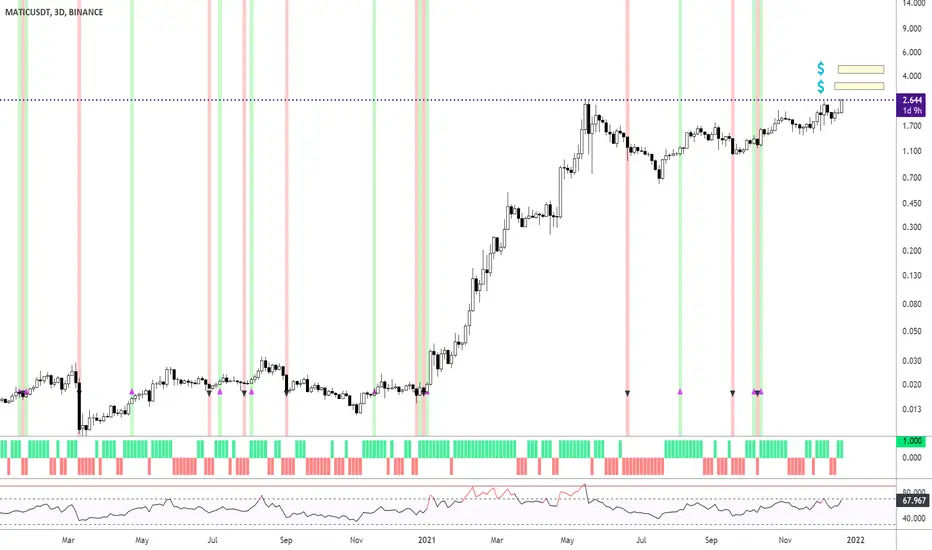
MATIC/USDT Uptrend Take Profit levels 🚀In the chart I am using the Supertrend Ninja indicator, which is a trend-following indicator.
Matic is currently facing resistance from the previous ATH. Break this and we gonna set ourselves some new ATH's. Which on midterm can go as high as 4.8 USDT.
My Take profit levels are in yellow blocks.
On 13th Oct, the background of the candlestick closed green with an upwards pointing pink arrow. Which indicated a possible bullish (up)trend. Since then the price has gone higher. Important detail. The Supertrend Ninja indicator gave only 4 bullish signals for the 3 day chart in 2021.
RSI is close to 70. Break RSI 70, and we might be at the beginning of a bigger uptrend. Heikin Ashi is showing the start of a bullish trend as well (indicator below in the form of green blocks). Do we need to buckle up are seatbelt?
Namasté
Disclaimer: Ideas are for entertainment purposes only. Not financial advice. Your own due diligence is highly advised before entering trades.
Past performance is no guarantee of future returns.
ONE/USDT starting to look bullish.In the chart I am using the Supertrend Ninja indicator, which is a trend-following indicator.
Today it's forming a bullish signal. With still 9 hours before candle close. If the background of the candlestick closes green with an upwards pointing pink arrow. It indicates a possible bullish (up)trend. Important detail. The Supertrend Ninja indicator is potentially forming its 7th bullish candle in 2021.
RSI is above 50. Heikin Ashi is showing a bullish trend as well (indicator below in the form of green blocks). Are we done with correcting? Are things heating up?
Namasté
Disclaimer: Ideas are for entertainment purposes only. Not financial advice. Your own due diligence is highly advised before entering trades.
Past performance is no guarantee of future returns.

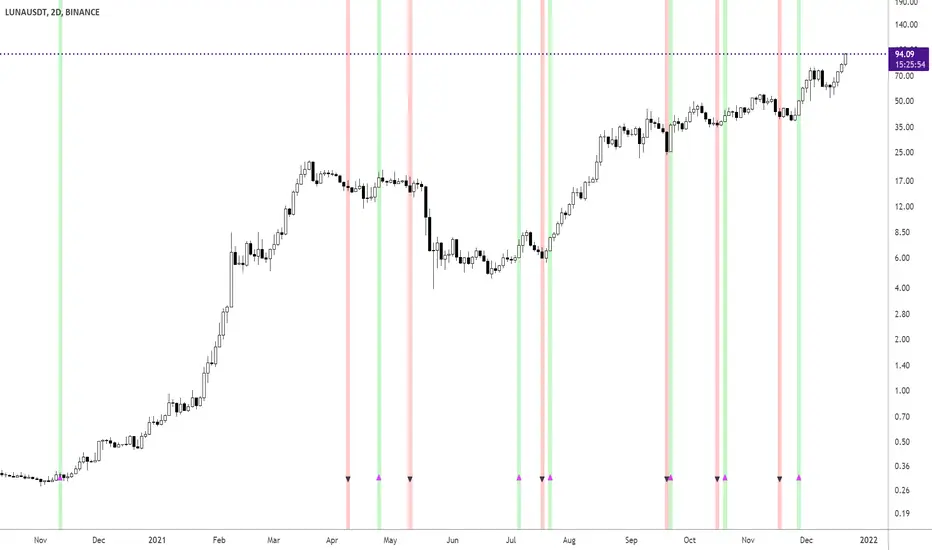
LUNA/USDT trending up higher since latest bullish signal 🚀In the chart I am using the Supertrend Ninja indicator, which is a trend-following indicator.
On 27th Nov, the background of the candlestick closed green with an upwards pointing pink arrow. Which indicated a possible bullish (up)trend. Since then the price has gone higher. Important detail. The Supertrend Ninja indicator gave only 6 bullish signals for the 2 day chart in 2021.
Namasté
Disclaimer: Ideas are for entertainment purposes only. Not financial advice. Your own due diligence is highly advised before entering trades.
Past performance is no guarantee of future returns.
AVAX/USDT gave a bullish signal 2 days ago. UpdateIn the chart I am using the Supertrend Ninja indicator, which is a trend-following indicator.
Two candlesticks before, the background of the candlestick closed green with an upwards pointing pink arrow. Which indicated a possible bullish (up)trend.
Since then the price has gone higher. Will it break ATH?
The Supertrend Ninja indicator gave only 6 bullish signals for the 2 day chart in 2021. And it formed its 7th 4 days ago.
Namasté
Disclaimer: Ideas are for entertainment purposes only. Not financial advice. Your own due diligence is highly advised before entering trades.
Past performance is no guarantee of future returns.

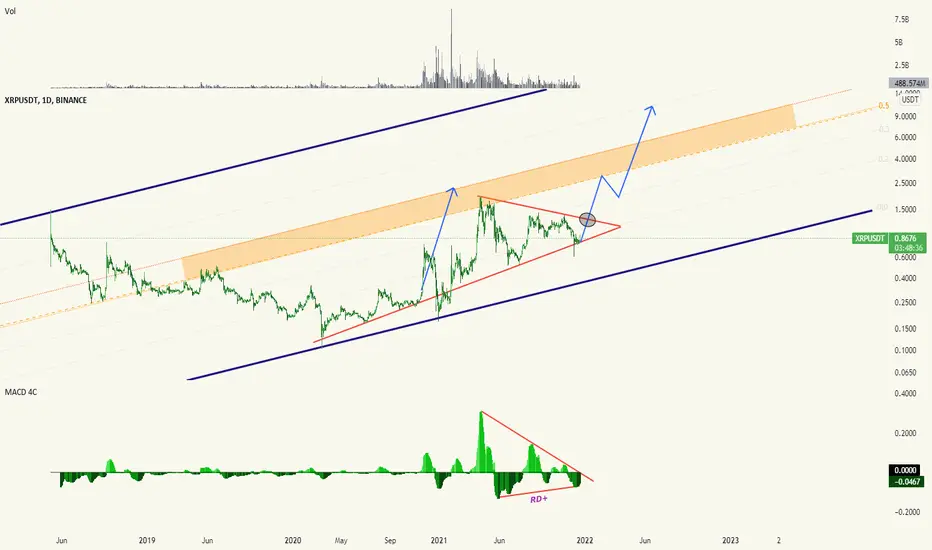
Does XRP dream of becoming doubledigits?Hello dear friends
Does xrp dream of becoming double digits?
Given the validity of the triangle floor support that has been preserved so far, probably yes
I think if the market does not fall sharply, this coin can move towards targets above $ 10 after breaking the downtrend line.
In the absence of BTC and market support and a sharp fall, the support of the triangle floor is very likely to break, and this analysis is invalid.
******Appropriate entry points for supports and resistances according to the chart*******
If you like this idea, Please Follow me and do not forget that your likes and comments are very very important .
Thank you dear friends.
Be generous and rich.
AVAX/USDT starting to look bullish. Time to long? In the chart I am using the Supertrend Ninja indicator, which is a trend-following indicator.
When the background of the candlestick closes green with an upwards pointing pink arrow. It indicates a possible bullish (up)trend. I want to see more confirmation of this possible trend before making an entry. To enter a trade placing an order a few ticks above the candle high would be sensible. The idea behind this, is that we only want to enter a trade when it has shown a trend continuation.
The Supertrend Ninja indicator gave only 6 bullish signals for the 2 day chart in 2021. And it's forming its 7th today. It still has over more than 1 day and 7 hours before candle close.
Is AVAX gonna be making a new ATH? I'll be watching AVAX like a hawk.
Namasté
Disclaimer: Ideas are for entertainment purposes only. Not financial advice. Your own due diligence is highly advised before entering trades.
Past performance is no guarantee of future returns.

Should We Be Sleeping On Bitcoin?Bitcoin appears to be sleeping right now, but should we be sleeping on Bitcoin
because when it is ready to take off, we will not be given much notice as we
have experienced in the past.
We should always keep an eye on the market and read the information that
price is providing for us. To the naked eye, Bitcoin does not look interesting
as we can see price has been stuck in a range between around $30,000 - $65,000.
We can also see that despite price being in a range and moving sideways, price is
creating higher lows and being helped on by the 50 simple moving average.
As the high has remained around the same level ($65,000), the higher lows should
eventually force price into a tight squeeze. What we can expect following a squeeze
is a strong breakout, either above $65,000 or below the 50 simple moving average.
The bias is for a breakout to the upside as price was bullish prior to consolidation.
If a breakout occurs, we can expect a strong move in this crypto.
This is why we do not want to be sleeping on Bitcoin and other assets from any
market that is behaving similar.
As for now, patience is required and attention to detail because most of the
information we need is provided by price.
See below for more information on our trading techniques.
As always, keep it simple, keep it Sublime.
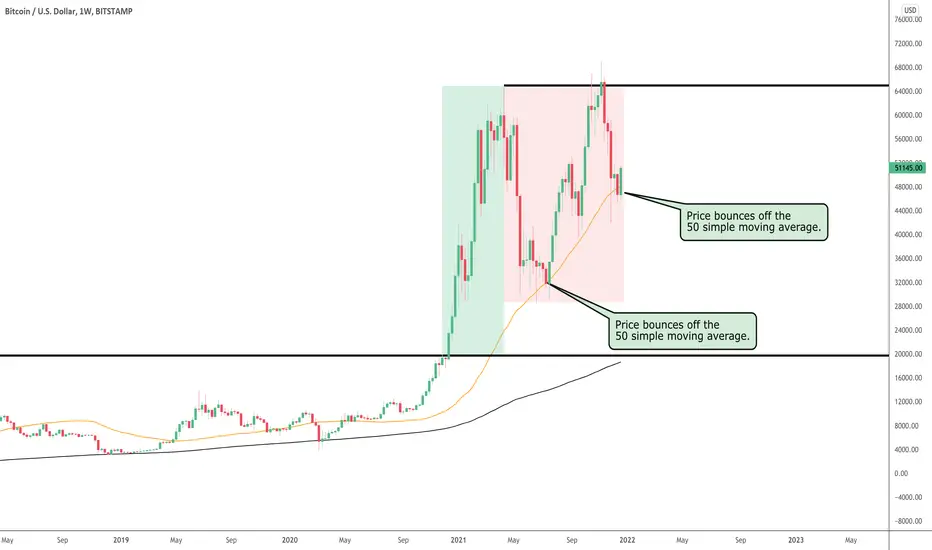
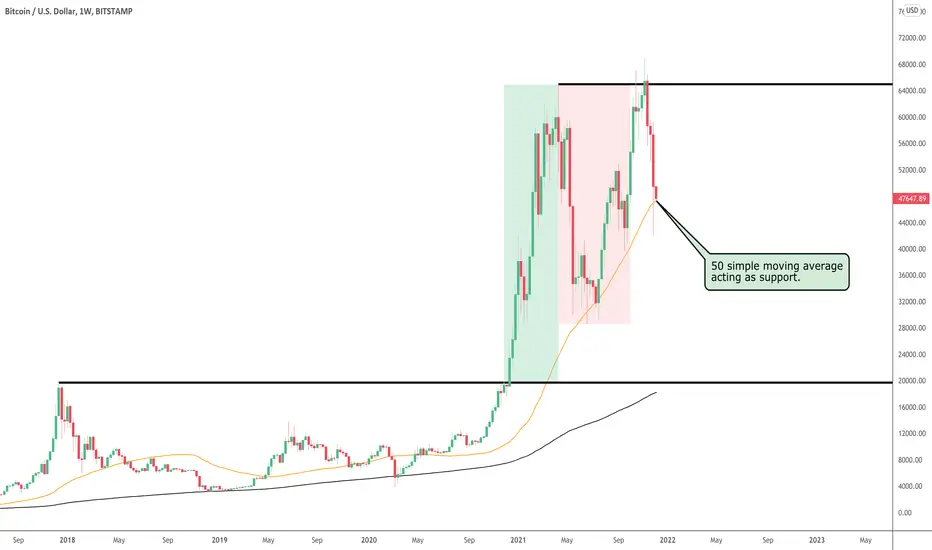
Bitcoin Consolidates - Rally Pending?Bitcoin has not made much progress since the decline from April 2021. Price suddenly
fell 56% over the course of a few weeks to the weekly 50 simple moving average,
which at the time was around the $30,000 round number.
Following the bounce in July 2021, price headed back to the high from April and
made contact in October 2021, where it failed to break and stay above the April
high at $64,895.
Another attempt was made in November 2021, making it slightly higher but failed
as well and price has now come back to the 50 simple moving average.
This indicator has held as support in the past and is currently holding price up.
Time will tell if it holds strong again. As for now, we just have to wait patiently,
and if this coin can find strength, we should see a bullish rally in the overall
crypto market.
When price consolidates, standing aside is the best course of action.
See below for more information on our trading techniques.
As always, keep it simple, keep it Sublime.
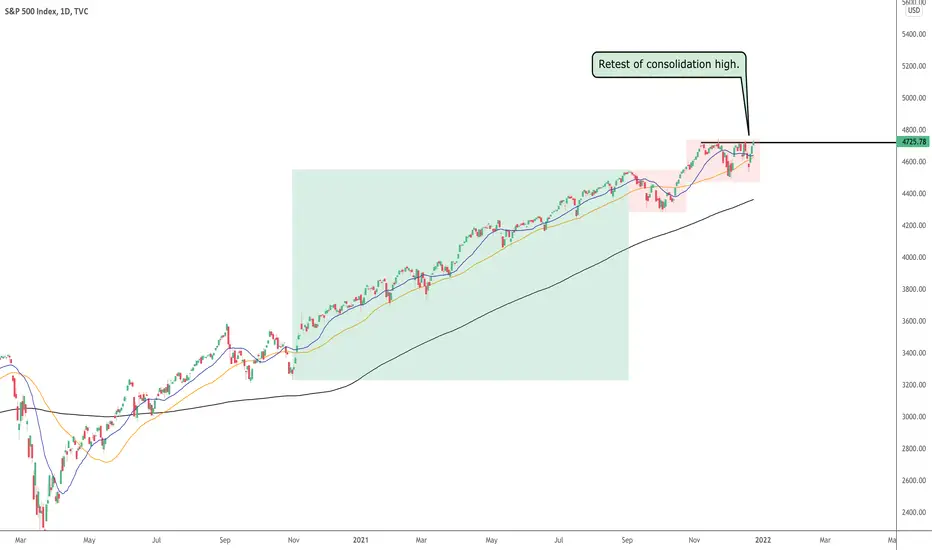
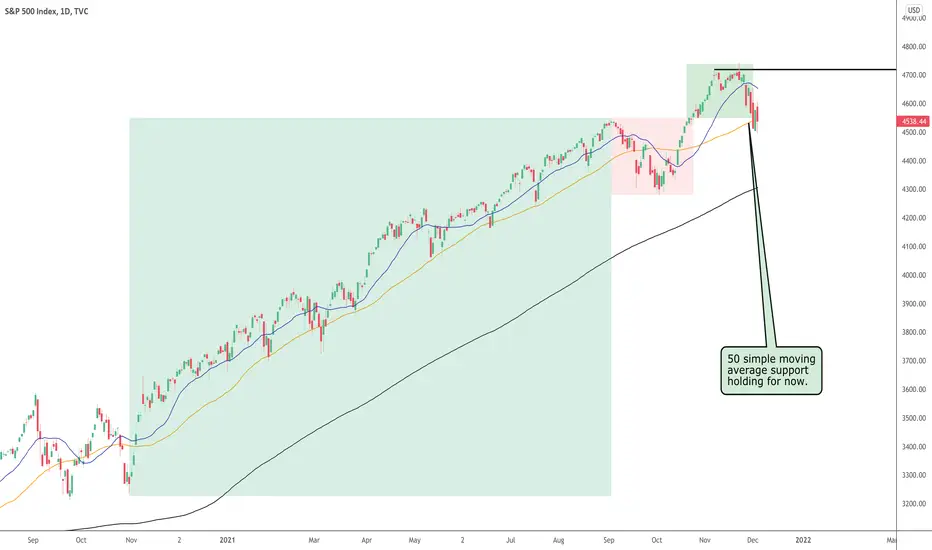
S&P 500 Falls To Next Support Level!The current pullback we are experiencing in the S&P 500 is almost as deep
as the pullback in September, having declined 5.11% so far.
At the moment, the 50 simple moving average is holding as support. If this
level fails, then we have the 200 simple moving average below, but price
will have to decline a further 5% to reach it.
A decline that far will see lots of profit given back to the market, but we
should see a resumption of the overall bull trend over the long term.
The main thing to consider is that the overall trend from March 2020 is still
bullish and creating higher highs and higher lows.
Once price breaks and closes above the recent high from November 22nd
at $4743, we anticipate a move towards the $5000 round number.
See below for more information on our trading techniques.
As always, keep it simple, keep it Sublime.
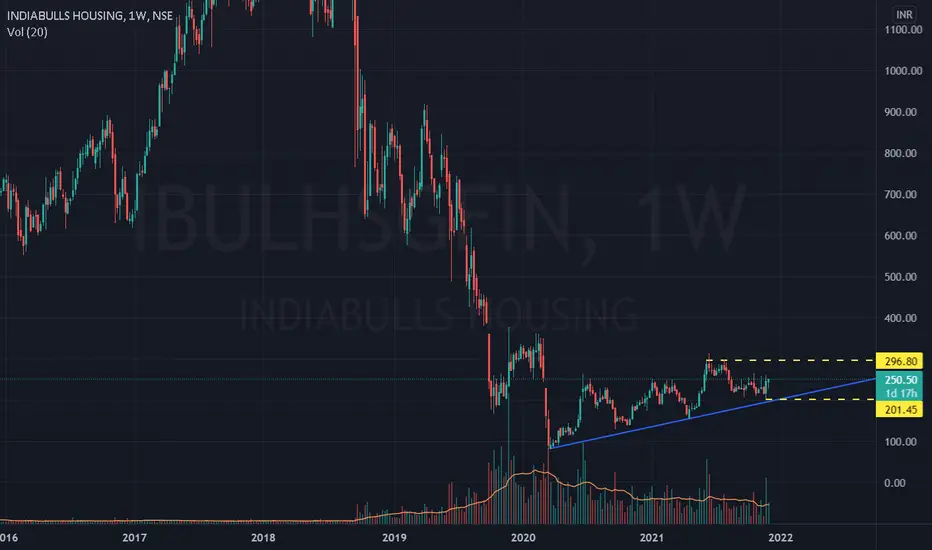
#IBULHSGFIN Looks bullish from current levels of 250 #IBULHSGFIN Looks bullish from current levels of 250 for target of 300 SL at 200.
ASX 200 @ 1 Dec 2021Text me if you have any questions/comments for me.
-----
In the last Market Watch analysis done on 2 November (red dash line), I wrote that I would avoid the big caps (eg. Blue Chips, ASX 200 constituents) while being more selective with my purchases. Since then, the ASX 200 tested and failed to break the 7450 resistance and is now falling towards the strong support zone near 7200 levels (orange line).
The ASX 200 previously rebounded from this support zone and another rebound would be good. The index is also testing the long-term average. Judging by its historical performance, I can’t say that the long-term average is a very strong support.
Since 1 Dec 2017 (blue dash line), the ASX 200 has only rebounded of the long-term support 2 times (blue arrows). The red arrows were when the index was rejected by the long-term average. This does show that the index does at least respond to long-term average – albeit not often as a support.
The red thumbs downs were periods when the index just fell through the long-term support. My huge concern is whether the ASX 200 will fall below the 7200-support zone. If it breaks this support, the overall market will likely be in a world of pain for at least a few weeks.
The US market hasn’t really shown convincing signs of a strong rebound. If a strong retracement takes place over the coming days in the US, I have a strong feeling that the ASX 200 will fall off the support that it is sitting on. Our best-case scenario is that the US creates a new all-time high in the next couple of weeks and the ASX 200 will take the hint and slowly rebound again.
With the integrity of our politicians being called into question and the federal election happening in less than 6 months, the markets will continue to be in state of flux. Rising inflation and potential Omicron scares will continue to disrupt the economic recovery.
In last Saturday’s FB livestream, I explained around the 17-minute mark how the US and Australia markets’ movements is signalling that there is a lack of confidence in the ASX market. Personally, I have reduced my trading portfolio from 6-8 stocks down to 3 stocks. I’m increasingly being more selective in my purchases as sometimes, doing nothing in the market is a form of capital preservation.
How about you? Are you optimistic or pessimistic on the ASX market over the coming 6 months? Are you aggressively buying now or waiting for stronger rebounds or retracements?

Markets on the brink and NQ analasis. thoughts from your favorite Irish sister and brother:
We might be going to a true bear market soon. Our algo is showing more activity in the bear settings. The more volatility setting and shorter times frame are strong profits, while less volatility longer times frame still show profits though less than was. In next week we will know more data about whether moving to bear or remain bull. but right here we hedge about 1/3. Our algo predict last bear market in 2020 March.
Yesterday our trade hit NQ targets on the bollocks (see link below). Today we have new bull/bear line in yellow at 16311. Yesterday we break out of downwedge to now open up wedge maybe meaning more volatility.
if yellow line holds as support with retest go long for the 3 targets for profit shown
If yellow line breaks and holds for resistance go short for the 3 targets for profit shown.
happy trading to all. and please be kind to each other
Love from sister and brother Bunny.
