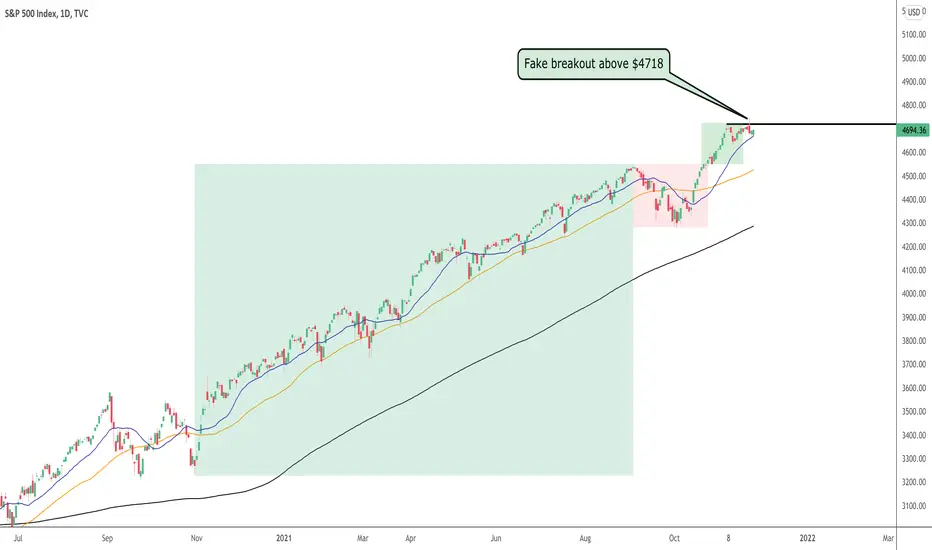
S&P 500 Fake Breakout!Last week's previous post for the S&P 500, the all-time high at $4718 was highlighted
as the level we want to see broken to confirm a trend continuation.
Price did in fact break this level on November 22nd, but this proved to be a fake
breakout. Price moved above $4718 but failed to close above this price.
We can see a mini consolidation in play now, and just below we have the
20 simple moving average.
The 20sma appears to be holding price up for now and providing a level of
support. We now want this to be followed by a bounce and another attempt
at the $4718 resistance level.
As a new high was created during the fake breakout, we now need to see
a break and close above $4743 to confirm a trend continuation.
The overall trend remains bullish, so we are anticipating a breakout to
the upside sooner or later.
See below for more information on our trading techniques.
As always, keep it simple, keep it Sublime.
Trendfollowing
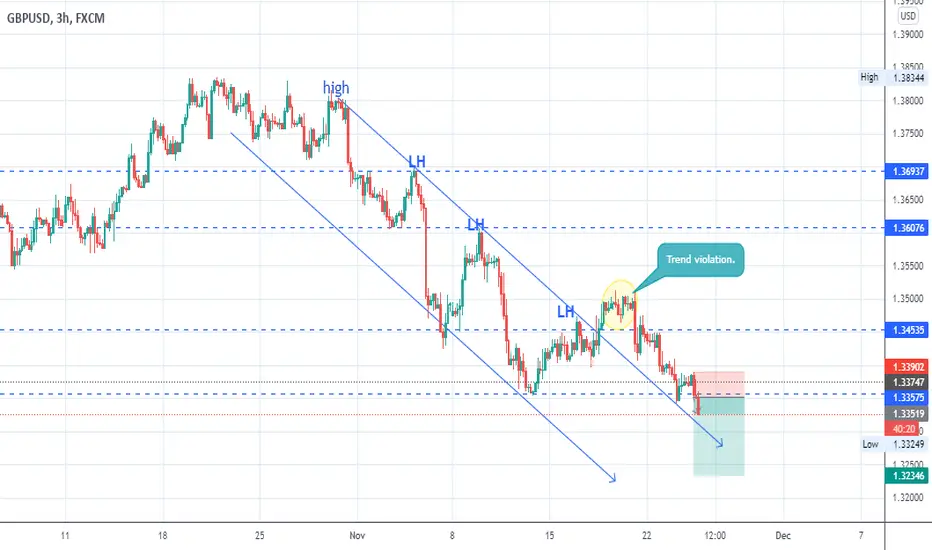
GBPUSD LOOKING FOR STOP HUNTS?I always advice traders to either trade the trend, or enter a counter trend entry only when a common chart pattern is forming such as the double-bottom or top, head and shoulders so that you may be confident in your entry.
This trade setup suggests that we are simply moving with the downtrend, since there is no sign of trend reversal as yet.
DISCLAIMER: Trading involves risks, and this setup does not constitute trading advice enter at your own risk!!!!!!!!!!!!!
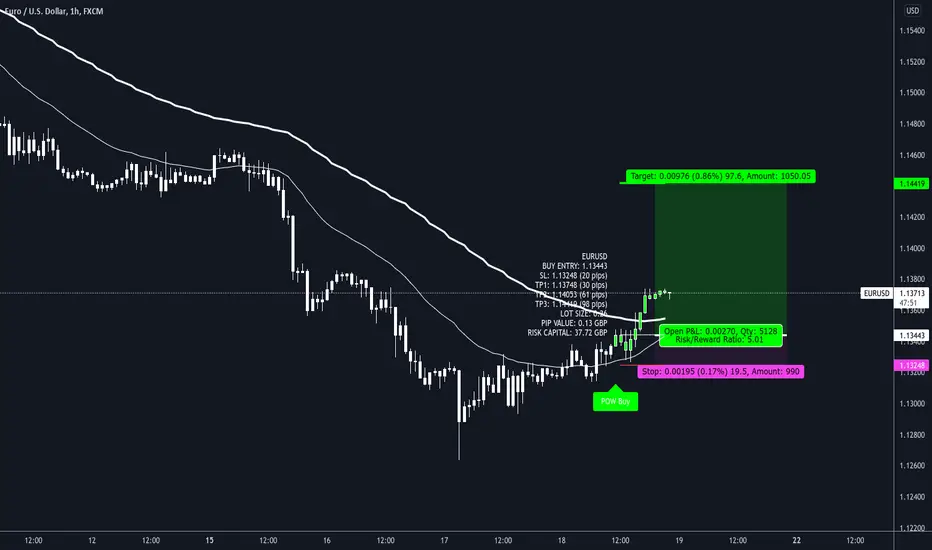
EURUSD long so far so good 📈👀As stated in my last idea I'm ending today sharing some trades I still have running.
We are using our trend following EDGE strategy for this trade.
Entry details are shown on the chart trade.
Trade has been live since 12:00 UK time,
Working the H1 time frame here and we're only looking for TP3 looking for a 98 pip move to hit that target.
This is a 1:5 RR strategy so natuallry the win rate is lower than some other ideas I post on my page.
Win rate isn't everything in trading and despite the 28% win rate this strategy has as you will see it still makes profit.
1% risked each time but 5% gained on the trades that win see this strategy still return profit.
The trade history can be seen at the foot of this trade idea too for full transparency.
In that box every trade is logged and can be viewed by clicking the tabs in the report box.
You as the viewer of this idea can also do that so go ahead and have a play.
------------------------------------------
I try and share as many ideas as I can as and when I have time. My trades are automated so I am not sat in front of a screen daily.
Jumping on random trade ideas 'willy-nilly' on Trading View trying to find that one trade that you can retire from is not a sustainable way to trade. You might get lucky, but it will always end one way.
------------------------------------------
Please hit the 👍 LIKE button if you like my ideas🙏
Also follow my profile, then you will receive a notification whenever I post a trading idea - so you don't miss them. 🙌
No one likes missing out, do they?
Also, see my 'related ideas' below to see more just like this.
The stats for this pair are shown below too.
Thank you.
Darren.
XLM - Trend Following Buy Setup!Hello everyone, if you like the idea, do not forget to support with a like and follow.
XLM is overall bullish trading inside the blue channel and now approaching the lower blue trendline so we will be looking for trend-following buy setups on lower timeframes.
on H1: XLM is forming a trendline (in red) and an inverse head and shoulders pattern (in orange) but it is not valid yet, so we are waiting for a new swing high to form around it to consider it our trigger swing. (projection in purple)
Trigger => Waiting for that swing to form and then buy after a momentum candle close above it (gray zone)
Meanwhile, until the buy is activated, XLM would be overall bearish can still trade lower.
Good luck!
All Strategies Are Good; If Managed Properly!
~Rich

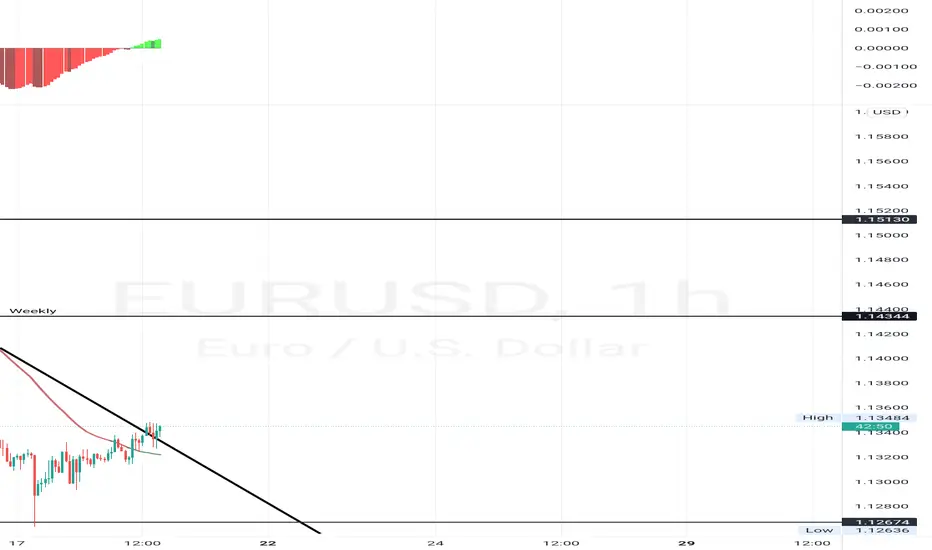
EURUSD LONG1. The price has broken out of descending trendline.
2.The SMA has turned green at the demand Zone.
3. Macd has crossed the zero line.
Stop Loss can be around 1.131000
Tp 1 _1.138861
Tp 2_1.143409
Tp 3_1.151000
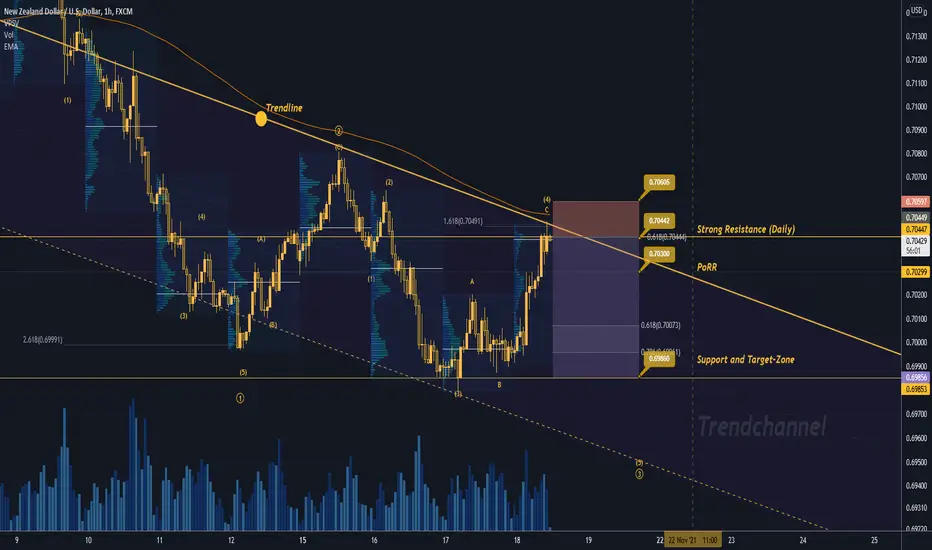
NZD/USD SELL IDEAHey tradomaniacs,
welcome to another free trading-setup!
NZD/USD:Daytrade-Preparation
Market-Sell: 0.70440
Stop-Loss: 0.70605
Point of Risk-Reduction: 0.70300
Take-Profit: 0.69860
Stop-Loss: 15 pips
Risk: 0,5% -1%
Risk-Reward: 4,0
LEAVE A LIKE AND A COMMENT - I appreciate every support! =)
Peace and good trades
Irasor
Wanna see more? Don`t forget to follow me
TLS @ 18 NOV 2021Text me if you have any questions/comments for me.
-----
TLS
- Previous analysis was done on 23 Sep (red arrow) - Suggested waiting for a successful breakout of $4 resistance before plotting entry
- Since then, the stock retraced back to re-test the 3.70 support levels and slowly rebounded
- Today, it successfully broke out with above average volume
- Next overhead resistance looks to be around 4.50 levels
- R is borderline 10%
- Strategy-to-buy (DYOR) – Suggest plotting entry if believe the stock can have a sustained breakout

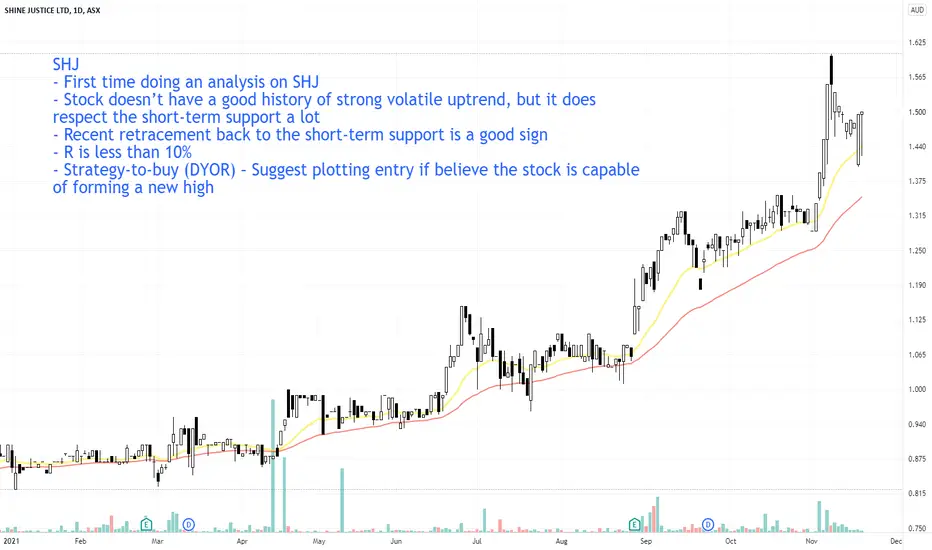
SHJ @ 18 NOV 2021Text me if you have any questions/comments for me.
-----
SHJ
- First time doing an analysis on SHJ
- Stock doesn’t have a good history of strong volatile uptrend, but it does respect the short-term support a lot
- Recent retracement back to the short-term support is a good sign
- R is less than 10%
- Strategy-to-buy (DYOR) – Suggest plotting entry if believe the stock is capable of forming a new high
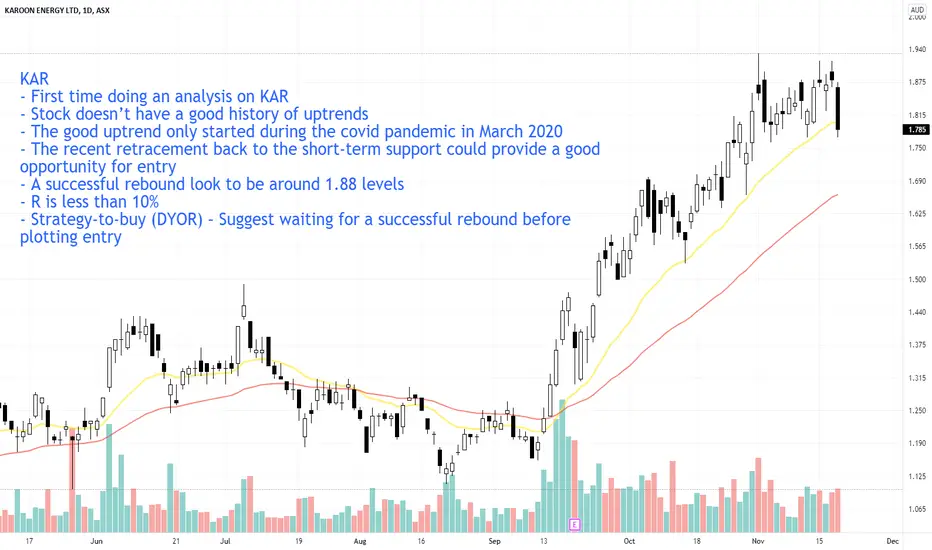
KAR @ 18 NOV 2021Text me if you have any questions/comments for me.
-----
KAR
- First time doing an analysis on KAR
- Stock doesn’t have a good history of uptrends
- The good uptrend only started during the covid pandemic in March 2020
- The recent retracement back to the short-term support could provide a good opportunity for entry
- A successful rebound look to be around 1.88 levels
- R is less than 10%
- Strategy-to-buy (DYOR) – Suggest waiting for a successful rebound before plotting entry
IMU @ 18 NOV 2021Text me if you have any questions/comments for me.
-----
IMU
- Previous analysis was done on 4 Oct (red arrow) – suggested waiting for a successful rebound around 47.5 cents before plotting entry
- Since then, the stock has created a new high, retraced, and looks to be rebounding off the short-term support
- If have taken the entry suggestion, you should be having roughly 19% gains in roughly 3 weeks
- A successful rebound look to be around 60 cents
- R is more than 10%
- Strategy-to-buy (DYOR) – Suggest waiting for a successful rebound before plotting entry

CMM @ 18 NOV 2021Text me if you have any questions/comments for me.
-----
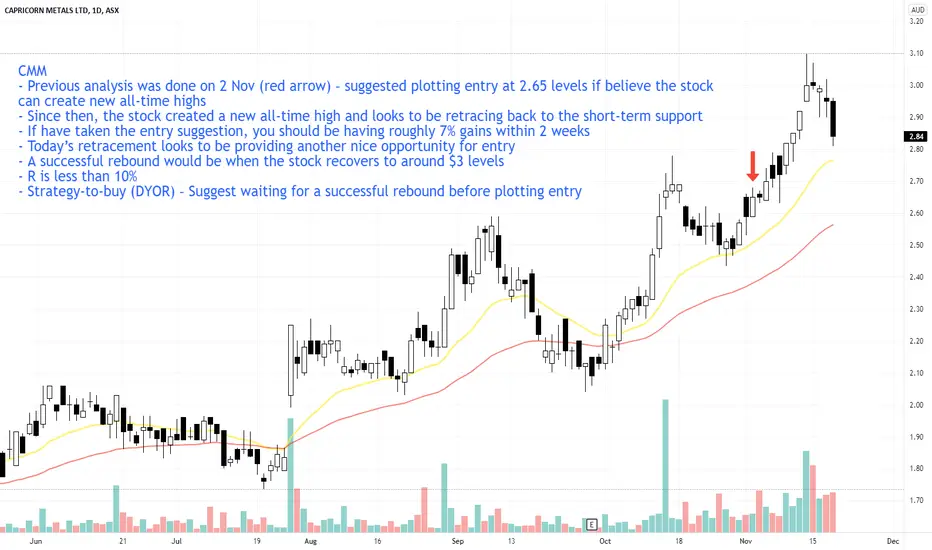
CMM
- Previous analysis was done on 2 Nov (red arrow) – suggested plotting entry at 2.65 levels if believe the stock can create new all-time highs
- Since then, the stock created a new all-time high and looks to be retracing back to the short-term support
- If have taken the entry suggestion, you should be having roughly 7% gains within 2 weeks
- Today’s retracement looks to be providing another nice opportunity for entry
- A successful rebound would be when the stock recovers to around $3 levels
- R is less than 10%
- Strategy-to-buy (DYOR) – Suggest waiting for a successful rebound before plotting entry
AZL @ 18 NOV 2021Text me if you have any questions/comments for me.
-----
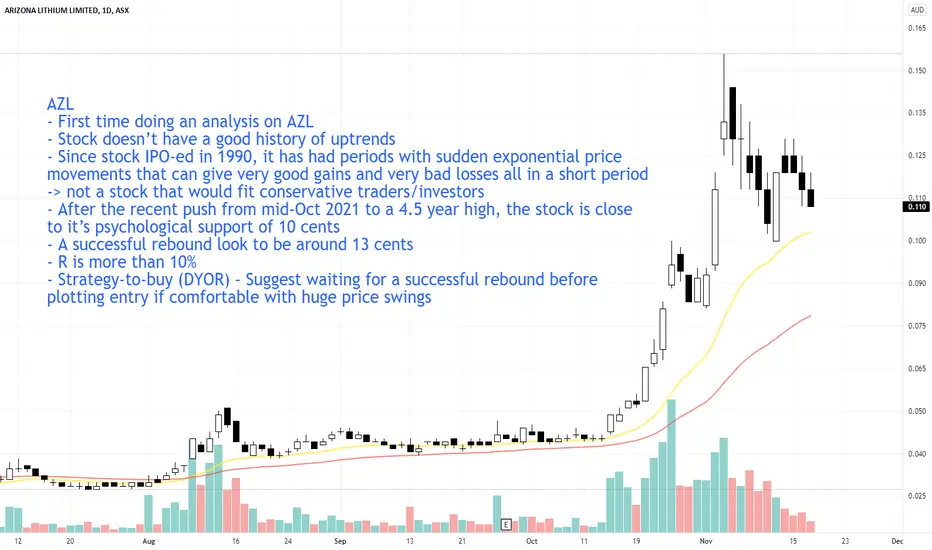
AZL
- First time doing an analysis on AZL
- Stock doesn’t have a good history of uptrends
- Since stock IPO-ed in 1990, it has had periods with sudden exponential price movements that can give very good gains and very bad losses all in a short period -> not a stock that would fit conservative traders/investors
- After the recent push from mid-Oct 2021 to a 4.5 year high, the stock is close to it’s psychological support of 10 cents
- A successful rebound look to be around 13 cents
- R is more than 10%
- Strategy-to-buy (DYOR) – Suggest waiting for a successful rebound before plotting entry if comfortable with huge price swings
AEF @ 18 NOV 2021Text me if you have any questions/comments for me.
-----
AEF
- First time doing an analysis on AEF
- Has a good history of strong uptrends
- Looks to have a strong support at the short-term average but occasionally retraces all the way back to the mid-term support
- Recent price action looks to be a sideways consolidation instead of a retracement
- Another test of the short-term support will be good
- Successful rebound looks to be around 14.50 levels
- R is less than 10%
- Strategy-to-buy (DYOR) – Suggest waiting for a successful rebound before plotting entry if believe the stock can create new all-time highs
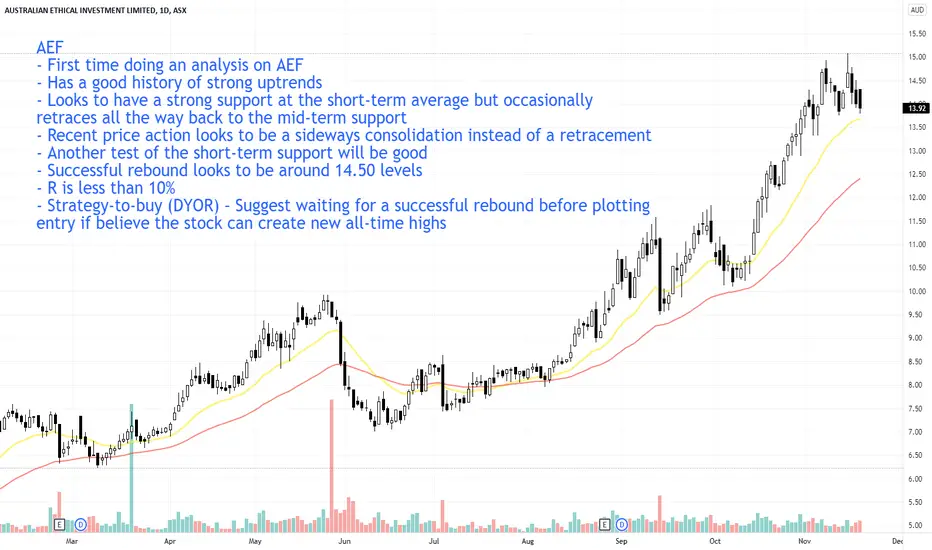
ABB @ 18 NOV 2021Text me if you have any questions/comments for me.
-----
ABB
- Previous analysis was done on 17 Nov (red arrow) – suggested waiting for a successful breakout above 5.30 levels before plotting entry if believe the stock can create new all-time highs
- Today’s price action is accompanied with above average volume is proving to be a successful breakout
- Price is now too far from the short-term support
- R is more than 10%
- Strategy-to-buy (DYOR) – Suggest waiting for a retracement and a successful rebound

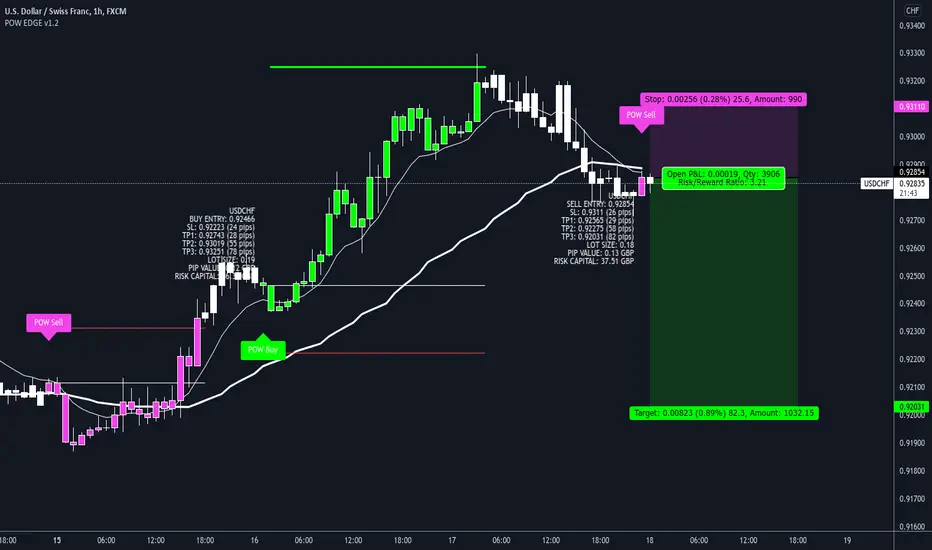
USDCHF short alerts for an overnight trade 🌃POW EDGE trend strategy in use for this USDCHF trade.
Entry details are shown on the chart.
Trade has been live since 23:00 UK time.
Working the H1 time frame here and we're only looking for TP3.
Previous trades can also be seen on chart.
A successful long and a short that hit SL.
As always the report box at foot of the idea shows the stats for this strategy.
In that box every trade is logged and can be viewed by clicking the tabs in the report box.
You as the viewer of this idea can also do that so go ahead and have a play.
------------------------------------------
I try and share as many ideas as I can as and when I have time. My trades are automated so I am not sat in front of a screen daily.
Jumping on random trade ideas 'willy-nilly' on Trading View trying to find that one trade that you can retire from is not a sustainable way to trade. You might get lucky, but it will always end one way.
------------------------------------------
Please hit the 👍 LIKE button if you like my ideas🙏
Also follow my profile, then you will receive a notification whenever I post a trading idea - so you don't miss them. 🙌
No one likes missing out, do they?
Also, see my 'related ideas' below to see more just like this.
The stats for this pair are shown below too.
Thank you.
Darren.
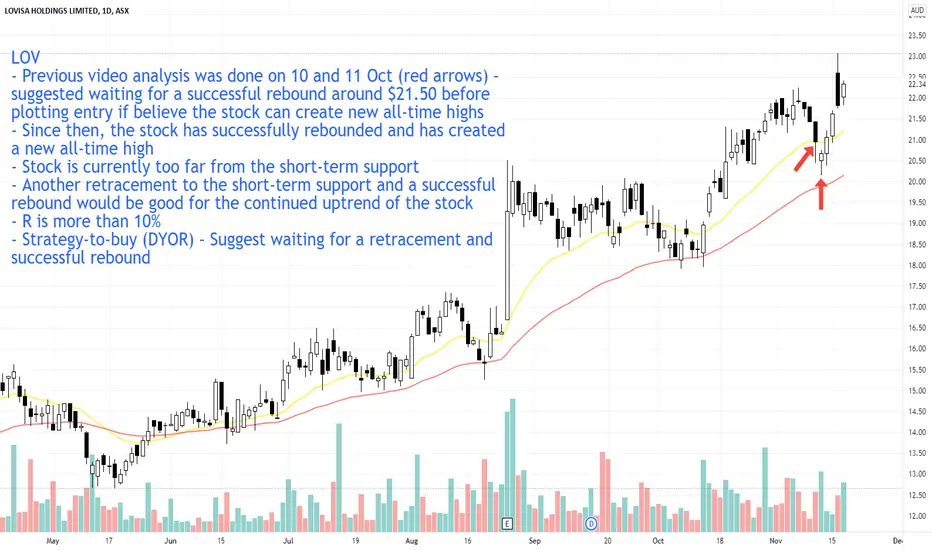
LOV @ 17 NOV 2021Text me if you have any questions/comments for me.
-----
LOV
- Previous video analysis was done on 10 and 11 Oct (red arrows) – suggested waiting for a successful rebound around $21.50 before plotting entry if believe the stock can create new all-time highs
- Since then, the stock has successfully rebounded and has created a new all-time high
- Stock is currently too far from the short-term support
- Another retracement to the short-term support and a successful rebound would be good for the continued uptrend of the stock
- R is more than 10%
- Strategy-to-buy (DYOR) – Suggest waiting for a retracement and successful rebound
IMD @ 17 NOV 2021Text me if you have any questions/comments for me.
-----
IMD
- Previous analysis was done on 9 Nov (red arrow) -> suggested waiting for a successful rebound at 2.90 before plotting entry if believe the stock can create new all-time highs
- Since then, the stock has rebounded and created a new all-time high on 15 Nov
- Today, stock has retraced back to the short-term support and a good rebound looks to be at 2.90 levels again
- R is borderline 10%
- Strategy-to-buy (DYOR) – Suggest waiting for a successful rebound before plotting entry if believe the stock can create new all-time highs

CBA @ 17 NOV 2021Text me if you have any questions/comments for me.
-----
CBA
- Previous video analysis was done on 13 Oct (red arrow) – suggested waiting for a successful rebound above $109 before plotting entry
- Today, the stock gapped down below the short- and mid-term supports
- It closed below the strong psychological support of $100
- Coincidentally, today is the 4th time the stock has gapped down back towards the $100 level -> I personally don’t think this is significant. Just that it’s curious coincidence
- A successful rebound look to be around $104 levels
- Strategy-to-buy (DYOR) – Suggest waiting for a series of HHs and HLs
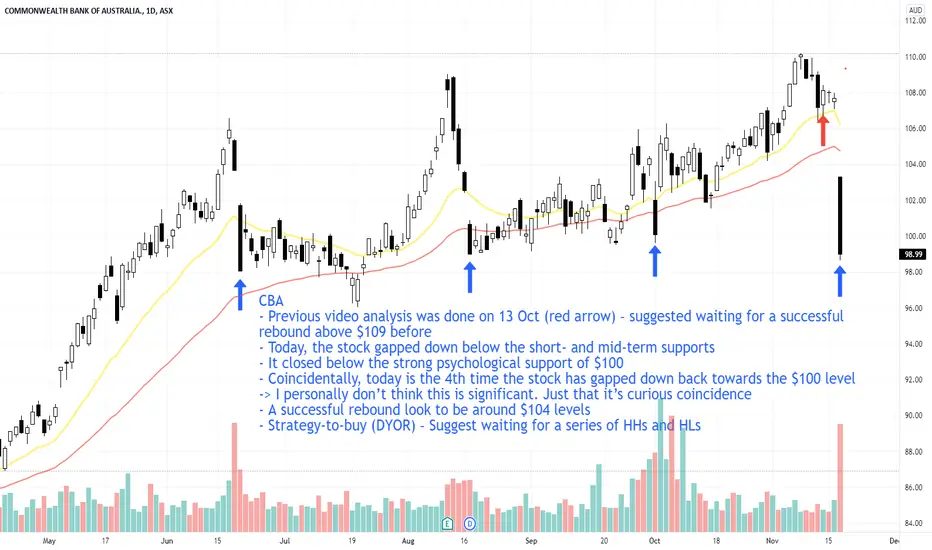
ABB @ 17 Nov 2021Text me if you have any questions/comments for me.
-----
ABB
- Previous analysis was done on 4 Oct (red arrow) – suggested waiting for a successful breakout and a better setup for entry
- Since then, the stock has consolidated sideways and today is breaking out with above average volume
- A successful breakout looks to be above 5.30
- Stock has a long history of sideways consolidation followed by strong breakouts
- R is borderline 10%
- Strategy-to-buy (DYOR) – Suggest plotting entry after a successful breakout if believe the stock is capable of creating new all-time highs

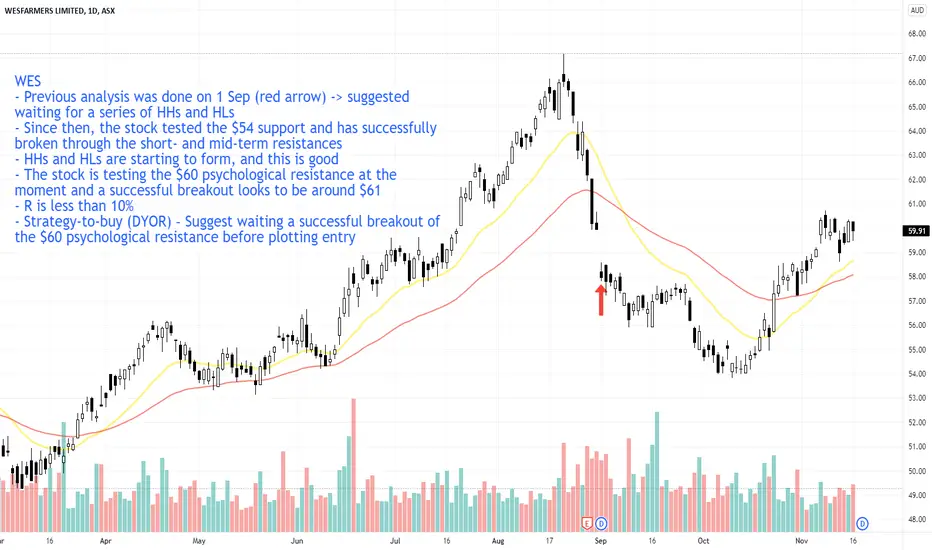
WES @ 16 NOV 2021Text me if you have any questions/comments for me.
-----
WES
- Previous analysis was done on 1 Sep (red arrow) -> suggested waiting for a series of HHs and HLs
- Since then, the stock tested the $54 support and has successfully broken through the short- and mid-term resistances
- HHs and HLs are starting to form, and this is good
- The stock is testing the $60 psychological resistance at the moment and a successful breakout looks to be around $61
- R is less than 10%
- Strategy-to-buy (DYOR) – Suggest waiting a successful breakout of the $60 psychological resistance before plotting entry
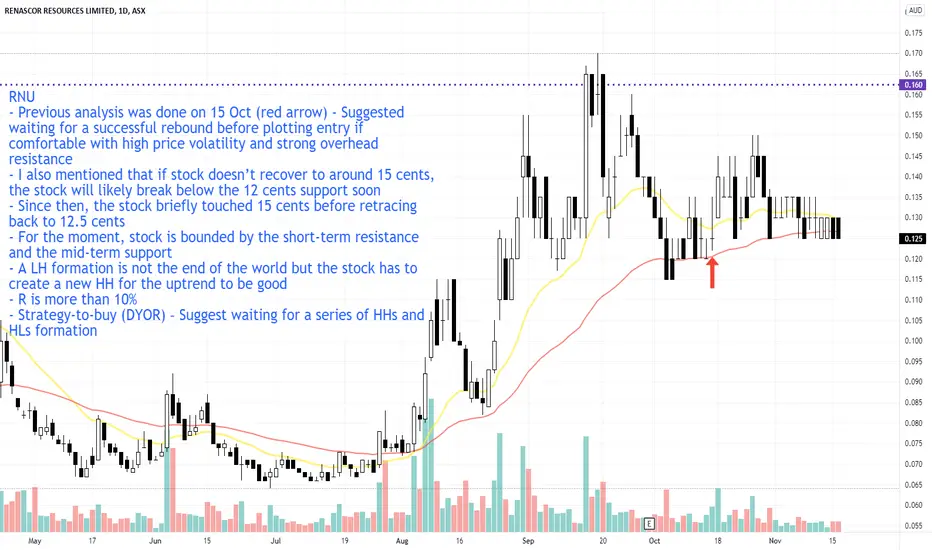
RNU @ 16 NOV 2021Text me if you have any questions/comments for me.
-----
RNU
- Previous analysis was done on 15 Oct (red arrow) - Suggested waiting for a successful rebound before plotting entry if comfortable with high price volatility and strong overhead resistance
- I also mentioned that if stock doesn’t recover to around 15 cents, the stock will likely break below the 12 cents support soon
- Since then, the stock briefly touched 15 cents before retracing back to 12.5 cents
- For the moment, stock is bounded by the short-term resistance and the mid-term support
- A LH formation is not the end of the world but the stock has to create a new HH for the uptrend to be good
- R is more than 10%
- Strategy-to-buy (DYOR) – Suggest waiting for a series of HHs and HLs formation
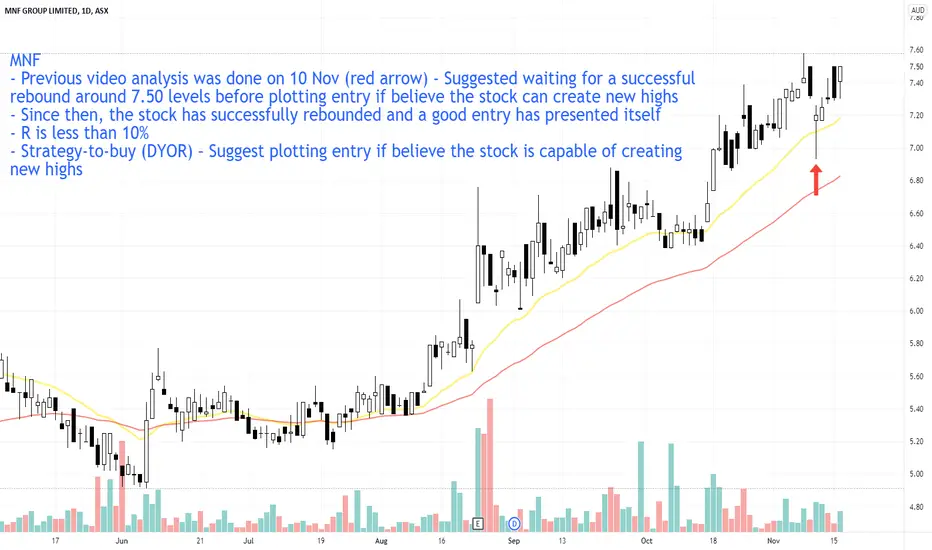
MNF @ 16 NOV 2021Text me if you have any questions/comments for me.
-----
MNF
- Previous video analysis was done on 10 Nov (red arrow) - Suggested waiting for a successful rebound around 7.50 levels before plotting entry if believe the stock can create new highs
- Since then, the stock has successfully rebounded and a good entry has presented itself
- R is less than 10%
- Strategy-to-buy (DYOR) – Suggest plotting entry if believe the stock is capable of creating new highs
JHX @ 16 NOV 2021Text me if you have any questions/comments for me.
-----
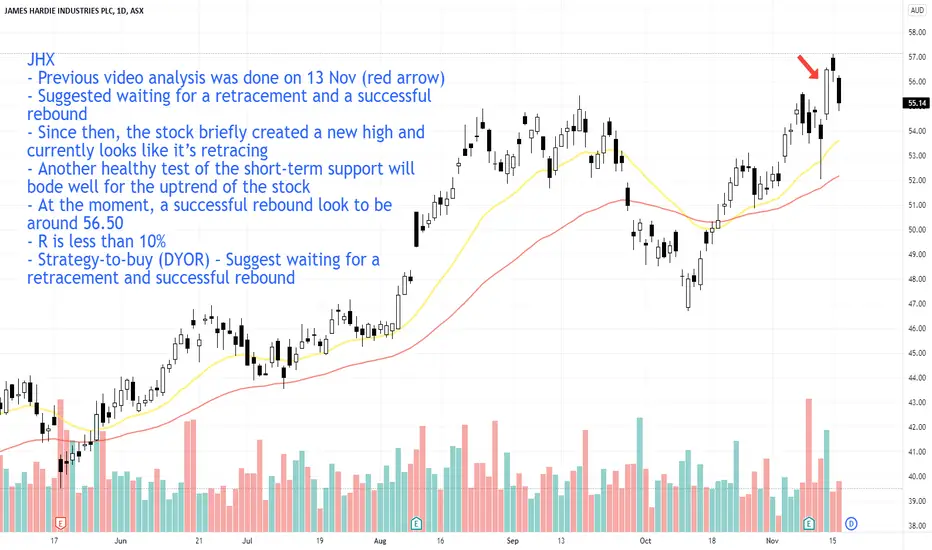
JHX
- Previous video analysis was done on 13 Nov (red arrow) - Suggested waiting for a retracement and a successful rebound
- Since then, the stock briefly created a new high and currently looks like it’s retracing
- Another healthy test of the short-term support will bode well for the uptrend of the stock
- At the moment, a successful rebound look to be around 56.50
- R is less than 10%
- Strategy-to-buy (DYOR) – Suggest waiting for a retracement and successful rebound