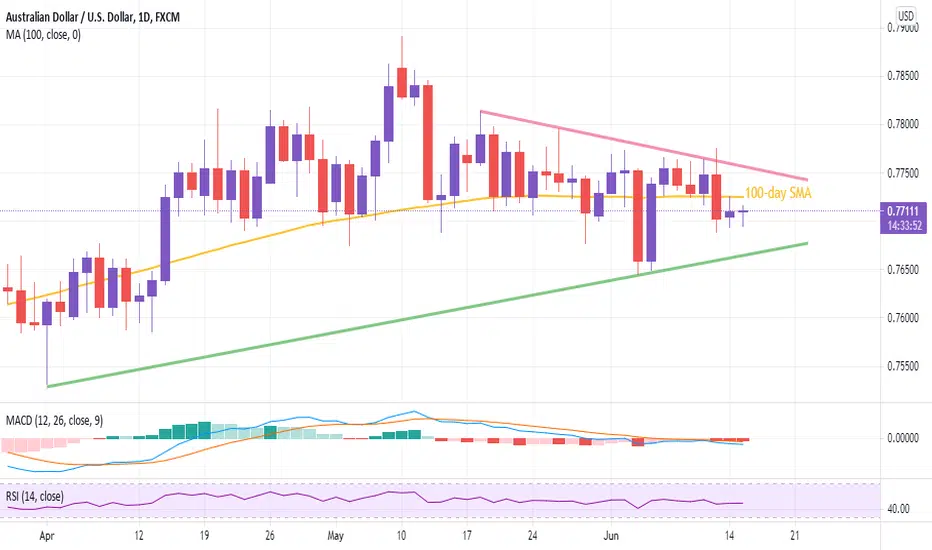
AUDUSD stays directed towards 2.5-month-old support lineAlthough AUDUSD keeps Monday’s recovery moves around 0.7700, the pair bulls have a bumpy road ahead. That said, a 100-day SMA level of 0.7725 and a monthly falling trend line near 0.7760 probes the short-term recovery moves amid sluggish MACD. It should also be noted that an absence of directional signals from the RSI also challenges the pair’s corrective bounce inside a symmetrical triangle formation between 0.7760 and 0.7660.
While the absence of bullish signals isn’t enough to back bears, the market’s anxiety ahead of tomorrow’s US Federal Reserve (Fed) meeting adds to the sellers’ favor. However, a clear downside below an ascending support line from April 01, near 0.7660, becomes necessary for the AUDUSD bears to retake controls. Following that, the monthly low near 0.7645 and the mid-April bottom surrounding 0.7585 should gain the market’s attention.
Trendfollowing
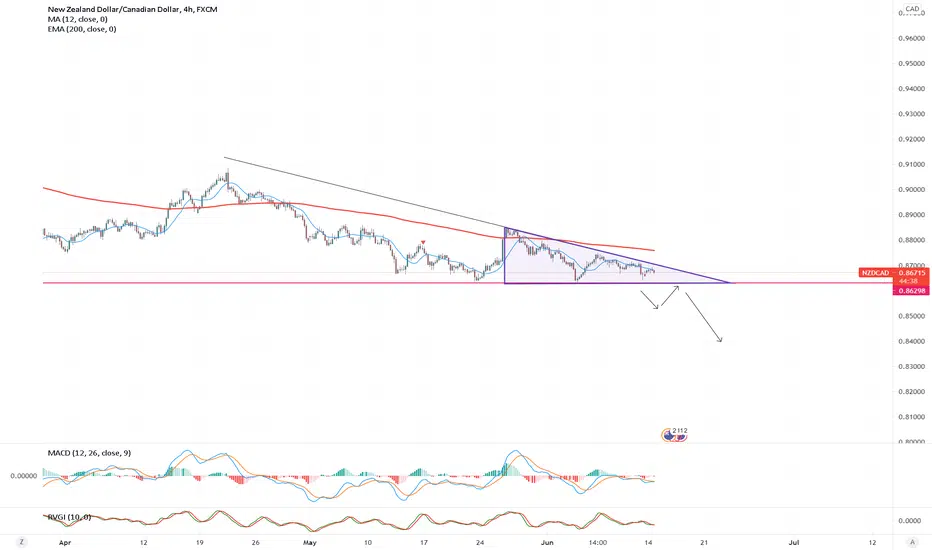
NZDCAD - ShortPossible descending triangle forming
Potentially for a break below support and then a retest before continuing bearish trend.
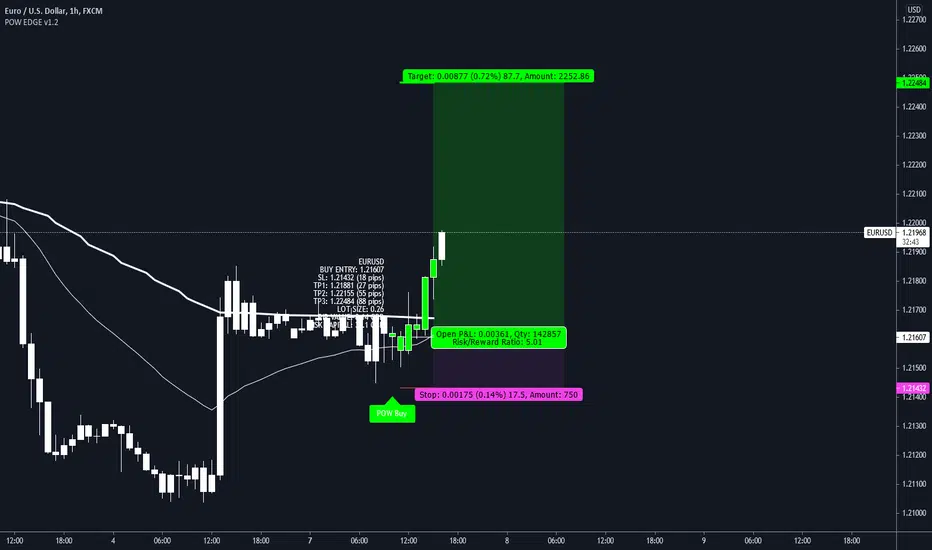
Hands up anyone else on EURUSD longs? 🙋♂️🙌The USD weakeness is being picked up by out script.
EURUSD long is now in full swing.
Entry details are shown on the chart.
We're only looking for TP3.
Trade history can be seen below this trade idea too for full transparency.
------------------------------------------
I try and share as many ideas as I can as and when I have time. My trades are automated so I am not sat in front of a screen daily.
Jumping on random trade ideas 'willy-nilly' on Trading View trying to find that one trade that you can retire from is not a sustainable way to trade. You might get lucky, but it will always end one way.
------------------------------------------
Please hit the 👍 LIKE button if you like my ideas🙏
Also follow my profile, then you will receive a notification whenever I post a trading idea - so you don't miss them. 🙌
No one likes missing out, do they?
Also, see my 'related ideas' below to see more just like this.
The stats for this pair are shown below too.
Thank you.
Darren
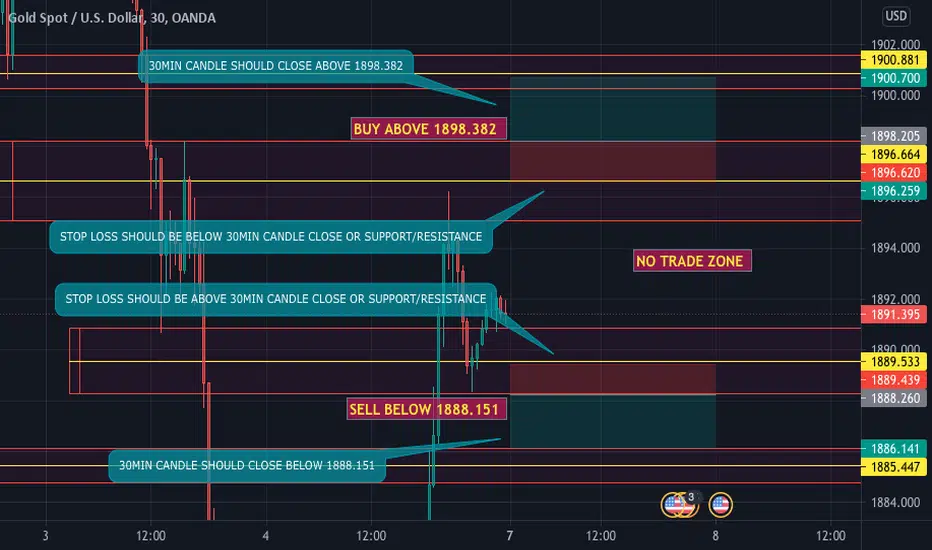
PRICE ACTION SETUP FOR GOLDOANDA:XAUUSD
Market is ranging between 1896.664 and 1889.533
There is a buying opportunity above 1898.382
And a selling opportunity below 1888.151
Wait unlit it breaks these levels or 30min candle closes above this levels.
Trick :
For impulse entry trade at London or NY Timing,
When 30min candle cross these levels switch to 1min or 5min time frame for best entry!
Trade at your own risk
Brent to reach $85?I've been bullish on FX_IDC:USDBRO ever since it traded above its 200EMA. Bought few contracts, rode the trend from $43 to $69.
Last week Brent closed above $71, looking back, this was/is an area of value. Now that the price is above $71, I'm bullish once again, targeting the $85 region, with a stop below the 50EMA.

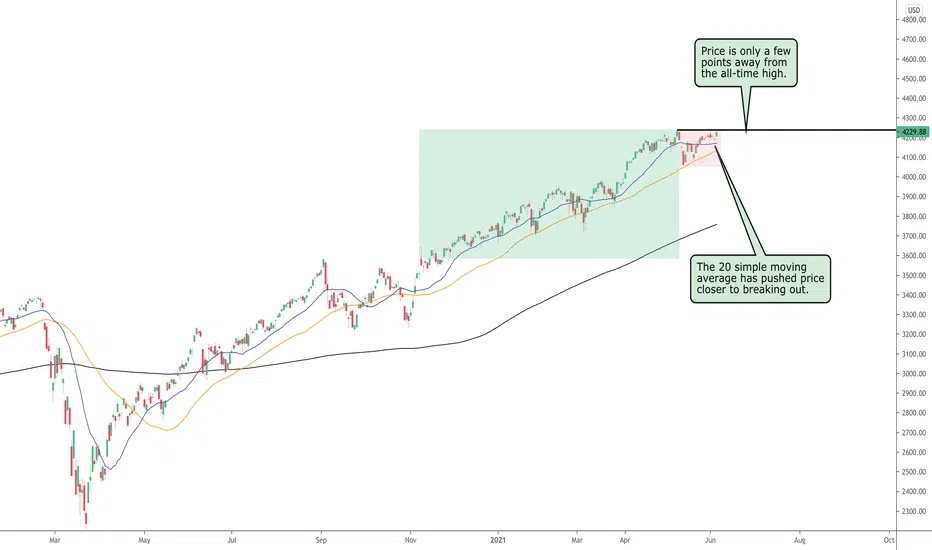
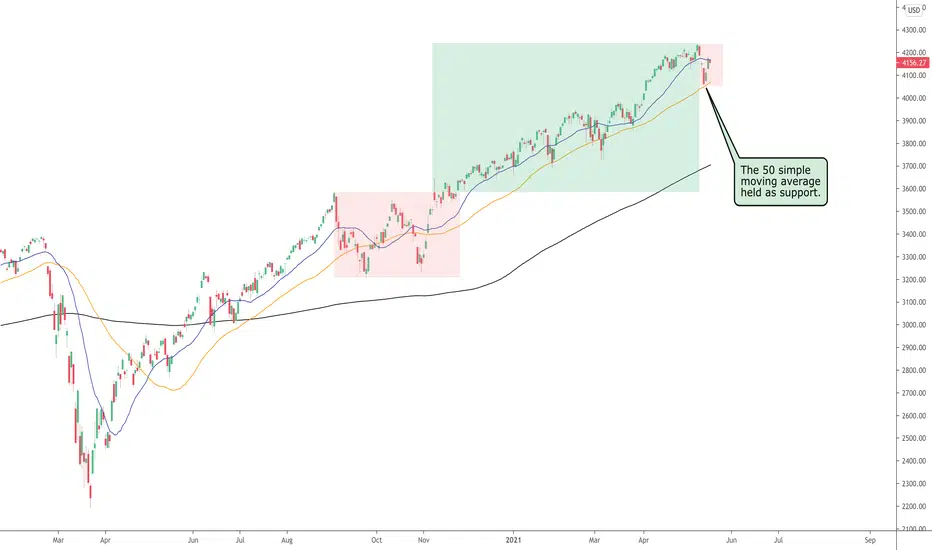
S&P 500 - 9 Points Till Breakout!In the previous post on the S&P 500, price appeared to be moving fast towards the
all-time high at $4238, but it has taken longer than expected to get there.
The pullback has turned into consolidation but used the 20 simple moving average
as support, which did help price move higher towards the end of last week.
The monthly candle for May closed with an indecision candle, suggesting a potential
reversal/pullback, but price is looking strong so far this month.
The fact that rice pulled back last week and bounced off the 20sma gives us the
confidence that the uptrend is likely to continue, but a break and close above
the all-time high will confirm this.
Friday’s candle closed with a solid bullish candle and price is now just 9 points
away from breaking out. If the bullish momentum flows into next week, then
we should get that breakout we are waiting for.
See below for more information on our trading techniques.
As always, keep it simple, keep it Sublime.

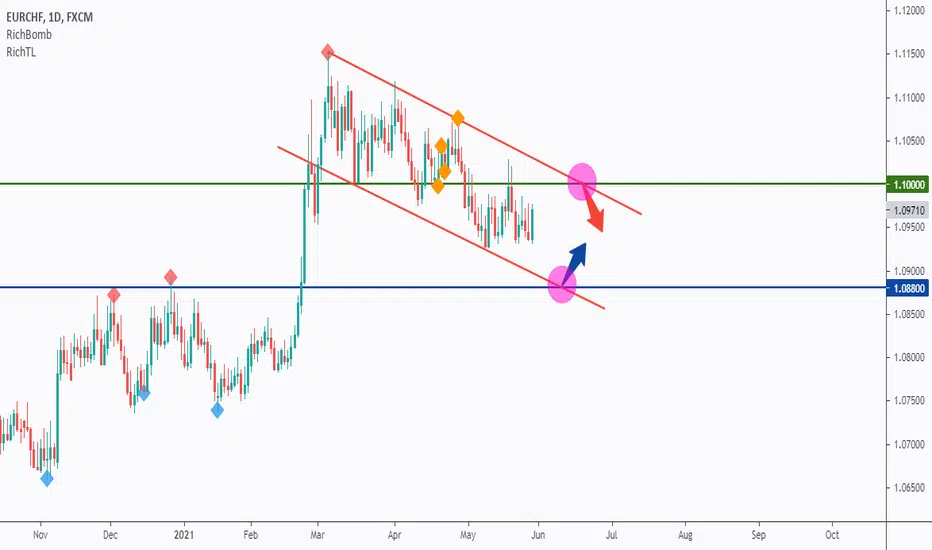
EURCHF - Purple War Zones!Hello everyone, if you like the idea, do not forget to support with a like and follow.
EURCHF rejected our lower red trendline. However, it is still overall bearish trading inside the red channel, so we will be looking for Trend-Following Sell Setups.
As per my trading style/plan;
Here are the two strong zones where I will be looking for high probability buy setups:
I call them War Zones, (highlighted in Purple circles)
Zone 1: (around 1.10)
This highlighted purple circle is a strong area to look for sell setups as it is the intersection of the green resistance and upper red trendline. (acting as non-horizontal resistance)
Zone 2: (around 1.088)
This highlighted purple circle is a strong area to look for buy setups as it is the intersection of the blue support and lower red trendline. (acting as non-horizontal support)
As per my trading style:
As EURCHF approaches one of the purple circles, I will be looking for reversal setups (like a double bottom/top pattern, trendline break, and so on...)
Always follow your trading plan regarding entry, risk management, and trade management.
Good luck!
All Strategies Are Good; If Managed Properly!
~Rich
Microsoft Forming A Textbook TrendMicrosoft is following a pattern of trend then pullback/consolidation followed by trend and so on.
Although the pullbacks and consolidation zones do last a few weeks, this stock is a consistent mover,
and just requires patience if a position is held.
At the moment, we are seeing a trend in play, forming higher highs and higher lows with price now
making its way towards the all-time high at $263.
The 50 simple moving average is below and should act as support if we experience a deep pullback.
The last time price made contact with this indicator was back in March of this year. The fact that
price has not hit it since demonstrates how smooth the current bullish move is.
Microsoft has formed strong linear trends in the past and although the current move is not linear,
we could see momentum pick up and form another nice move.
The $300 round number is above and is the next level of resistance as this is a psychological level.
We are now in a waiting game as price approaches resistance.
See below for more information on our trading techniques.
As always, keep it simple, keep it Sublime.

Will the S&P Break Out This Week?The S&P 500 is progressing well and after bouncing off the 50 simple moving average last week.
The 20 simple moving average appeared to be acting as temporary support, but today we can
see price is above this indicator.
As mentioned in previous posts, we have support levels in the form of the 20 and the 50 simple
moving averages and the $4000 round number, which is a psychological support zone.
This recent pullback does appear to be a mini period of consolidation, but this should not
matter as long as the trend continues.
We are now waiting for a break and close above the current all-time high at $4238, which was
created on May 7th, a few days ago. A close above this level will confirm the buyers are in
command and should be set to push price higher.
As long as the moving averages continue to act as a ladder, helping price climb to the upside,
we should see record highs continuing to be made through the rest of the year.
See below for more information on our trading techniques.
As always, keep it simple, keep it Sublime.
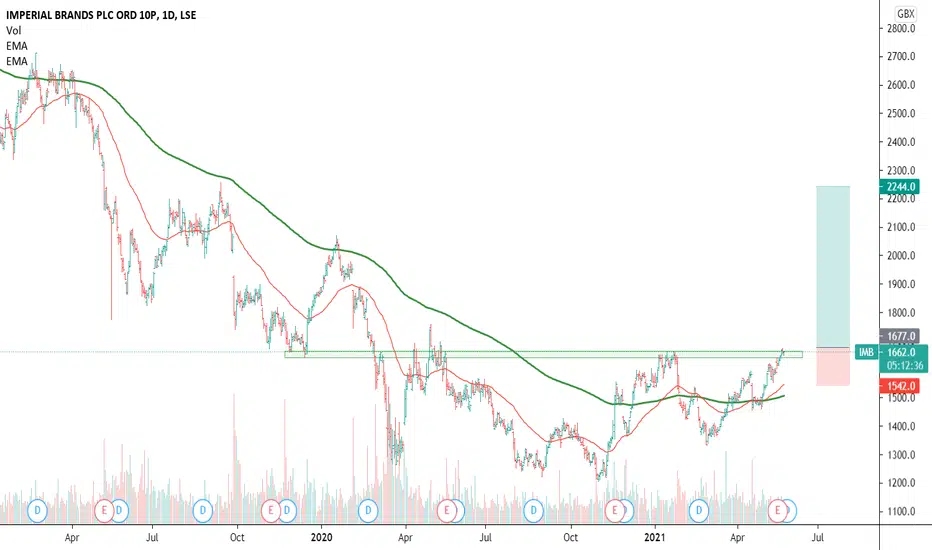
Imperial Brands long trade ideaWe covered a couple of tobacco stocks in one of our YouTube videos.
Now we see a good setup for LSE:IMB ; price > 50EMA, 50EMA>200EMA, characteristics of a strong uptrend. For a short term pay, 1:4 risk-to-reward; a buy at current level with a stop below the 50EMA, and a short-term target at 2244 GBX.
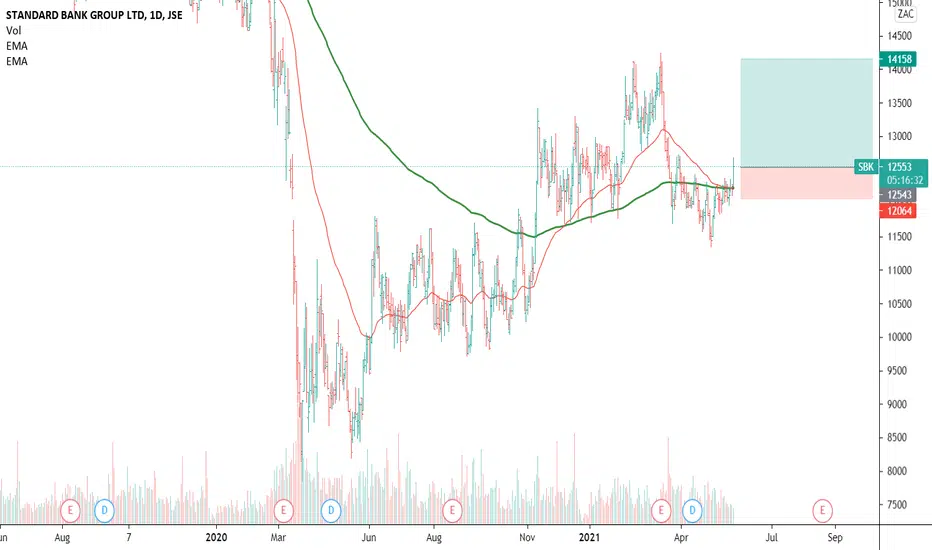
A nible on Standard BankI am bullish on the financial sector, major banks are trading above the 200EMA. JSE:SBK can push higher from here. It's a reasonable 1:3 risk:reward.
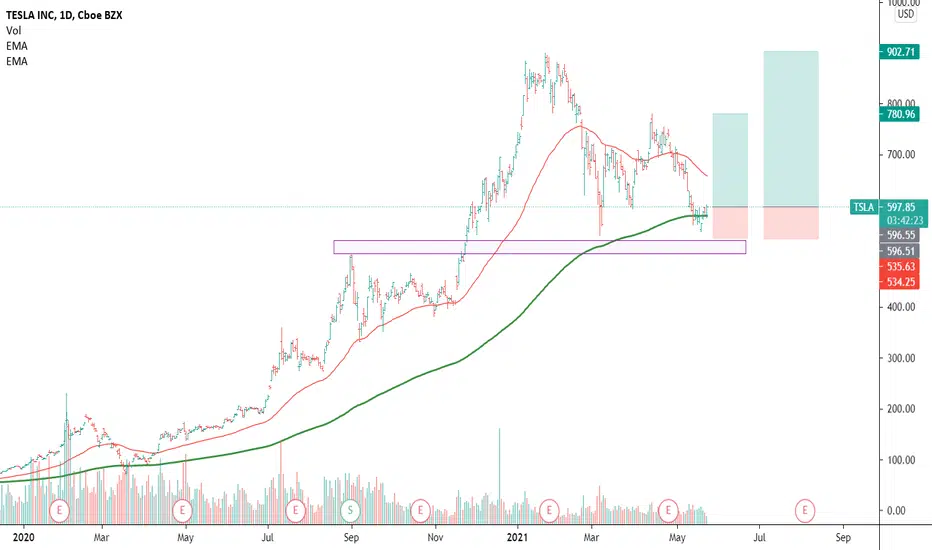
Tesla Long Idea, worth a puntLoving NASDAQ:TSLA at this level following the last week's pull back. The stock found support on the 200EMA, as anticipated.
I am expecting the price to move up, with a bit of resistance on the 50EMA. If it manage to break above it, TP1 is near the recent lower high of $780, and a full target at $902.
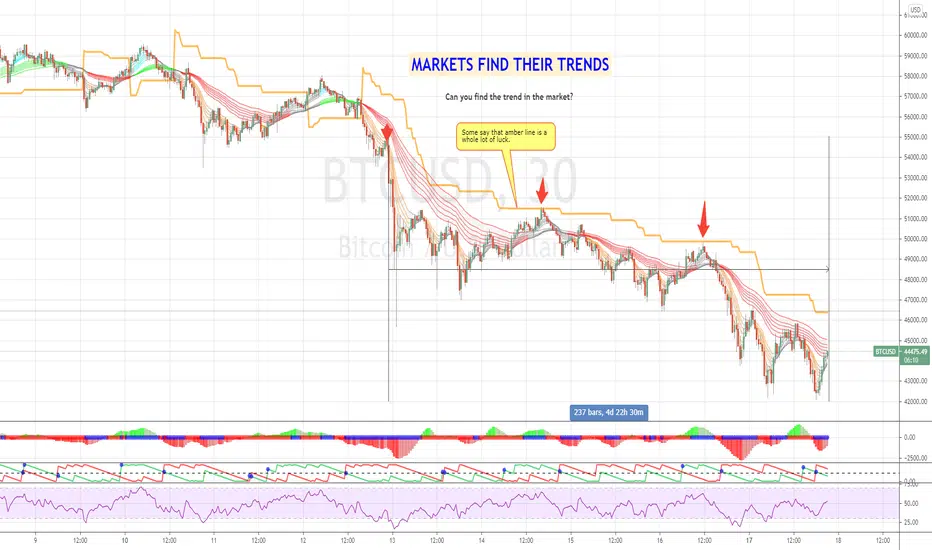
Is the trend really your friend?This is a short take. I'm showing a 30 min ATR trend line.
Loads of traders know that ' the trend is their friend ', but do they truly exploit it? I don't think so.
There were three main opportunities to exploit this trend. The problem is - now you see it but when it's developing you can't. But at each of two points where price hit the 30 min ATR line, it was worth a short, with a very tight stop loss.
Trend following is a very difficult strategy, but rewards can well exceed other methods of trading. It makes sense to explore it, and develop the skill (safely on paper trading accounts).
Disclaimer: This is not advice or encouragement to trade securities or any asset class. This is not investment advice. Chart positions shown are not suggestions and not intended to assure you of an advantage. No predictions and no guarantees are supplied or implied. The author trades mostly trend following set ups which has a low win rate of approximately 40%. Heavy losses can be expected if trading live accounts or investing in any asset class. Any previous advantageous performance shown in other scenarios, is not indicative of future performance. If you make decisions based on opinion expressed here or on my profile and you lose your money, kindly sue yourself.
S&P Experiences Another PullbackThe recent declines in the market were just another profit-taking session for short-term investors.
It may have sparked a lot of fear amongst investors new to investing, but savvy investors would be
fully prepared for such events.
The $4000 round number is also below, should price decide to move further down. This level may
act as support, and further down we have the 200 simple moving average.
The S&P remains bullish and will frequently experience pullbacks to the 20 & 50 simple moving
averages, which is normal based on the history of this index.
At the moment, the 20 simple moving average is acting as resistance but shouldn’t hold price for
too long if the bull trend is strong enough.
Patience is required for now as price gathers up enough momentum to push higher. A break and
close of the current all-time high at $4238 will confirm a continuation to the upside.
See below for more information on our trading techniques.
As always, keep it simple, keep it Sublime.
Boeing long trade ideaAt current levels NYSE:BA is offering a reasonable risk to reward to justify a long entry.
Even a swing trade to the previous swing high of $278, with a stop near $212 is a 1:3 risk to reward. However, I'm bullish in this stock, it's in the accumulation phase so it'll be a long-term investment as opposed to a short term trade. Thus, the risk:reward is irrelevant now as I expect the stock to trade beyond $300/share.
Always #managerisk

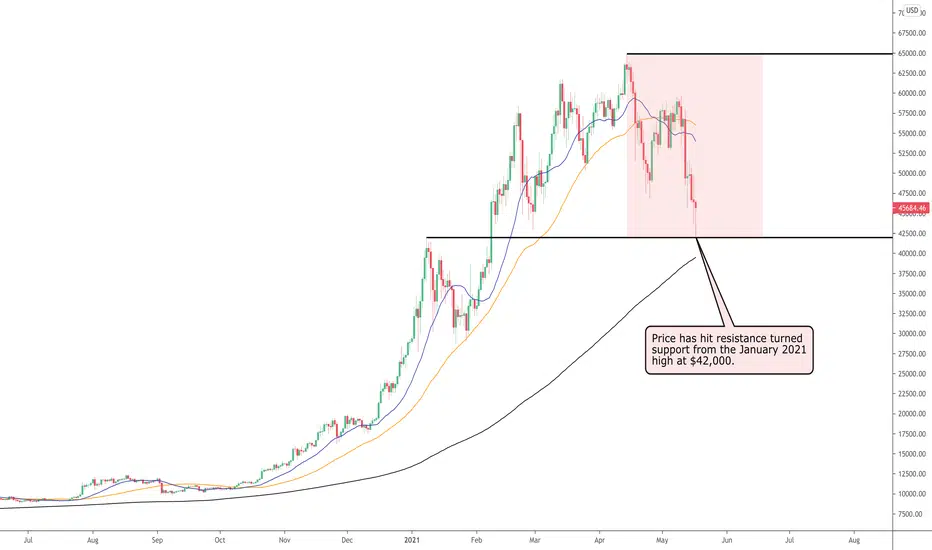
Bitcoin Taking A Breather!Bitcoin has been making headlines throughout this year, mainly due to the 123% growth we
witnessed from the start of the year to its peak in April, almost reaching $65,000.
As is the case during strong moves, we will experience a correction, and Bitcoin appears to
be doing just that. We now need to establish levels of support that price may bounce off.
Support and resistance levels are leading indicators because we will be aware of these levels
in advance. Price at the moment has hit support at $42,000, which was previously a resistance
level. An indecision candle is currently forming here, but it may be subject to change as this
is an intraday candle.
If this level fails to hold price up, we have the $40,000 round number below, followed by the
daily 200 simple moving average.
As there are several strong support levels below price, the expectation is that they will hold,
for now at least. If these support levels are broken, then this will be an early indication that
the trend may have come to an end.
We will then be in a position to manage our positions.
See below for more information on our trading techniques.
As always, keep it simple, keep it Sublime.
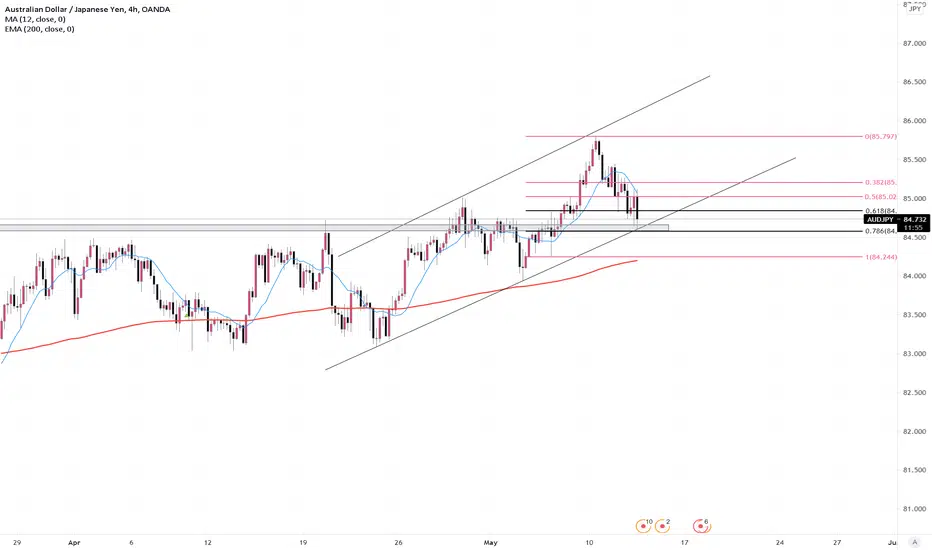
AUDJPY - LongLook for bullish rejection at:
- Previous resistance (84.60)
- Rejection at Fibonacci level 78.6
- Bullish rejection at the support trend line
- Bullish confluence among technical indcators
Also, trend following!
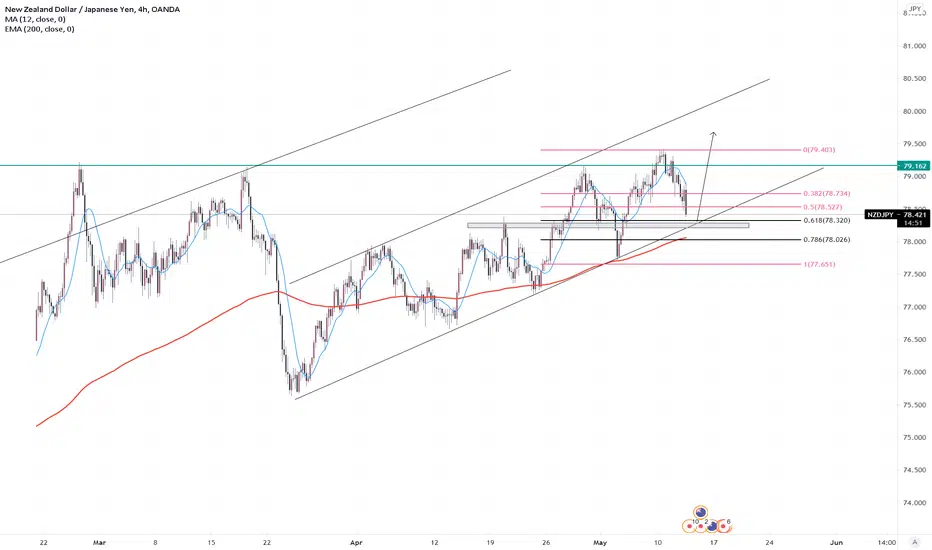
NZD/JPY - LongCould see some nice bullish reject at support (78.20) on the trend line as well as previous resistance levels and the 61.8% fibonacci level.
Lots of confluence potentially forming. Will be keeping a close eye on this pair.
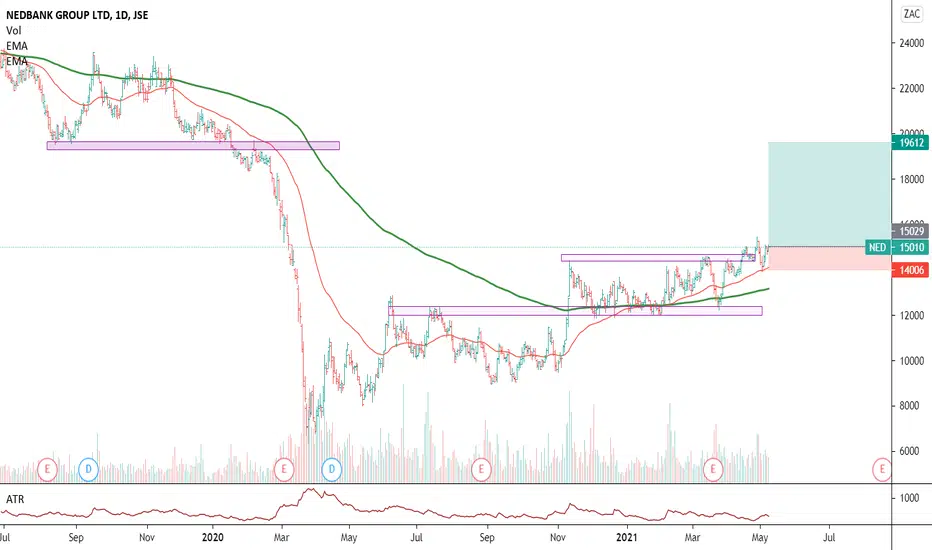
Nedbank swing trade3JSE:NED broke out of the R145-ish resistance, and it's supported by the 50EMA. Taking a swing trade at this level, targeting the next potential resistance level at R193. With a stop below the 50EMA, this is a potential 1:4 risk:reward trade.