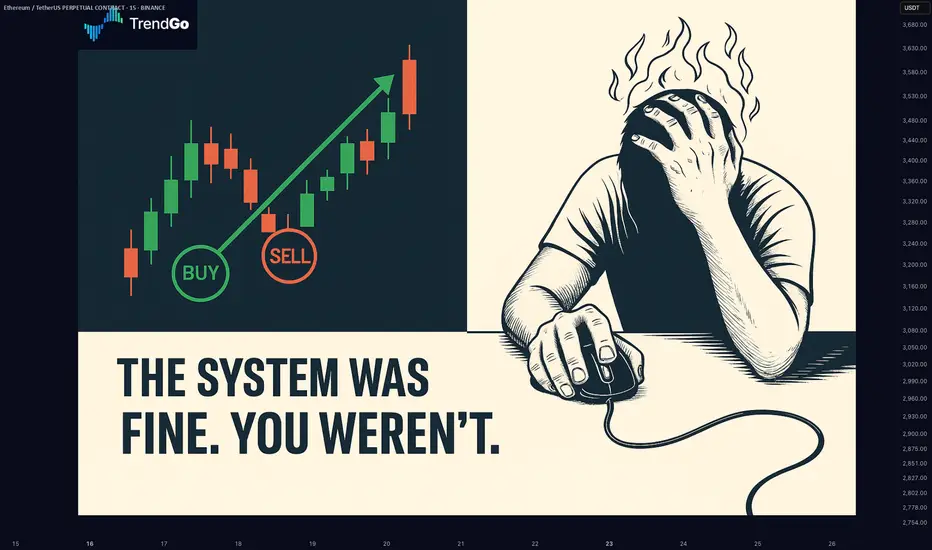
Your Trading System Isn't the Problem. Your Discipline Is.📘 Your Trading System Isn't the Problem. Your Discipline Is.
Hard truth:
Your endless search for a new system is a smokescreen.
The best system in the world can't save you from poor discipline.
Here's why discipline matters more than your strategy:
You quit your system after a few losses, never allowing it to prove its value.
You deviate from your rules when emotions run high—wrecking consistency.
You're focused on shiny objects instead of sharpening the knife you already have.
🎯 The solution?
Commit to discipline. Track your adherence rigorously. Measure your success by consistency, not immediate outcomes.
TrendGo’s power isn’t just in clear signals—it's in enabling disciplined action.
🔍 Stop blaming your tools. Own your discipline.
Trendgo
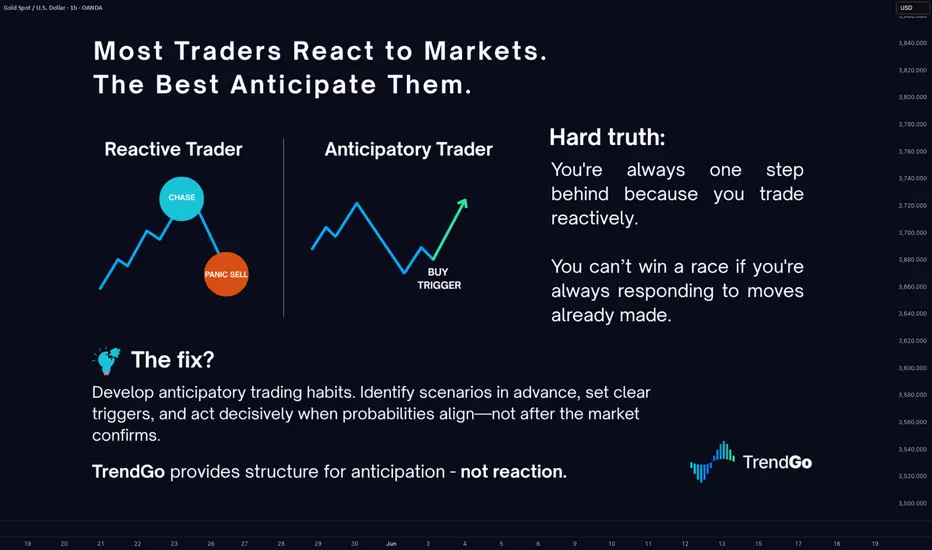
Most Traders React to Markets. The Best Anticipate Them.Most Traders React to Markets. The Best Anticipate Them.
Hard truth:
You're always one step behind because you trade reactively.
You can’t win a race if you're always responding to moves already made.
Here's how reactive trading burns your edge:
- You chase breakouts after they've happened, entering at the peak.
- You panic-sell into downturns because you didn't anticipate.
- You miss major moves because you're looking backward, not forward.
🎯 The fix?
Develop anticipatory trading habits. Identify scenarios in advance, set clear triggers, and act decisively when probabilities align - not after the market confirms.
TrendGo provides structure for anticipation - not reaction.
🔍 Stop responding, start anticipating. Your account will thank you.
Stop Hunting for Perfection - Start Managing Risk.Stop Hunting for Perfection — Start Managing Risk.
Hard truth:
Your obsession with perfect setups costs you money.
Markets don't reward perfectionists; they reward effective risk managers.
Here's why your perfect entry is killing your results:
You ignore good trades waiting for ideal setups — they rarely come.
You double-down on losing trades, convinced your entry was flawless.
You're blindsided by normal market moves because you didn’t plan for imperfection.
🎯 Solution?
Shift your focus from entry perfection to risk management. Define your maximum acceptable loss, stick to it, and scale into trades strategically.
TrendGo wasn't built to promise perfect entries. It was built to clarify probabilities and structure risk.
🔍 Stop chasing unicorns. Focus on managing the horses you actually ride.

Most Traders Want Certainty. The Best Ones Want Probability.Hard truth:
You’re trying to trade like an engineer in a casino.
You want certainty in an environment that only rewards probabilistic thinking.
Here’s how that kills your edge:
You wait for “confirmation” — and enter too late.
By the time it feels safe, the market has moved.
You fear losses — but they’re the cost of data.
Good traders don’t fear being wrong. They fear not knowing why.
You need to think in bets, not absolutes.
Outcomes don’t equal decisions. Losing on a great setup is still a good trade.
🎯 Fix it with better framing.
That’s exactly what we designed TrendGo f or — to help you see trend strength and structure without delusions of certainty.
Not perfect calls. Just cleaner probabilities.
🔍 Train your brain for the game you’re playing — or you’ll keep losing by default.

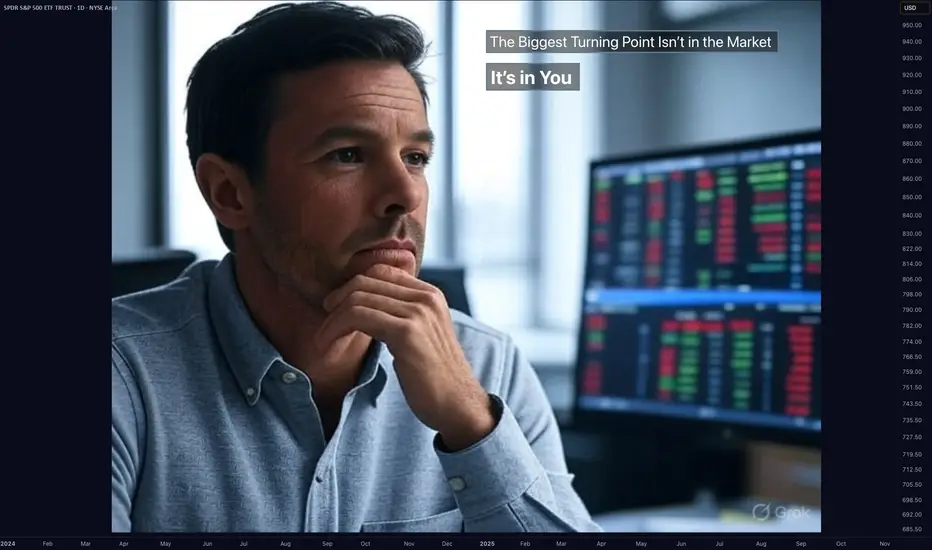
The Biggest Turning Point Isn’t in the Market — It’s in YouHard truth:
No new strategy, indicator, or tool will work until you change how you operate.
Here’s why:
Strategy hopping is fear wearing a costume.
If you keep switching tools after every loss, you’re not refining — you’re running.
You don’t need more — you need fewer, better decisions.
Simplifying your process is harder than adding new ideas. But that’s where edge lives.
Belief is the multiplier.
Without conviction, you’ll quit before any system has time to work.
🚀 The shift?
For us, it was trusting what we built — TrendGo.
When we finally stopped tweaking and started trusting the system, everything changed: our mindset, our consistency, our results.
The best tool is worthless if you don’t believe in your process.
🧠 Start there.
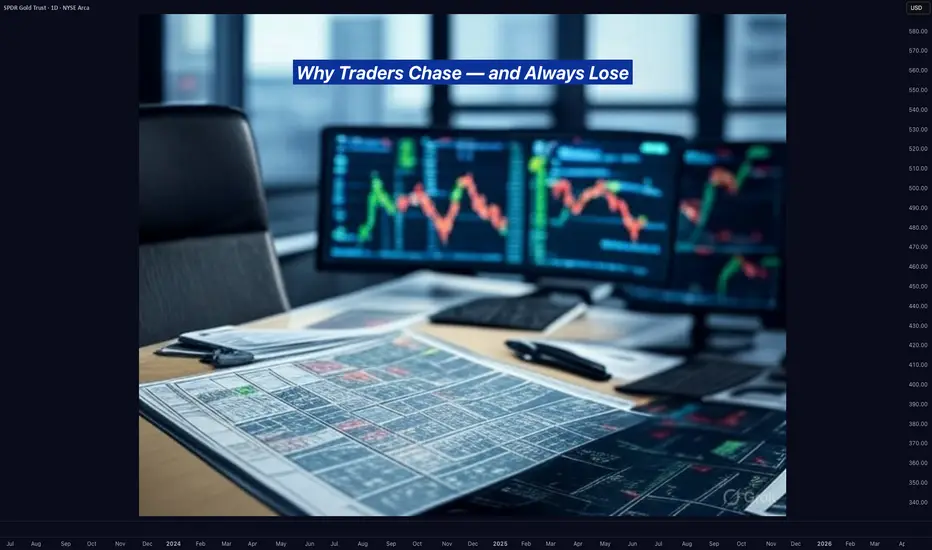
Why Traders Chase — and Always LoseHard truth:
You don’t miss opportunities. You chase noise.
Let’s break down the real reason you keep “missing moves”:
1. FOMO is not urgency — it’s confusion.
When you enter because “everyone’s talking about it,” you’re not trading a setup. You’re reacting to social proof.
2. Volatility ≠ opportunity.
Big moves look attractive, but if they’re not in your plan — they’re distractions, not trades.
3. The market rewards patience, not activity.
Every click, every chart, every refresh feeds your dopamine — not your edge.
🚫 Solution?
Stop scanning. Start filtering.
Use tools that prioritize structure over noise. That’s why we built TrendGo — to give clarity in chaos and help you avoid traps masked as opportunity.
📌 Don’t chase. Build your edge.
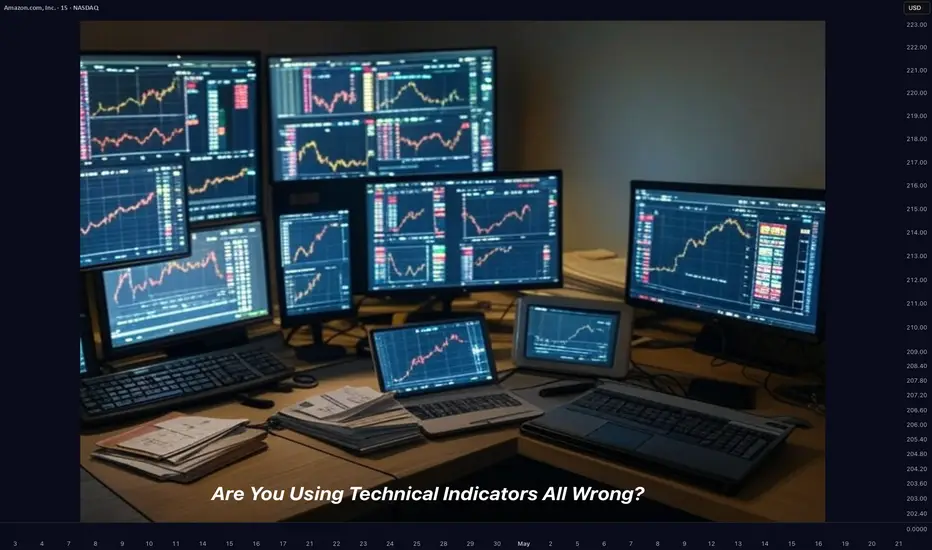
Are You Using Technical Indicators All Wrong?Most indicators aren’t broken. Most traders use them wrong.
Thousands of traders rely on RSI, MACD, and moving averages — and most of them still lose money. Why? Because they use tools the wrong way, in the wrong context, with the wrong mindset.
Let’s break it down:
1. Indicators don’t predict — they react.
RSI hitting 30 doesn’t mean “buy”. It means selling pressure dominated recently.
2. One tool ≠ one strategy.
MACD or CCI alone won’t build you a system. Context, confluence, and confirmation matter.
3. Emotional confirmation kills discipline.
Seeing RSI 70 after price moves doesn’t mean you’re late. It means your emotions want to join the move — not your logic.
🚨 Solution?
Use indicators as filters, not triggers.
Build rules. Track what works. Trade the system — not your excitement.
Want to see more posts like this? Let us know — We're preparing a series of deep-dives into indicator psychology and structure.
Candlestick Patterns + Trend and Momentum: A Perfect CombinationCandlestick patterns provide valuable insights into price action, showing potential reversals, continuations, or market indecision. However, to significantly improve their effectiveness, combining candlestick analysis with trend and momentum indicators is essential. Here’s how you can use these combinations to trade with more confidence and accuracy.
1. Why Candlestick Patterns Matter
Candlestick patterns visually represent traders’ psychology through price movements, including four key prices: Open, Close, High, and Low. Some of the most common and useful patterns include:
Doji: Indicates market indecision and potential reversals.
Hammer & Hanging Man: Signals possible trend reversals at support or resistance.
Engulfing Pattern: Often marks the beginning of a significant reversal.
Morning/Evening Star: Combination patterns that strongly suggest a trend reversal.
2. Adding Trend and Momentum Indicators
Candlestick patterns alone might lead to false signals or confusion. By pairing them with other technical tools, such as moving averages, RSI (Relative Strength Index), or MACD (Moving Average Convergence Divergence), you gain crucial context to confirm the reliability of the patterns.
Here’s how:
Trend Alignment:
Using moving averages, such as the 20 or 50-period EMA, helps confirm whether a bullish candlestick pattern appears in an uptrend (strengthening the signal) or countertrend (potentially weaker signal).
Momentum Confirmation:
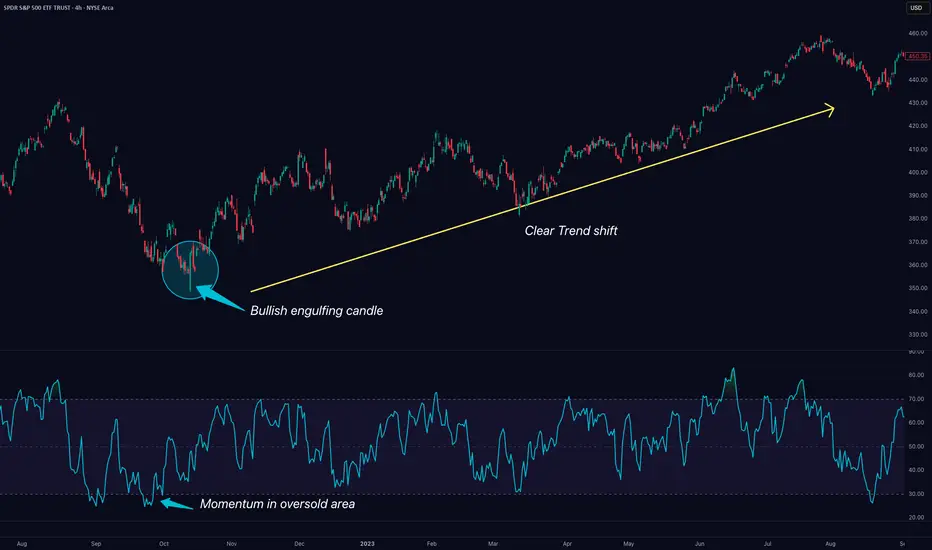
Oscillators like the RSI or MACD can confirm the underlying momentum behind a candlestick pattern. For instance, a bullish engulfing pattern becomes more reliable if it coincides with RSI moving upward from oversold territory or MACD showing a bullish crossover.
Volume Analysis:
Higher volume on the candle that forms the pattern typically confirms increased market interest and strengthens the validity of the signal.
3. Practical Example: Bullish Engulfing + RSI
Imagine you spot a bullish engulfing pattern forming at a clear support level after a downtrend:
Step 1: Identify the Pattern: Confirm the bullish engulfing visually.
Step 2: Check RSI: Ensure RSI is below 30 or rising, signaling oversold conditions and potential bullish momentum.
4. Why This Approach Works
Enhanced Accuracy: Combining candlestick signals with trend and momentum indicators increases signal reliability.
Improved Risk Management: Clearer signals mean more confident entries and better-defined stop-loss levels.
Reduces False Signals: Multiple confirmations reduce the risk of false breakouts or reversals.
5. Final Tips
Always look for multiple confirmations (trend, momentum, volume) before making trade decisions based solely on candlestick patterns.
Be patient—waiting for full confirmation can help avoid premature trades.
Regularly backtest and practice recognizing these combined signals to strengthen your trading strategy.
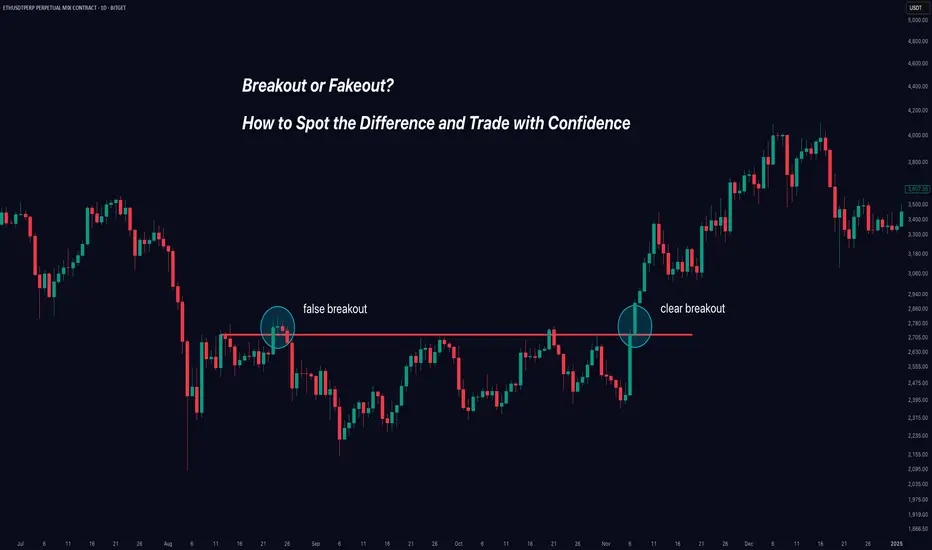
Breakout or Fakeout? How to Spot the Difference and Trade.Trading breakouts can be exciting - and profitable - when they're real. But how do you avoid getting caught in those frustrating false breakouts (fakeouts) that trap many traders?
In this clear and practical guide, you'll learn exactly how to identify genuine breakouts, avoid traps, and improve your trading decisions instantly.
Here's what we'll cover:
✅ Real Breakouts vs Fakeouts: Why it matters.
✅ Market Psychology: Why false breakouts happen.
✅ Volume: Your best friend for spotting authenticity.
✅ Price Structure & Context: When breakouts mean business.
✅ Momentum Confirmation: The hidden indicator that changes everything.
Let’s dive in!
🚩 Real Breakout vs Fakeout: Know the Difference
A breakout occurs when price decisively moves beyond a clear support or resistance level. Imagine Bitcoin breaking above $50,000 or Gold dropping below $1,900.
A fakeout happens when price briefly breaks these key levels—but quickly reverses, leaving traders stuck on the wrong side of the market.
Why it matters: Fakeouts aren't just frustrating—they’re costly. They drain your capital and confidence. Recognizing them early keeps you profitable and disciplined.
🧠 Why Do Fakeouts Happen? (The Psychology)
Fakeouts thrive because traders chase excitement and fear missing out (FOMO). Here’s the secret many traders overlook:
Bull and Bear Traps: Institutional traders deliberately push prices slightly past key levels to trigger stop orders—only to reverse the price sharply.
FOMO-driven trades: Retail traders jump in excitedly at any small breakout, providing fuel for these short-lived moves.
Understanding these tactics can help you stay calm and avoid impulsive entries.
🔥 Volume: The Ultimate Breakout Indicator
Want to know if a breakout is real? Look at volume—it reveals the market’s true intention.
High Volume: Means broad market participation and conviction, supporting a genuine breakout.
Low Volume: A red flag! This signals low market conviction and a higher likelihood of reversal.
Example: If Ethereum breaks above $4,000 with unusually high volume, that's a strong signal. But if volume remains low, beware—it's likely a fakeout.
📐 Context and Price Structure Make a Difference
Not all breakouts are created equal. Pay attention to these key context clues:
Trend Alignment: Breakouts in the direction of a clear existing trend are more reliable.
Significance of Level: Breakouts of major support/resistance levels (weekly or monthly highs/lows) have higher odds of success.
Follow-through and Retests: Genuine breakouts often retest broken levels, turning old resistance into new support.
⚡ Momentum Confirmation: Your Secret Weapon
Momentum indicators (like RSI or MACD) tell you what's happening beneath the surface. They help confirm or reject breakout validity:
Strong Momentum: If indicators confirm the breakout direction, the breakout is more reliable.
Divergence (Warning Sign): If price makes a new high but momentum indicators show lower highs, beware—a fakeout could be near.
Use momentum as your final confirmation step. It’s the missing piece that many traders ignore.
🎯 Quick Breakout Checklist
Use this simple checklist next time you're assessing a breakout:
🚦 Trade Breakouts Wisely: Final Tips
Be Patient: Waiting for breakout confirmation saves you from costly mistakes.
Set Clear Stops: If a breakout fails, exit quickly. Small losses protect your capital.
Scale into Trades: Enter gradually to manage your risk effectively.
Mind Market Context: Always align breakouts with the broader market direction.
Trading breakouts doesn't have to be stressful. When you know what signs to watch for, you trade with confidence—not guesswork.
🚀 Conclusion: Trade Better, Not Harder
Avoiding fakeouts is all about patience, confirmation, and understanding market psychology. By using volume, context, and momentum effectively, you'll greatly improve your breakout trading.
Now, put these strategies into practice. Stop guessing—start confidently trading real breakouts today!
Happy Trading!
Like this post? Follow us for more clear, actionable trading education.
#TradingTips #Breakouts #TechnicalAnalysis #TradingEducation #Crypto #Forex #StockTrading
How Momentum Divergence Reveals Hidden Market Strength and WeaknMost traders watch price action closely: candlesticks, moving averages, trendlines. But there’s a deeper, less obvious layer of information that often signals shifts in direction before price confirms it: momentum.
📌 Quick overview – what you'll learn:
What momentum divergence is (clearly explained)
How it helps predict potential trend shifts
Practical ways to spot and trade divergences
📈 Price vs Momentum: They're Not the Same!
Momentum doesn't simply track price direction. Instead, it measures the strength behind price movements.
Rising prices, falling momentum often signals upcoming bearish reversals.
Falling prices, rising momentum often hints at bullish reversals building beneath the surface.
These subtle divergences are powerful because they reveal hidden market shifts before everyone else notices them.
⚠️ How to Spot Momentum Divergence (Simple Steps):
Step-by-step:
- Find clear price swings:
Clearly defined highs/lows on your chart.
- Check momentum indicators (RSI, MACD, CCI, etc.):
Does the indicator agree or disagree with the price action?
- Spot divergence:
Bullish divergence: Price makes lower lows, indicator shows higher lows.
Bearish divergence: Price makes higher highs, indicator shows lower highs.
- Confirmation:
Always wait for price confirmation like a reversal candle or break of a trendline.
🔥 Why Momentum Divergence Works:
Divergence highlights hidden accumulation or distribution by smart money.
Helps you anticipate reversals before price confirms.
Filters out weak moves and helps you avoid fake breakouts.
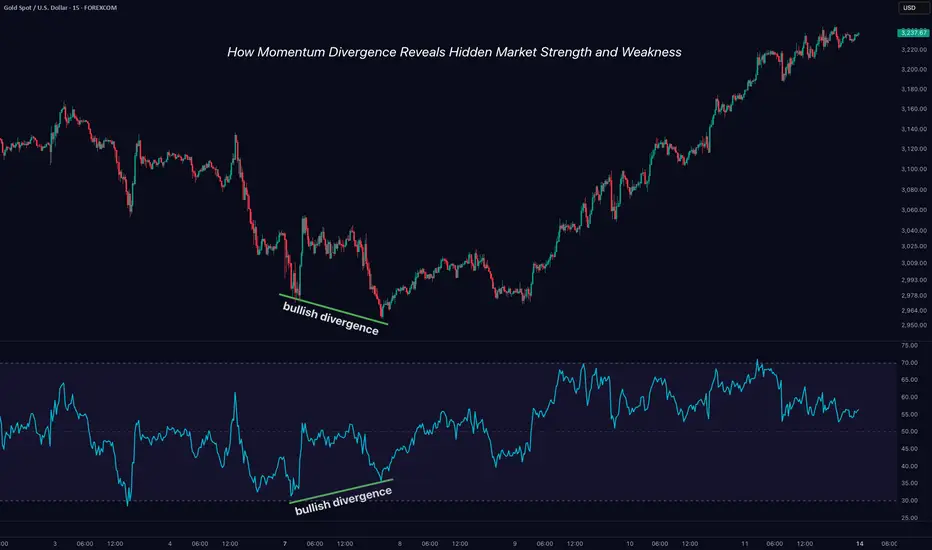
📊 Real Example (XAUUSD – April 2025):
Recently in Gold:
Price was dropping steadily, reaching new lows.
Meanwhile, RSI showed clear higher lows – classic bullish divergence.
Result: Price exploded significantly shortly after momentum divergence appeared clearly.
🧠 Trading Tips to Remember:
Divergence signals are stronger near key support/resistance zones.
Use momentum divergence with your existing strategy for confirmation, not isolation.
Always define your risk clearly (set stops above/below recent highs/lows).
🚩 Common Pitfalls to Avoid:
Trading divergence without confirmation: always wait for the market to show its hand.
Ignoring the bigger picture: check higher timeframes for stronger signals.
Overtrading: not every divergence leads to a reversal; quality beats quantity.
🚀 Your Action Plan for Next Week:
Pick one momentum indicator and identify at least 3 divergences on your favorite assets.
Monitor how they play out.
Note down what works best in your trading journal.
💬 Question for you:
What’s your go-to momentum indicator when spotting divergence? RSI, MACD, CCI, or something else? Drop a comment below!
Happy trading!
TrendGo Team
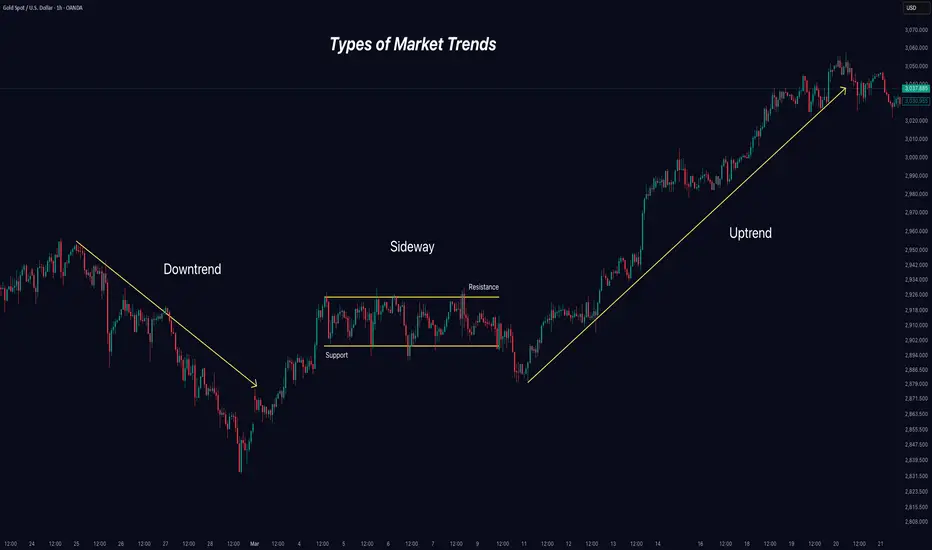
Mastering Market Trends: Your Guide to Clearer Trading DecisionsTrends shape every decision you make in the markets, even if you’re unaware of it. Understanding how to identify and adapt to these market phases is your foundational skill - one that separates successful traders from the rest.
Today, let’s simplify and clarify the three essential types of market trends. By mastering this, you’ll approach trading decisions with more confidence and clarity.
⸻
📈 1. Uptrend – Riding the Bull
• What is it?
An uptrend is like climbing stairs upward. Each step (low) is higher than the previous one, and every leap (high) sets a new peak.
• What drives it?
Buyers dominate, optimism rules, and demand pushes prices upward.
• Trading tip:
Identify support levels and look for retracements as potential entry points. Be cautious about chasing prices that have moved too far without a pullback.
⸻
📉 2. Downtrend – Navigating the Bearish Territory
• What is it?
Visualize going down a staircase. Each step down (low) surpasses the previous one, and every upward bounce (high) falls short of the prior peak.
• What drives it?
Sellers control the market, bearish sentiment takes over, and supply outweighs demand.
• Trading tip:
Look for resistance areas to identify potential short entries or wait patiently for signs of a reversal if you’re bullish.
⸻
➡️ 3. Sideways Market – The Calm Before the Storm
• What is it?
Imagine a tug-of-war with evenly matched teams. The price moves back and forth in a narrow range without breaking decisively higher or lower.
• What drives it?
Uncertainty, indecision, or equilibrium between buyers and sellers.
• Trading tip:
Stay patient! Either look to trade range extremes (buying support and selling resistance) or wait for clear breakout signals to catch the next big move.
⸻
🔍 Pro Tip for Trend Analysis:
• Multi-timeframe analysis is key: Always check higher timeframes (weekly, daily, or hourly) to confirm the primary trend. Don’t let short-term noise mislead your trading decisions.
⸻
🚀 Why It Matters:
Aligning your strategies with the correct market trend significantly improves your odds. It’s like sailing with the wind at your back instead of battling against it.
Now, tell us in the comments: Which trend type do you find most challenging to trade?
Trade smarter. Trade clearer.