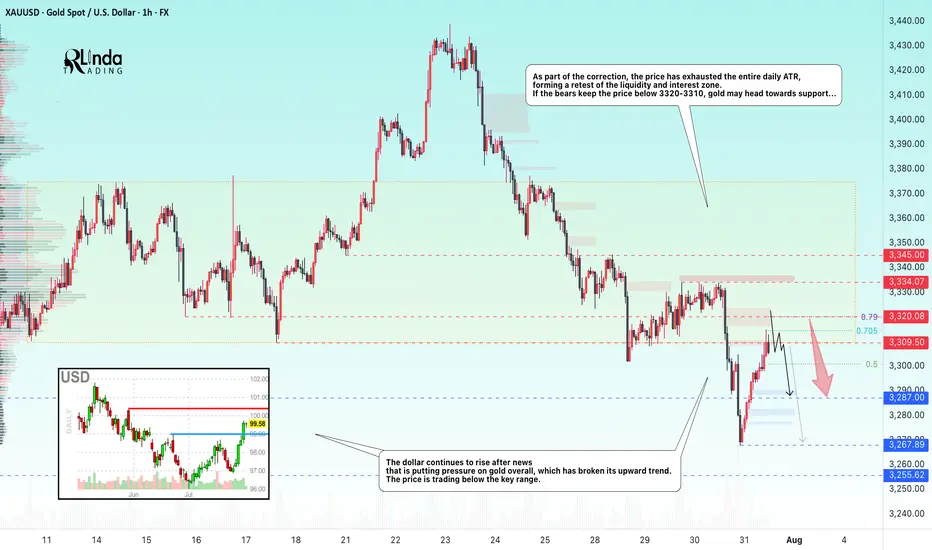
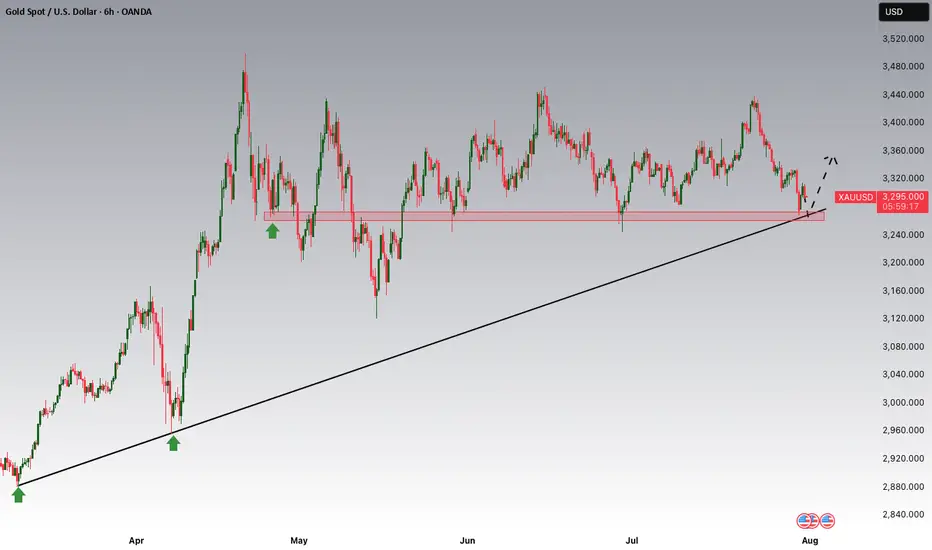
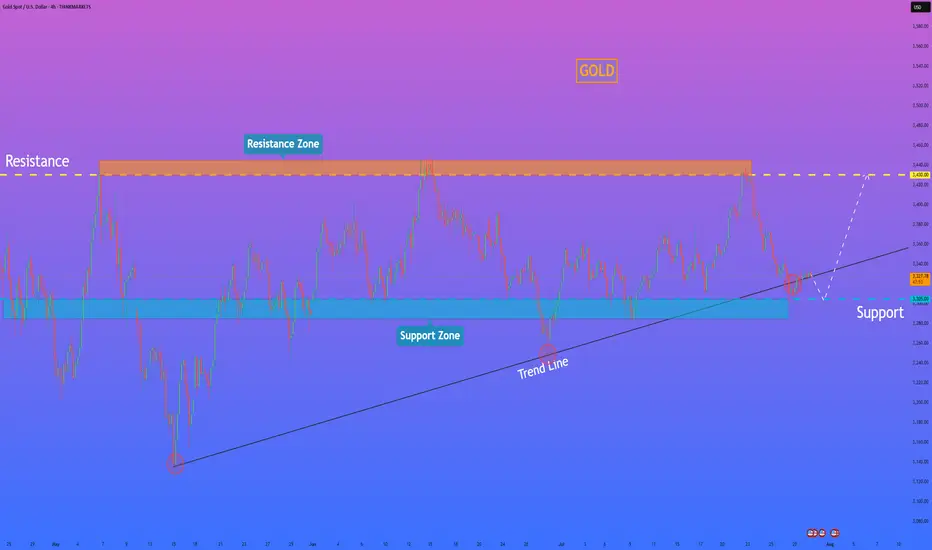
GOLD → Retest of resistance within a bearish runFX:XAUUSD breaks through the upward trend support amid a rallying dollar. Since the opening of the session, the price has been testing the zone of interest, but bears are quite aggressive...
Gold is partially recovering after falling to $3,268, a monthly low caused by the Fed's hawkish tone. The Central Bank kept its rate at 4.25–4.5% (9 votes to 2), highlighting uncertainty due to Trump's tariffs. Markets now estimate the probability of the rate remaining unchanged in September at 58% (previously 35%). The dollar's rise slowed amid concerns about the extension of the US-China trade truce and profit-taking ahead of key US employment data (after strong ADP and GDP reports). The nearest drivers are labor market statistics and trade news, while the technical picture for gold remains bearish.
Technically, on D1, the price is breaking key support zones, including the trend line, which overall only increases selling pressure on the metals market...
Resistance levels: 3310, 3320, 3334
Support levels: 3287, 3267, 3255
As part of the correction, the price has exhausted the entire daily ATR, forming a retest of the liquidity and interest zone. If the bears keep the price below 3320-3310, gold may head towards support...
Best regards, R. Linda!
Trend Lines
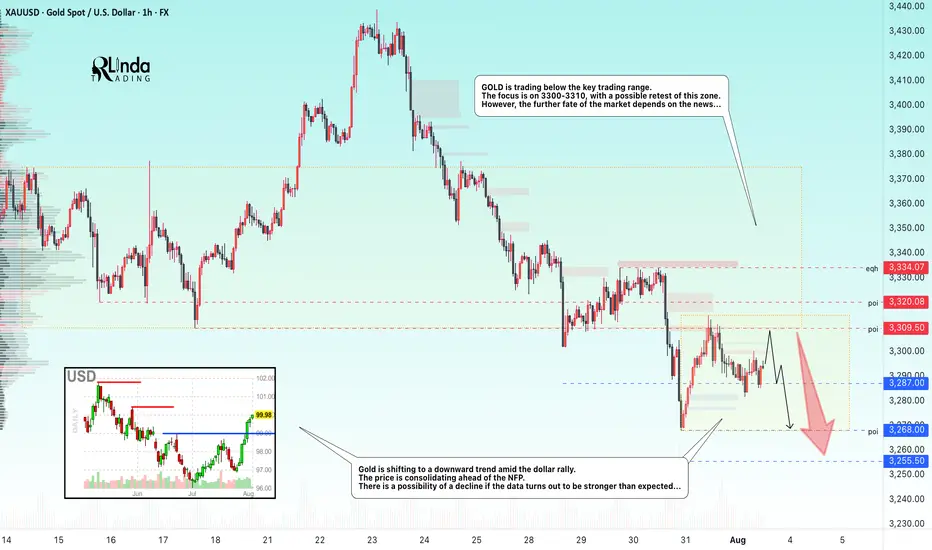
GOLD → The market is waiting for NFP. What could happen?FX:XAUUSD is bouncing off resistance at 3310, confirming the upper limit of the new trading range. The dollar continues to rally, but the market as a whole is stagnating ahead of upcoming news—NFP is coming up!
Gold is consolidating at monthly lows around $3268, awaiting key US labor market data (NFP). Trump's new tariffs (10% globally, 35% for Canada, 39% for Switzerland) have boosted demand for the dollar, putting pressure on gold. Markets are waiting for NFP: forecast +110K jobs, unemployment 4.2%. Weak data (<100K) → gold may rise to $3400. Strong (>150K) → the dollar will strengthen, gold will continue to fall. The probability of a Fed rate cut in September is <50%.
Based on yesterday's data, I would cautiously suggest that NFP will be in the range of 125K–145K, slightly above the consensus (110K). This will play into Trump's hands (I think you understand what I mean...).
Resistance levels: 3300, 3310, 3320
Support levels: 3287, 3268, 3255
The news has a negative nuance — unpredictability. Be careful.
Technically, based on the data we have at the moment, I would assume that the market may test resistance at 3300-3310 before a possible pullback to the specified support. BUT! Unpredictable data could turn the game around, and in that case, if the dollar falls, gold could start to rise.
Best regards, R. Linda!
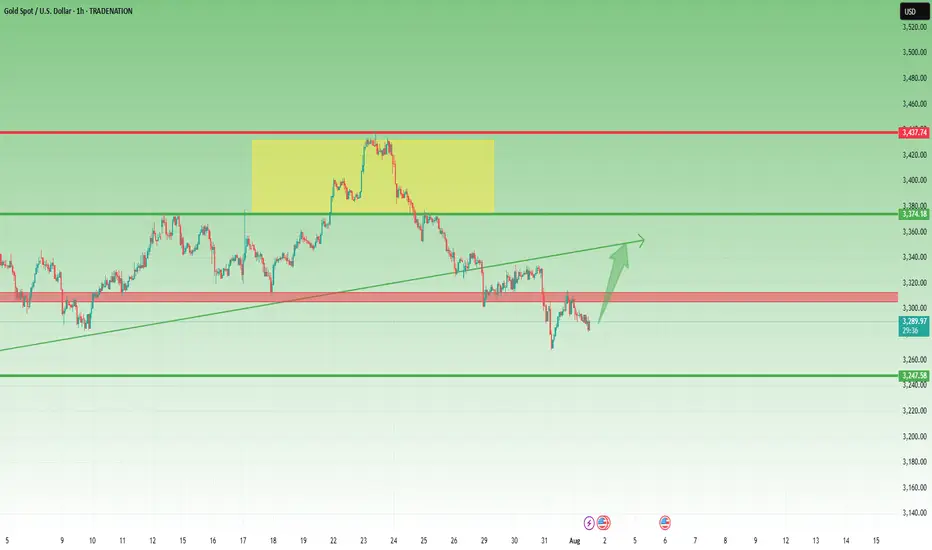
Gold Rejected at 3315 – But Bulls Might Not Be Done Yet📌 What happened yesterday?
During the Asian session, Gold printed a fresh local low at 3268, continuing the downtrend that already dropped over 1700 pips in just one week. However, that move quickly reversed, and we saw a natural corrective bounce.
📈 Resistance holds firm
The correction took price back up into the 3310 zone, which acted as confluence resistance. After two taps into that area, price failed to sustain above 3300, indicating sellers are still active there.
❓ Is the upside correction over?
I don't think so. The recent drop has been choppy, lacking the strong momentum of previous legs. This type of price action often signals that we are still within a correction, not in a clean continuation.
📊 What am I watching?
I’m actively monitoring for:
• Exhaustion signs on the downside
• Upside reversal signals
My plan is to open long trades only when I see confirmation, aiming for a move back toward the 3330 zone, which could act as resistance.
Disclosure: I am part of TradeNation's Influencer program and receive a monthly fee for using their TradingView charts in my analyses and educational articles.
Gold Potential UpsidesHey Traders, in today's trading session we are monitoring XAUUSD for a buying opportunity around 3,270 zone, Gold is trading in an uptrend and currently is in a correction phase in which it is approaching the trend at 3,270 support and resistance area.
Trade safe, Joe.
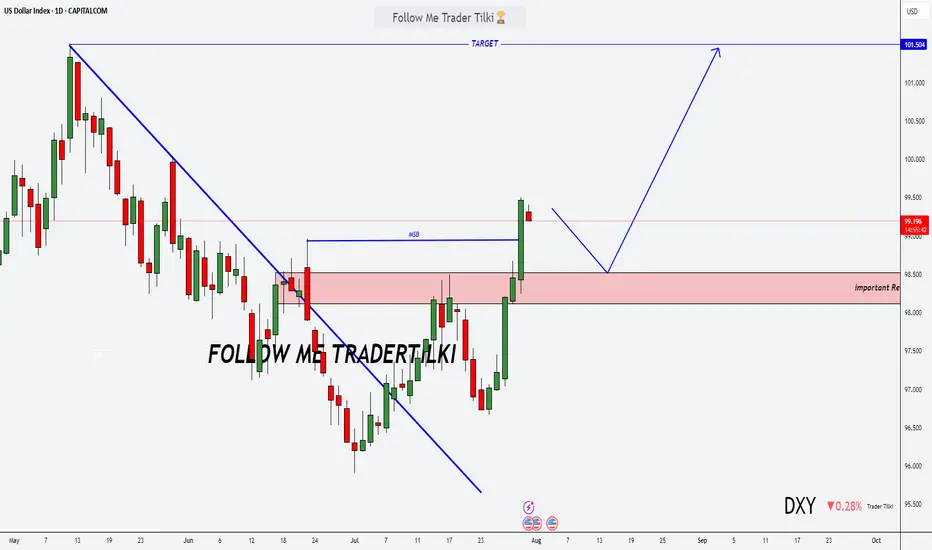
DXY Just Broke Through the Lock… Where’s the Market Headed Now?🌅 Good Morning, Friends!
A few days ago, I marked 98.950 as a key threshold for the DXY index. As of today, that level has officially been broken—and the bullish momentum we anticipated is now kicking in. 📈
The next target? 101.000.
That said, it’s crucial to remember: DXY is heavily influenced by fundamental data. Stay alert and keep a close eye on key economic developments—they’re essential for navigating this move.
This breakout validates the analysis I shared with you all. And it wasn’t just about charts—it was about discipline, precision, and timing.
Every single like from you is a huge boost to my motivation. Thanks from the heart—your support drives me to keep sharing these insights! 💙
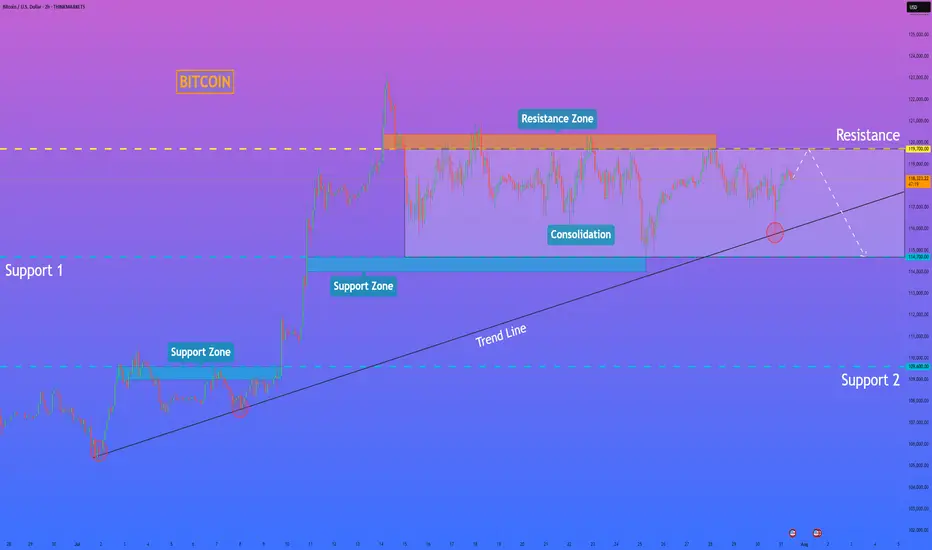
HelenP. I Bitcoin will rebound down from resistance levelHi folks today I'm prepared for you Bitcoin analytics. A technical review of the chart reveals a prolonged period of horizontal consolidation, during which the price has been trading within a well-defined range between support at 114700 and resistance near 119700. This phase of balance follows a significant prior uptrend, and a major ascending trend line is currently intersecting this range. My analysis for a short position is based on the expectation of a final 'test and fail' at the top of this consolidation. I believe the price will make one more attempt to rally towards the resistance zone around 119700. A strong rejection from this area, demonstrating sellers' control, would serve as the main confirmation for a bearish bias. Such a rejection would likely initiate a powerful downward move across the range, with sufficient momentum to break the critical ascending trend line. This would be a significant structural event, signaling a potential reversal of the larger trend. Therefore, the primary goal for this scenario is logically set at the 114700 support level, the bottom of the consolidation range. If you like my analytics you may support me with your like/comment ❤️
Disclaimer: As part of ThinkMarkets’ Influencer Program, I am sponsored to share and publish their charts in my analysis.
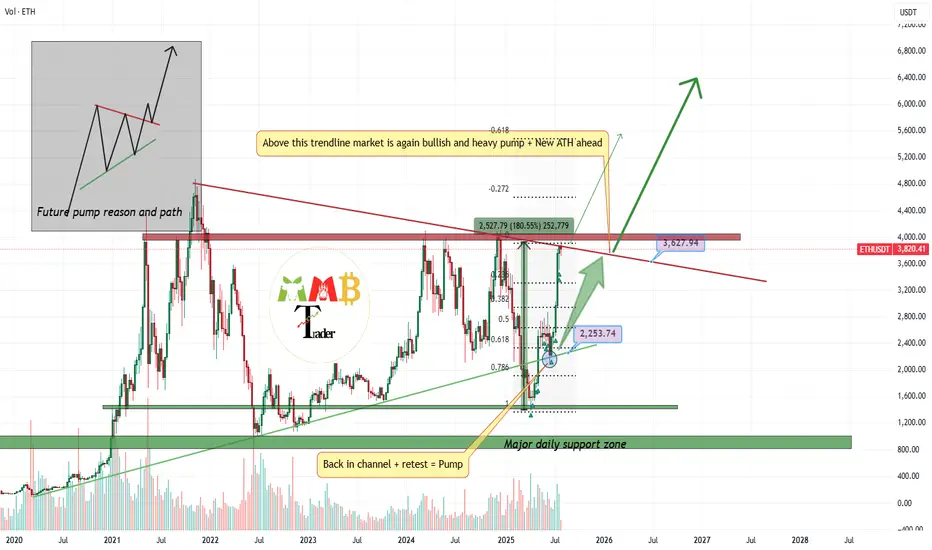
4000$ is last resistance left Ready for breakout and pump?market is still bullish and i am looking for breakout here to the upside for sure But we should consider this factor that major resistance now is touching and we may have first short-term fall.
so for now we may have correction and dump to the targets like 3300$ which is first support of 0.23 Fibonacci level.
and after this healthy correction or without it we can expect more pump and breakout of 4K$ and heavy pump to the targets like 7K$.
DISCLAIMER: ((trade based on your own decision))
<<press like👍 if you enjoy💚
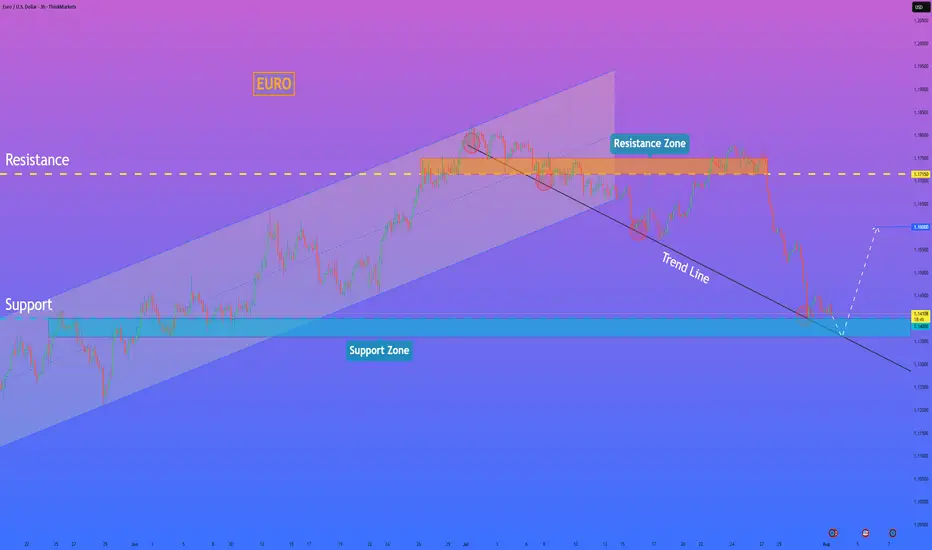
HelenP. I Euro will rebound from trend line to $1.1600 pointsHi folks today I'm prepared for you Euro analytics. A structural review of the chart shows a clear change in market character. The previous long-term upward channel has been broken, and the price has since entered a corrective phase, currently guided by a descending trend line. This decline has brought the asset towards a critical area of interest: the major horizontal support zone between 1.1400 and 1.1360. My analysis for a long, counter-trend position is based on the potential for a strong bullish reaction from the confluence of this historical support zone and the descending trend line. I believe that as the price reaches this intersection, the current selling momentum is likely to be absorbed by significant underlying demand. The main condition for this scenario is a clear and forceful rejection of lower prices from this zone, which would signal that buyers are stepping in to defend this critical level. A confirmed bounce would likely initiate a significant relief rally, and therefore, the primary goal for this move is set at the 1.1600 level, a logical first target for a corrective bounce of this nature. If you like my analytics you may support me with your like/comment.❤️
Disclaimer: As part of ThinkMarkets’ Influencer Program, I am sponsored to share and publish their charts in my analysis.
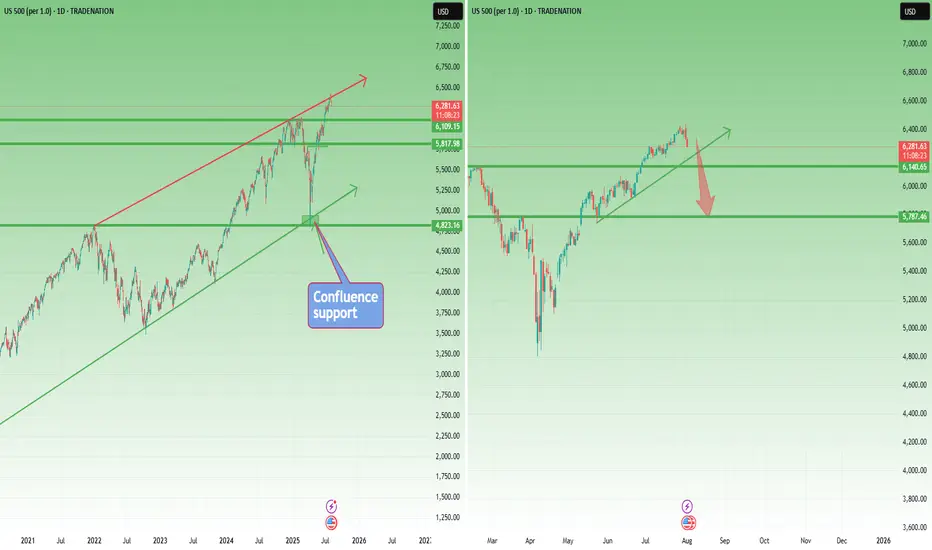
Correction Ahead? SP500 Prints Reversal Signal at Key Resistance📘 This market moves like a textbook chart
SP500 is acting like a perfect case study from a trading manual. Back in early April, the index dipped just below 5,000, right into a confluence support zone ( I had spoken about this at the time ) – formed by the long-term ascending trendline and the 2022 all-time high. Just like other U.S. indices, the market reversed aggressively from that area.
🚀 A 30% rally in 4 months
From that low, SP500 rallied around 30% in just four months. An incredible move that brought the index straight to the upper boundary of the yearly rising channel.
🕯️ Bearish signal at the top
And just like in NAS100’s case , the index printed a strong Bearish Engulfing candle exactly at that resistance level. This kind of signal, after such a rise, shouldn’t be ignored.
📉 A correction is not only probable – it’s needed
A pullback from here is not just likely, but in my opinion, healthy and necessary . Short-term speculators could look for a move toward the 6,150 zone, which would already offer decent room for profit.
🔍 What if it goes deeper?
I wouldn’t be surprised to see a correction down to 5,750–5,800. That’s about a 10% decline, which wouldn't even classify as a bear market, just a normal reset after a euphoric rally.
🧠 Perspective matters
In a market that gained 30% in four months, a 10% correction is not a crash — it’s discipline being restored.
Disclosure: I am part of TradeNation's Influencer program and receive a monthly fee for using their TradingView charts in my analyses and educational articles.
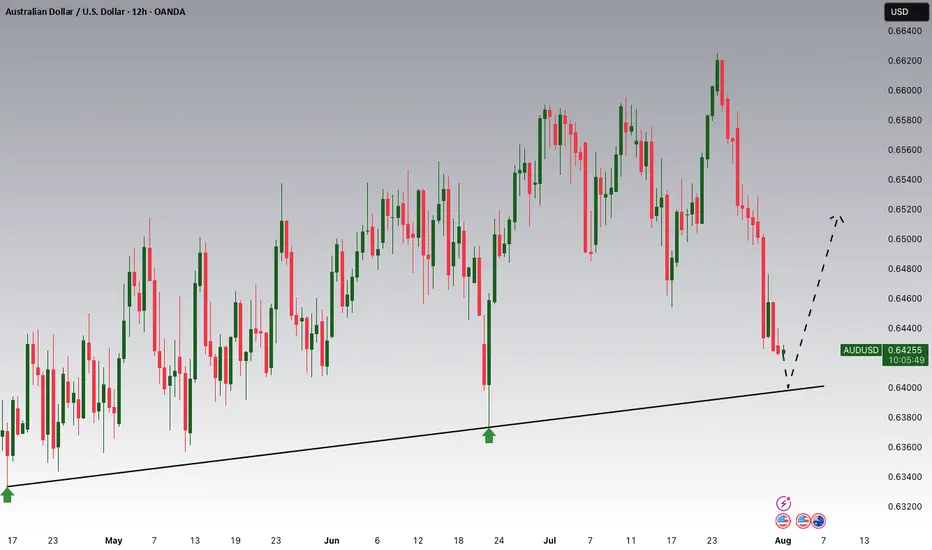
AUDUSD Potential UpsidesHey Traders, in today's trading session we are monitoring AUDUSD for a buying opportunity around 0.64000 zone, AUDUSD is trading in an uptrend and currently is in a correction phase in which it is approaching the trend at 0.64000 support and resistance area.
Trade safe, Joe.
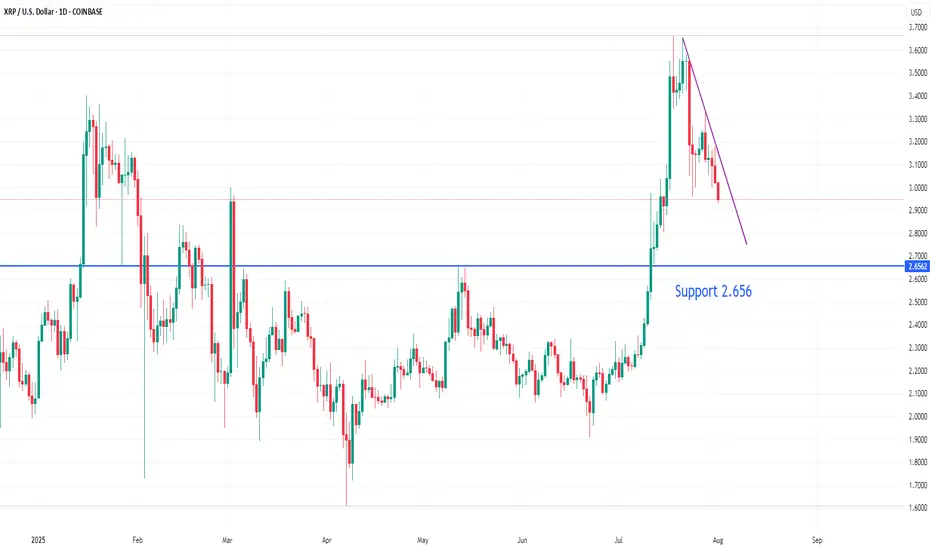
XRPUSDT → Range formation. Retest of resistanceBINANCE:XRPUSDT.P , after a false breakout of the daily resistance level of 3.352 and the elimination of traders, has entered a correction phase. The trading range shown below has been formed, with an emphasis on resistance...
XRP previously formed a false breakout of the daily resistance level of 3.352, as indicated in the idea above. After changing its market character, the price entered a correction phase. Focus on the range of 3.00 - 3.264. A retest of resistance (zone of interest and liquidity) is possible before falling to 3.161, 3.05 or to the liquidity zone of 3.00. There are no technical or fundamental reasons for exiting the consolidation; most likely, a retest of the zone of interest may end in manipulation and a pullback to support...
Resistance levels: 3.1609, 3.264, 3.352
Support levels: 3.05, 3.00
I do not rule out the fact that a retest of the 3.264 resistance level may have a breakout structure and the price will continue to rise, but based on the price behavior pattern on D1, the market structure, and market stagnation, I conclude that at the moment, the chances of seeing a correction from resistance are higher. Further developments will need to be considered after the retest of key zones on the chart...
Best regards, R. Linda!

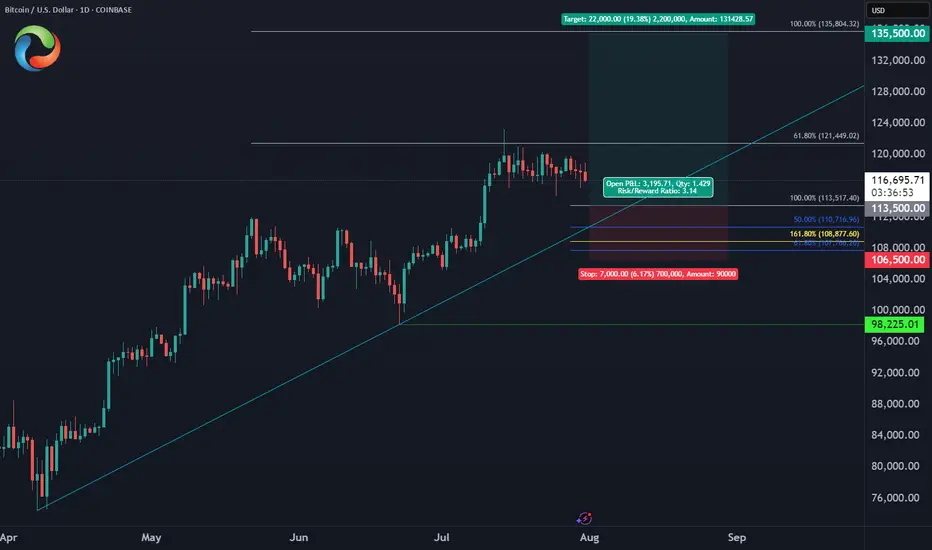
Bitcoin August Trade PlanBINANCE:BTCUSD
✅Entry Zone: $113,500 - $110,700
⛔️Stop: $106,500 (below June low)
🎯Target: $135,500 (ATH liquidity)
🔖Risk/Reward: 1:3
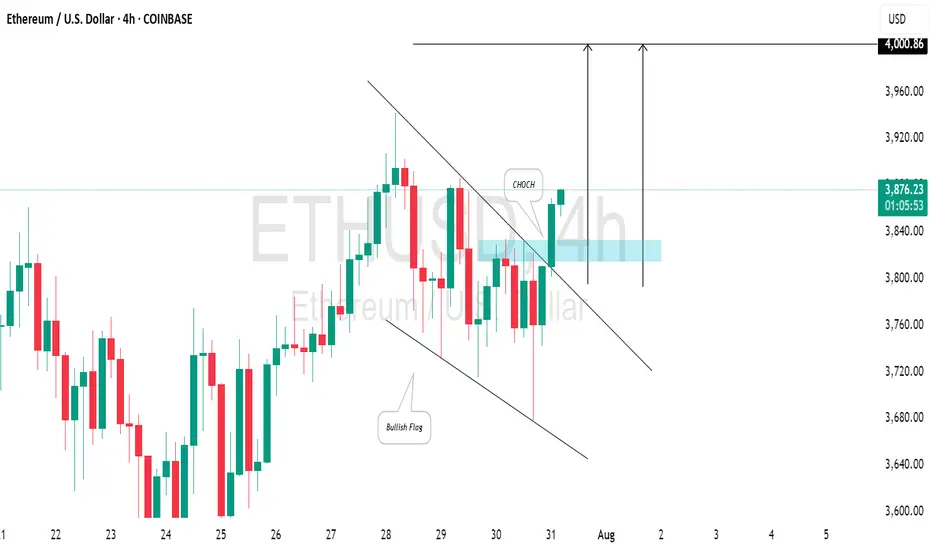
ETHEREUM (ETHUSD): Strong Bullish SignalsI spotted 2 important price action confirmations on 📈ETHEREUM:
The price has surpassed a resistance line of a bullish flag and established a confirmed change of character (CHoCH) on the 4-hour chart.
I believe the market will maintain a bullish trend, with the next resistance at the 4000 level.
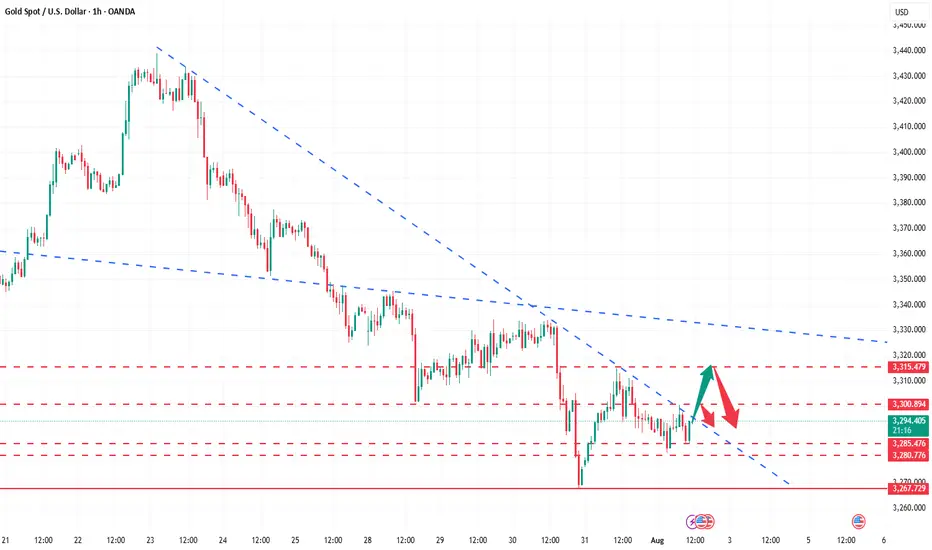
The idea of shorting on rallies below 3315 remains unchanged.Gold remains generally weak, with multiple rebounds showing signs of fatigue. The upward moving average continues to suppress prices, indicating that the bearish trend remains intact, and the short-term market outlook remains bearish. Trading strategies remain bearish today, with a key focus on the 3300-3315 area, a key short-term resistance zone. If the market rebounds before the US market opens and approaches this area, or if a clear topping signal appears near this range, consider entering a short position. Today will see the release of the non-farm payroll data, which may influence the market's trajectory. We recommend prioritizing short-term trading before the release, and reconsidering the market's direction based on market feedback after the release. Structurally, gold continues to exhibit a volatile downward trend, with lower highs and lower lows. Today's low is expected to be lower than yesterday's. Short-term short positions are focused on 3285-3280, with a break below this level potentially allowing for further declines. Please carefully time your entry, strictly implement risk management, and avoid emotional trading.
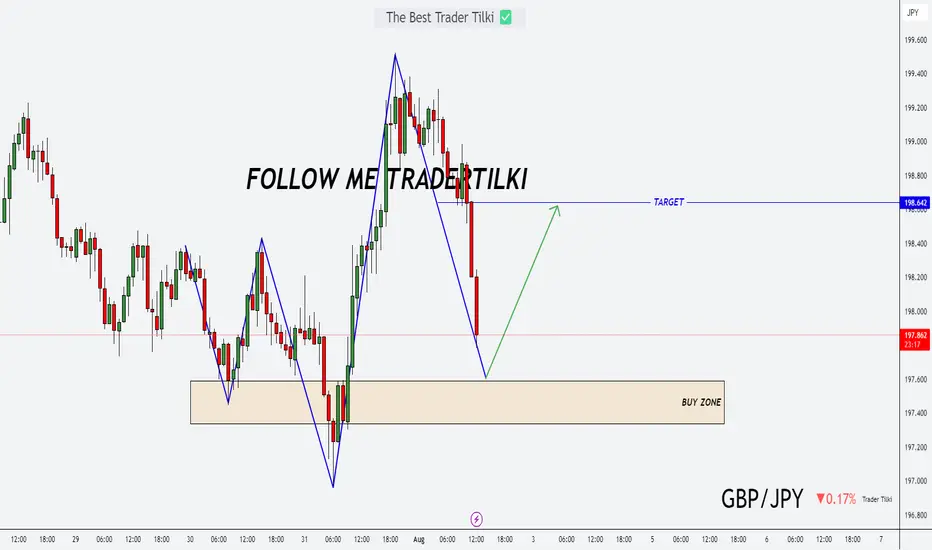
Today’s Opportunity: Stay Sharp on GBPJPY!Hey friends,
Here's my latest analysis on GBPJPY.
📌 Buy Entry Zone: 197.590 - 197.336
🎯 Target Level: 198.642
📅 Today, major economic data will be released from the U.S.
Make sure to factor this into your fundamental analysis.
📊 It’s not just about the charts—fundamentals matter too.
Technical + Fundamental = Powerful outcomes ✅
💬 Every like and bit of support keeps me going.
Thanks so much to everyone backing this journey! 🙌
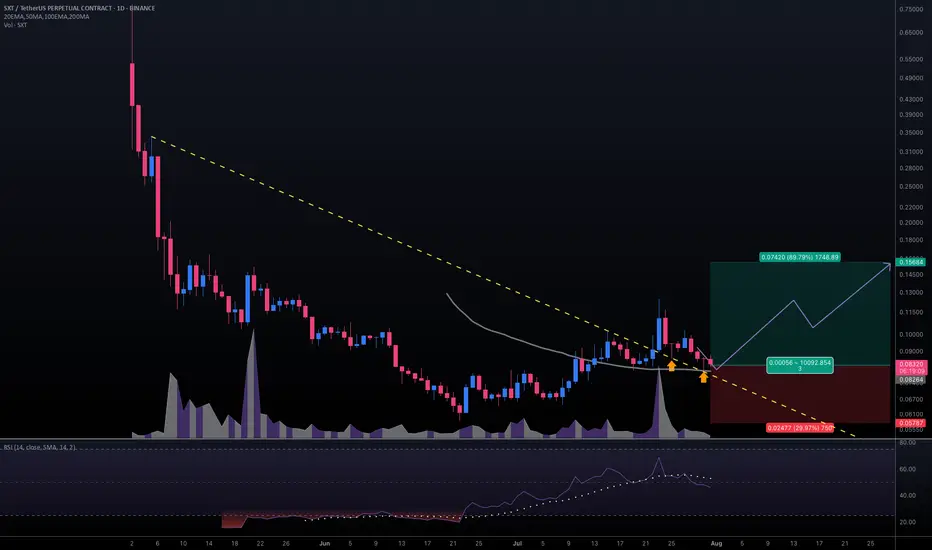
#SXTUSDT #1D (Binance Futures) Descending trendline break retestSpace and Time (SXT) pulled back to 50MA daily support, looks ready for mid-term recovery after those two dragonfly dojis in a row.
⚡️⚡️ #SXT/USDT ⚡️⚡️
Exchanges: Binance Futures
Signal Type: Regular (Long)
Leverage: Isolated (2.0X)
Amount: 5.0%
Entry Targets:
1) 0.08264
Take-Profit Targets:
1) 0.15684
Stop Targets:
1) 0.05787
Published By: @Zblaba
NYSE:SXT BINANCE:SXTUSDT.P #1D #SpaceAndTime #ZK #AI #DPoS spaceandtime.io
Risk/Reward= 1:3.0
Expected Profit= +179.6%
Possible Loss= -59.9%
Estimated Gaintime= 1 month
XRPUSD downside target 2.656On the daily chart, XRPUSD has retreated from its highs, with short-term bears dominating. Currently, the price is in a downward trend, so shorting near the downtrend line resistance is recommended, with a target around 2.656.
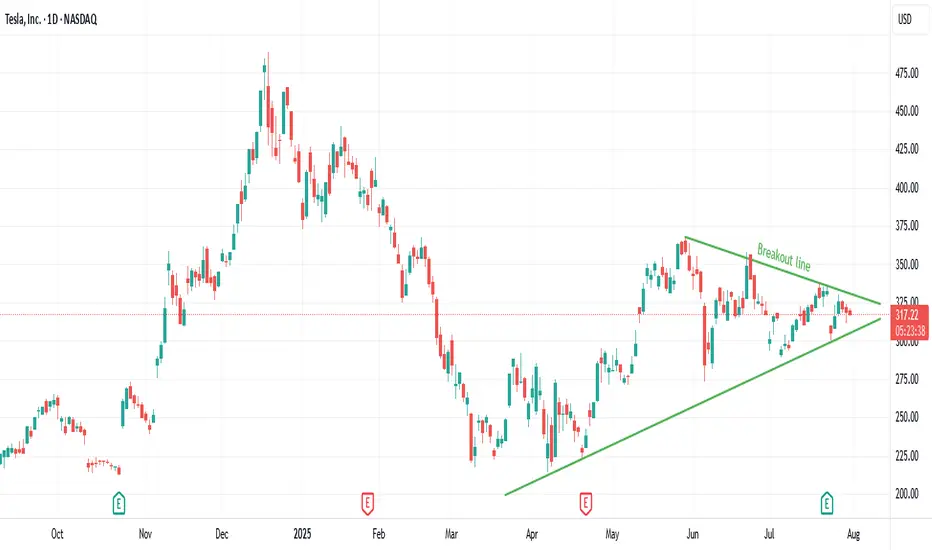
TSLA Breakout Watch: Symmetrical Triangle Squeeze!Trade Summary
Setup: Symmetrical triangle pattern tightening since March; volatility compression signals an imminent breakout.
Entry: On daily close above the triangle resistance (~$324)
Stop‑loss: Below triangle support (~$305)
Targets:
• Target 1: $375
• Long-term: $500+
Risk/Reward: ~2.5–3:1 (Initial target), higher for long-term hold
Technical Rationale
📈 Symmetrical triangle: Clear converging trendlines; price nearing apex after months of higher lows and lower highs
🔔 Volatility squeeze: Range compression increases odds of explosive move
⏳ Daily timeframe: Signals a swing/position trade opportunity with significant upside
Catalysts & Context
⚡️ Earnings season ahead could trigger a breakout
🌱 EV sector momentum and renewed tech leadership
🏦 Analyst upgrades and potential for macro rate cuts
Trade Management Plan
Entry: Wait for a daily close and volume confirmation above $324 resistance
Stop-loss: Tight initial stop below $305; trail to breakeven after breakout confirmation
Scaling: Partial profits at $375; let remainder run for $500+ if momentum continues
Poll
What’s your view? Are you watching TSLA? Comment below or vote:
🔼 Bullish
🔽 Bearish
🔄 Waiting for confirmation
Follow us for daily high-probability setups & real-time trade updates!
Disclaimer: Not financial advice. Trade at your own risk.
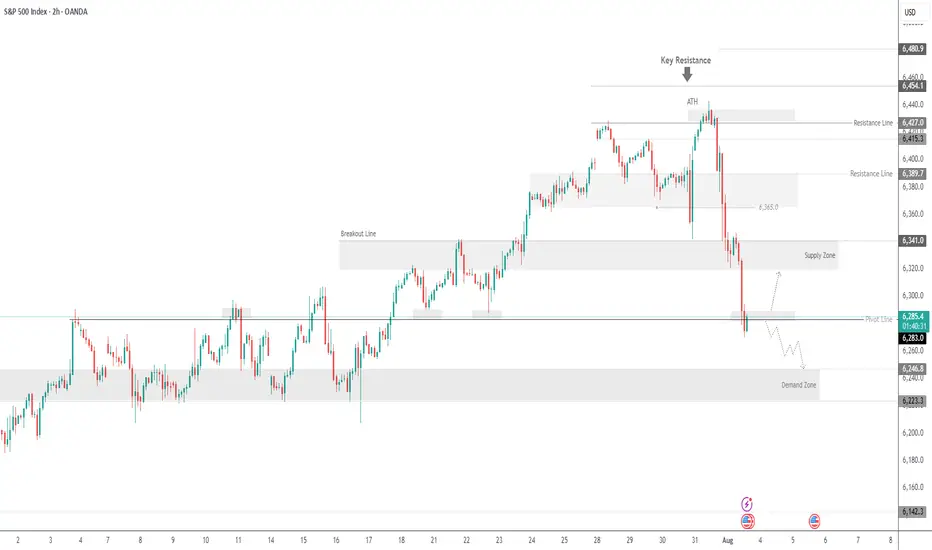
SPX500 Dips Ahead of NFP as Tariff Risks RiseSPX: S&P 500 Dips to Close July — Still Positive for the Month Amid Tariff Tensions & Fed Uncertainty
The S&P 500 retreated in the final session of July, weighed down by renewed tariff concerns and lingering uncertainty around the Fed’s next move. Despite the late pullback, the index remains positive for the month overall.
Looking ahead, non-farm payrolls (NFP) and U.S. jobs data are expected to have a strong impact on market direction. In addition, August 1st marks a key date for potential tariff developments, which could trigger further volatility.
Technical Outlook – SPX500
The index has dropped approximately 2.5% since yesterday and maintains a bearish bias as long as it trades below 6283. If the price continues to slide, the next downside target is 6246, with further support at 6223.
However, if the price manages to close above 6289 on the 1H timeframe, it could trigger a bullish recovery toward 6320 and 6341.
Pivot Line: 6283
Support Levels: 6246 • 6223
Resistance Levels: 6320 • 6341
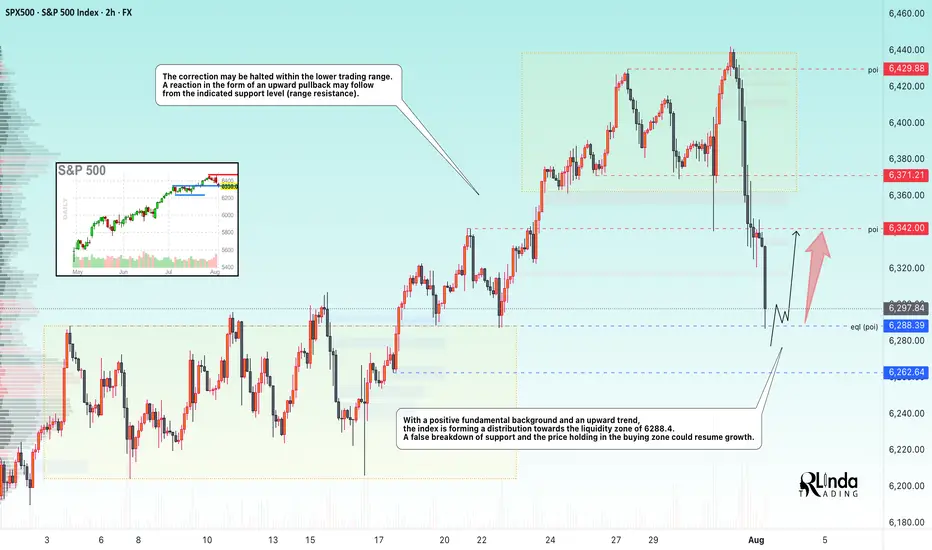
SP500 → Countertrend correction before growthFX:SPX500 is correcting against an upward trend. In the second half of the week, the market received fairly positive fundamentals during the reporting period.
S&P 500 futures found support after strong reports from Meta and Microsoft, which exceeded earnings expectations and forecasts thanks to AI. The rise in futures supported demand for the “Magnificent Seven” despite Powell's hawkish comments. The focus is on Apple and Amazon reports in the evening, which could strengthen the tech rally. On Friday, we are seeing a countertrend correction in which the market is testing the 6288 zone of interest.
Support levels: 6288.4, 6262.6
Resistance levels: 6342, 6371
Most likely, the market will form a false breakout of support during the correction. If the bulls keep the index above the key level, we can expect continued growth in the short and medium term.
Best regards, R. Linda!
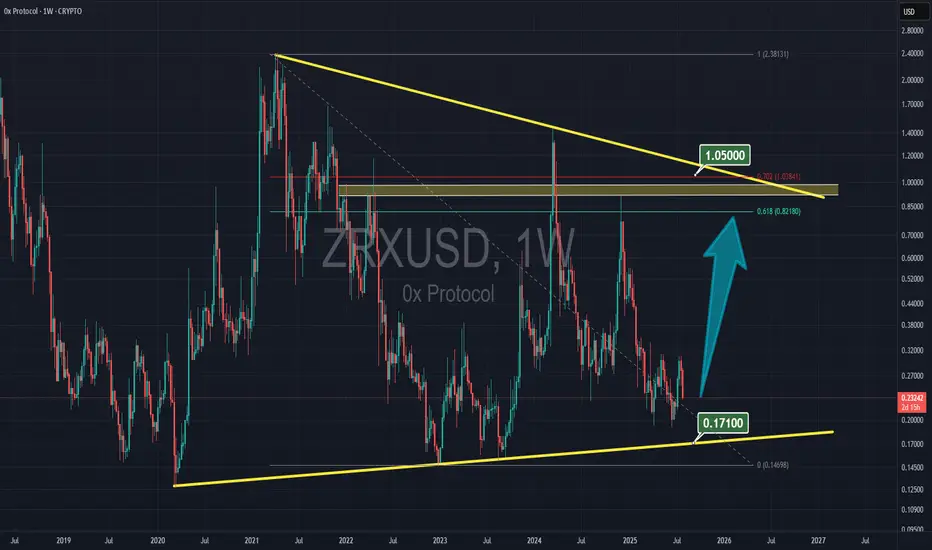
ZRX to $1 ZRX is consolidation at the very bottom price, and with alt-season hopefully get a rally to $1
HelenP. I After correction to support level, Gold start to growHi folks today I'm prepared for you Gold analytics. An examination of the chart highlights a well-established long-term uptrend, with the bullish structure being clearly defined by a major ascending trend line that has consistently provided dynamic support. Currently, the price is undergoing a healthy correction after being rejected from the major resistance zone around 3430. This pullback is now guiding the price towards a critical confluence of support, where the aforementioned ascending trend line intersects with a strong horizontal support zone at 3305 - 3285. My analysis for a long position is based on the high probability of a bullish reaction from this key area. I believe that as the price enters this support confluence, it will be met with strong buying pressure, as it represents a logical point for buyers to defend the trend. A confirmed bounce from this zone, demonstrated by a rejection of lower prices, would be the main condition to validate the continuation of the uptrend. Therefore, the primary goal for the subsequent rally is set at the 3430 resistance level, as a retest of the recent high is the most logical objective following a successful defense of the trend. If you like my analytics you may support me with your like/comment ❤️
Disclaimer: As part of ThinkMarkets’ Influencer Program, I am sponsored to share and publish their charts in my analysis.
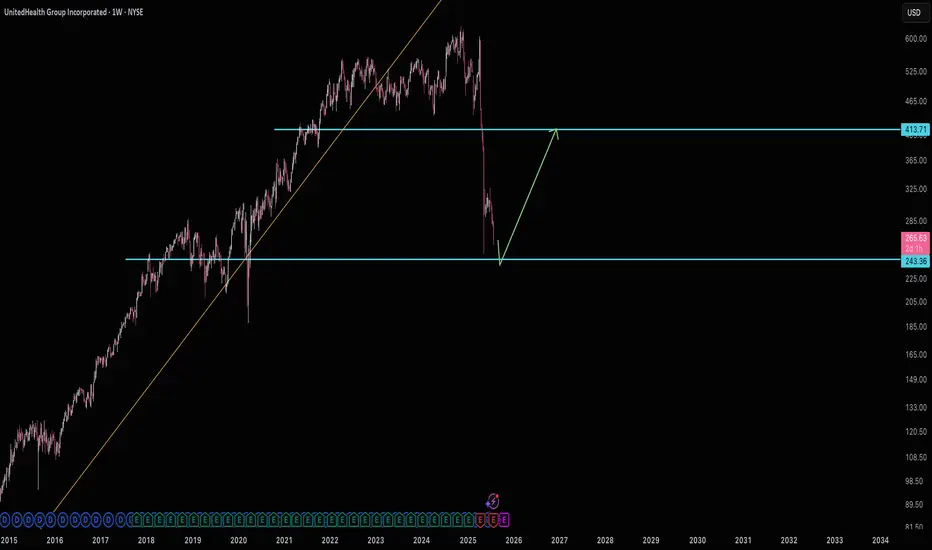
Waiting for $243 United HealthUNH has obviously taken a beating. It's managed to get so close to support many a few times now, yet hasn't hit yet. So if $243 does hit, then plan on targeting $410.
Good luck!