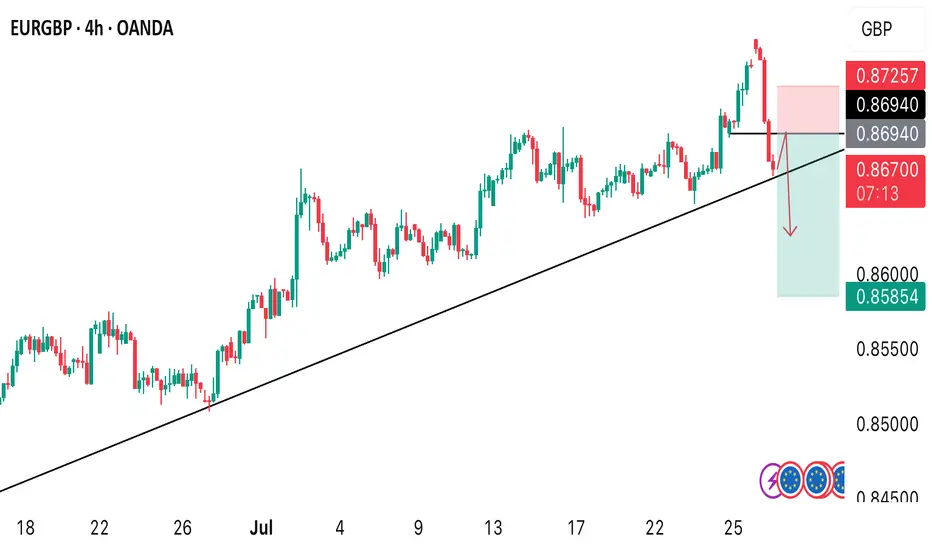
EUR/GBP sell opportunity confirmed!EURGBP plummeted over 0.76% today from its high. It’s now confirmed that we could experience a correction on the weekly high. A sell opportunity is envisaged from the H4 timeframe.
Trend Lines
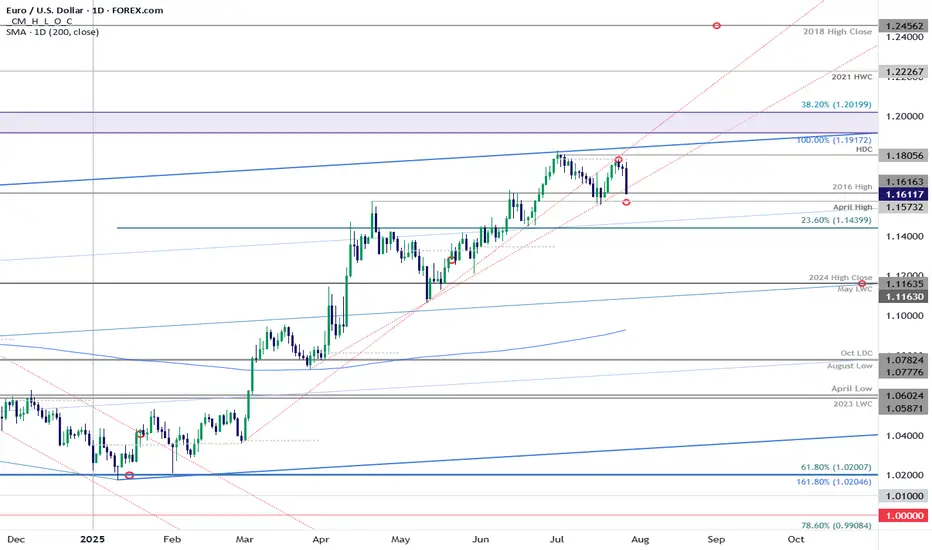
EUR/USD: Euro Poised for Monthly Range Breakout Ahead of FedEuro defended resistance at the monthly opening-range high / July open at 1.1787-1.1805 last week with price plunging back into support today at the late-February trendline / 2016 high at 1.1616.
Medium-term bullish invalidation rests with the April high at 1.1573 and a close below this level would suggest a more significant high is in place / a larger correction is underway. Stay nimble here into the monthly-cross and watch the weekly closes for guidance.
-MB
3300 may fall below, possibly setting a new low#XAUUSD
From the daily chart perspective, gold has a tendency to form a converging triangle, and observing the technical indicators of the daily chart, the downward trend may have just begun📉.
So, how should we plan for the evening?📊 Now there are certainly many outside buyers who will continue to increase their positions and try to recover their losses💰. So, should we continue to be long?📈 My opinion is to wait and see.👀 If the daily chart does not fall below 3300 points, it will consolidate between 3300 and 3350 points in the future. If it falls below 3300 points, we will next focus on the support level of 3295-3285 points, and then consider whether to go long🤔.
If you are more aggressive, you can consider going long near 3305 points and exit after earning $10-20. All opinions have been informed and everyone can choose to adopt them according to their own circumstances.😄
How to plan for the evening, pay attention to the 3300 markAfter the shorts took profits, gold consolidated in the 3310-3300 area. Judging from the daily chart, the decline in gold seems to have just begun, with the middle track of the Bollinger Band at around 3345 and the lower track at 3285. The possibility of falling below the 3300 mark cannot be ruled out in the evening. If gold falls below the 3300 mark, it may first hit 3295. If the decline continues, it may even hit the low of 3285-3275 below. However, if the 3300 mark can be effectively defended, then the possibility of maintaining the consolidation of 3300-3345 in the evening may be maintained. Therefore, it is not recommended to easily participate in transactions at the current position in the evening. It is mainly advisable to wait and see and pay attention to the breakthrough of the 3300 mark.
My premium privileges are about to expire, and subsequent trading strategies and analysis will be published in the group.

Gold short-term bearish
From the Bollinger daily line, as shown in the figure below, the gold price should still test the lower track of $3,280 in the future. The short-term upward trend line has also been broken, and this yellow line has now become a pressure.
From the moving average system, the daily line is chaotic, and the gold price goes up and down without order and rules to cross the moving average, so the daily moving average system has no reference significance. From the weekly line, the gold price has the need to step back on the 20-week moving average of $3,277 to $3,280.
So, if I look at the bearish, I can only see $3,277 to $3,280. No deeper decline can be seen, and no more signals appear. Therefore, shorting is relatively short. Or it is short within the daily Bollinger track, not structural short or trend short. Everything has a law, just oscillation.
So, I think that even if there is a short in the future, it is the end of the short. It is the right way to stop when you see good results. Even though the current gold price has fallen due to the short-term positive tariff negotiations between Trump, Japan and the European Union, the tariff level is still much higher than before, which will undoubtedly bring more uncertainty to future economic growth. Many other factors are not conducive to a sharp drop in gold prices. The overall situation is that the basic trend of gold price increases is intact.
Therefore, the high point of $3345.30 has become the watershed between long and short positions. You can use this as the dividing line for long and short operations. There is nothing wrong with setting a loss above $3345.30 to short in batches. There is nothing wrong with placing a long position at 3346. The market trend is very uncertain, so it all depends on what order you want to make.
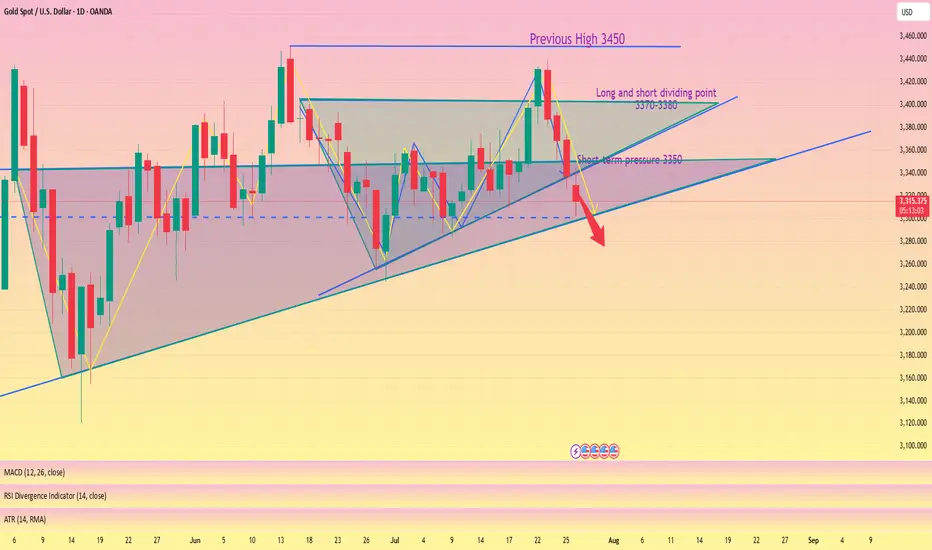
Monday market forecast and analysis ideas#XAUUSD
There will be a lot of data next week, such as the 8.1 tariff deadline that I have repeatedly emphasized, the Federal Reserve decision, NFP data, etc. It can be said that it is relatively difficult to analyze purely from a technical perspective, because there is uncertainty in many data, the data results are often non-linearly correlated with market reactions (good news does not necessarily lead to a rise, and bad news does not necessarily lead to a fall), and large fluctuations can easily form oscillating K-lines with long upper and lower shadows. Therefore, the first arrangement for next week is to participate in trading with a light position and avoid letting emotions control your thinking.
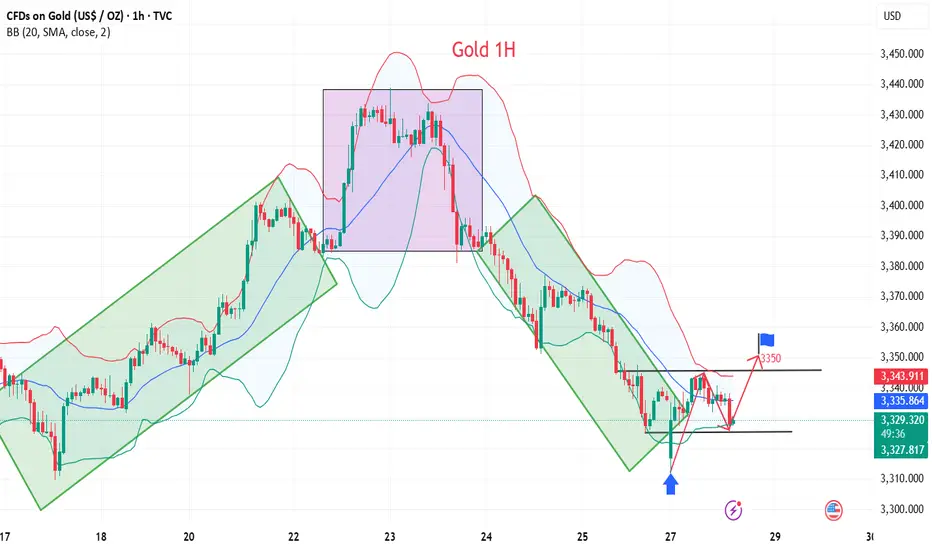
The closing price on Friday was near 3337, proving that the short-term judgment on the rebound momentum of gold is correct, so there are two possible situations on Monday.
1. The first thing we need to pay attention to is 3345-3350 to determine whether it constitutes a short-term pressure level. The weekly line closed with a negative cross star. Combined with the monthly line trend, in terms of support, focus on the trend line support near this week's low of 3325. If this position is not broken, the market is expected to usher in a wave of rebound; if it falls below 3325, the bottom may look to 3310 or even 3295 for support.
2. The rebound momentum of Friday continued on Monday, breaking through 3350 first, and then it is possible to reach the previous high resistance area of 3370-3380. If it encounters resistance here, gold will continue to fall and fluctuate, and the target may even be 3310. If the price remains strong and issues such as interest rate cuts and tariffs are imminent, it means that the short-term downward trend has ended and may even set a new high.
The above content is only a forecast for Monday’s market. It will be greatly affected by data and news, and may be adjusted in real time next week based on intraday trends. You can refer to this, but remember not to be swayed by emotions. We will participate with a light position, and the specific trading strategy can wait for my trading signal.
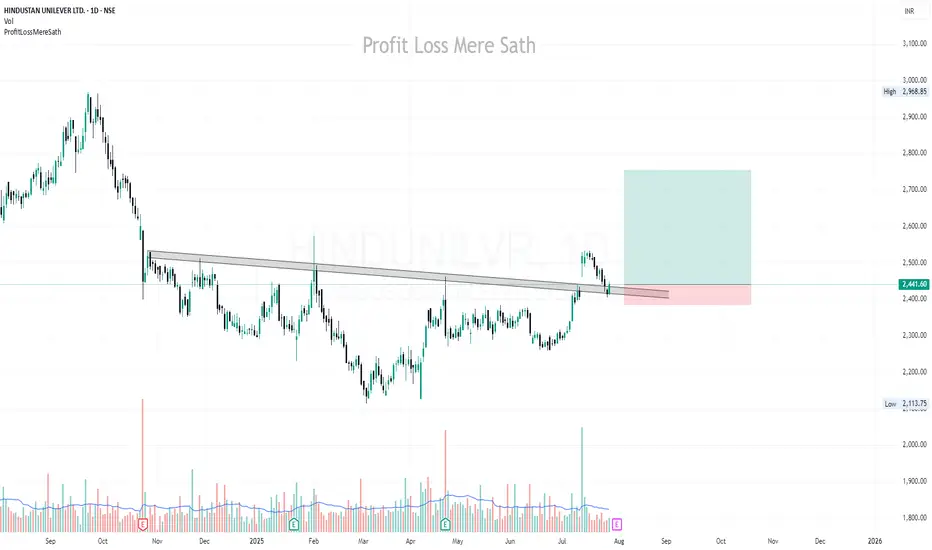
HINDUNILVR | Buy @LTP | SL below 2385 | Target 2755Disclaimer:
This is not financial advice. Please do your own research or consult with a financial advisor before making any investment decisions. Investments in stocks can be risky and may result in loss of capital.
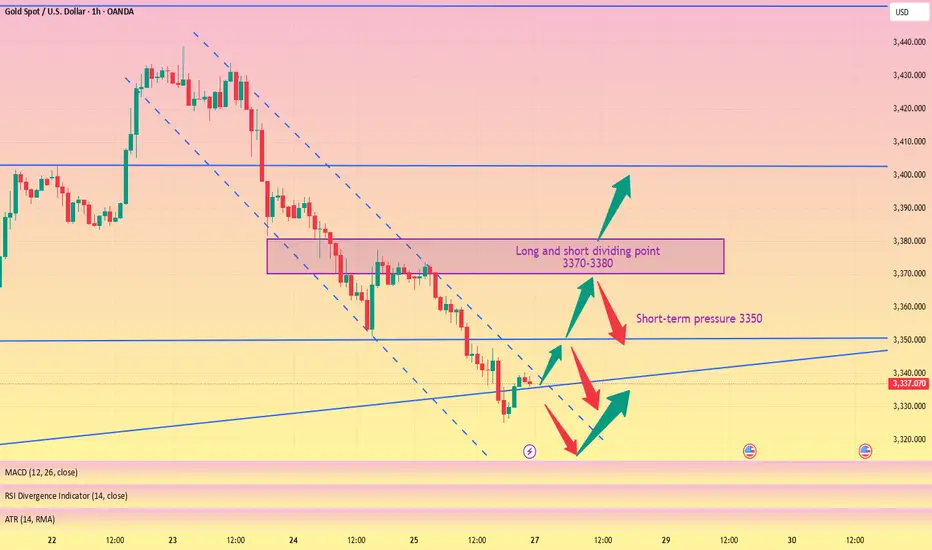
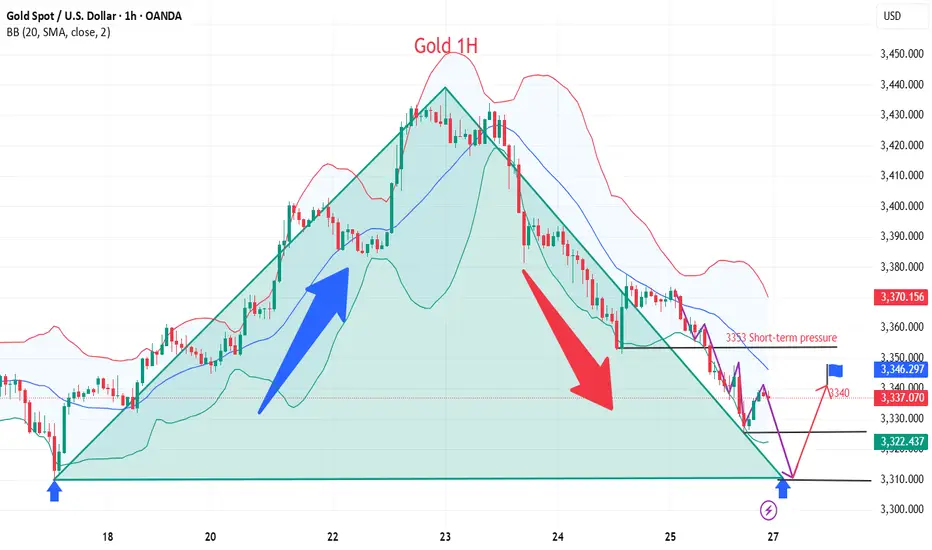
Pay attention to 3350 gains and lossesGood morning, bros. This morning gold again tested last week's low near 3325. From the chart, gold may continue to rise this week, with tariffs approaching, the Fed's interest rate cut, and NFP data imminent. The current strength and weakness are at 3350-3355. If it can effectively break through and stand above, it is expected to continue to test the previous high point, which is also the long-short dividing point of 3370-3380.
From the daily chart, there is not much change in the operational range of gold in the short term, and the change in the 4H chart is more obvious. After the decline in the early trading, it is now rebounding. There is a possibility of closing positive at the low. If it is directly positive on Monday, then it will bottom out directly at the beginning of the week. If it refreshes the low on Monday, the low point of 3285 will be seen below. Therefore, today's market focuses on the continuity of long and short. Of course, according to the current changes, the biggest possibility is to continue to rebound at the low point, pay attention to the support of 3310-3300 below, and pay attention to the gains and losses of the high point of 3355 above.

Critical Pivot level on GoldWith respect to market structure, the focus was to observe how the 4hr structure evolves after heavy sell pressure last week. So far bullish structure is still active with no BOS or Choch on the 4hr.
However, on the 4hr 2 candles closed outside the master trend line - Downside Caution observed!
The focus now is on the daily close relative to weekly and daily support. Buyers defended key weekly level @ 3325 which confluences with weekly 9EMA, Master trend line daily 50 EMA.
As long as Daily candles hold on @ 3325, next leg up will be to fill the upper master trend line. This sequence would see price squeeze for a breakout in the coming weeks.
Bias is long to form a support at 3340 where multiple Daily POC emerged in the past

Gold short-term rise waiting for breakthrough
💡Message Strategy
During the Asian trading session, gold prices rebounded slightly from $3,320, filling the short gap at the start of the new week. As investors chose to stay on the sidelines before the Fed's two-day monetary policy meeting, the bullish force of the US dollar temporarily weakened, providing support for gold, an interest-free asset.
However, with the 15% tariff agreement between the United States and Europe and the positive progress of trade easing between the United States, Japan and the United States, market risk appetite has rebounded, weakening the appeal of gold as a safe-haven asset.
According to market surveys, "The current optimistic atmosphere of trade has weakened the safe-haven demand for gold, while the weakening of the US dollar has provided support for gold prices. The two forces offset each other, causing gold to fluctuate."
Investors are focusing on the FOMC meeting to be held on Tuesday. Although Trump continues to pressure the Fed to cut interest rates, the market generally expects that the interest rate will remain unchanged at this meeting because the US labor market remains strong.
In addition to the interest rate decision, this week will also usher in the US second quarter GDP estimate, PCE price index and non-farm payrolls report, all of which may have a significant impact on gold.
📊Technical aspects
From the technical trend, gold triggered a rapid correction after breaking below the lower edge of the short-term rising channel and the 50% Fibonacci retracement level last week. The current gold price stabilized in the $3,320 area and received some buying at the 61.8% Fibonacci support.
However, it is worth noting that the 200-period moving average on the 4-hour chart is at $3,350, which constitutes an important technical resistance for a short-term rebound. On the contrary, if gold breaks through the $3,350 level, gold will continue to develop a bullish pattern.
From the technical trend, gold triggered a rapid correction after falling below the lower edge of the short-term rising channel and the 50% Fibonacci retracement level last week. The current gold price stabilized in the $3,320 area and received some buying at the 61.8% Fibonacci support.
However, it is worth noting that the 200-period moving average on the 4-hour chart is at $3,350, which constitutes an important technical resistance for a short-term rebound.
On the contrary, if gold breaks through the $3,350 line, it will be expected to attack the $3,371-3,373 area in the short term, and further look to the key pressure levels of $3,400 and $3,440.
💰Strategy Package
Long Position:3320-3325,SL:3300,Target: 3350
Still a chance for gold bulls?
💡Message Strategy
The gold market was volatile this week, and gold prices ultimately closed lower for the week.
Gold prices have failed to stabilize above $3,400 an ounce after a bullish breakout. The technical outlook highlights the recent indecision of gold bulls. Looking ahead to next week, the Fed's policy statement and US-China trade talks could trigger the next big move for gold.
These important factors may trigger the market next week
1. The Fed will announce its monetary policy decision after its policy meeting on July 29-30.
Before the Fed meeting, the U.S. Bureau of Economic Analysis will release its first estimate of annualized growth in gross domestic product (GDP) in the second quarter.
2. Next Friday, the U.S. Bureau of Labor Statistics will release the July employment report.
If the non-farm payrolls (NFP) increase by more than 100,000, it may indicate that the labor market is in good enough condition for the Fed to prioritize controlling inflation and support the dollar when making policies.
If the new non-farm payrolls data reaches or falls below 70,000, the dollar may find it difficult to find demand before the end of next week and help gold gain bullish momentum.
3. Market participants will be closely watching the headlines of the US-China negotiations.
If the two sides make further progress in trade and economic relations, risk flows may dominate the actions of financial markets, making it difficult for gold to find demand.
📊Technical aspects
The short-term technical outlook highlights the hesitation among gold buyers. The daily chart shows that the relative strength index (RSI) remains just below 50, and gold is struggling to move away from both the 20-day simple moving average (SMA) and the 50-day SMA after breaking above both levels earlier this week.
If the price of gold falls to the key support level of $3,310 and fails to break down (trend line support/Fibonacci 61.8% retracement level), it will force a large number of shorts to exit the market and may further test the $3,340 range (psychological level/Fibonacci 76.4% retracement level).
Combined with the current trend, the downward momentum of gold has weakened, and it is seeking support to restart the long position
💰Strategy Package
Long Position:3310-3320,SL:3290,Target: 3340
Market forecasts are completely accurate, trading signals#XAUUSD
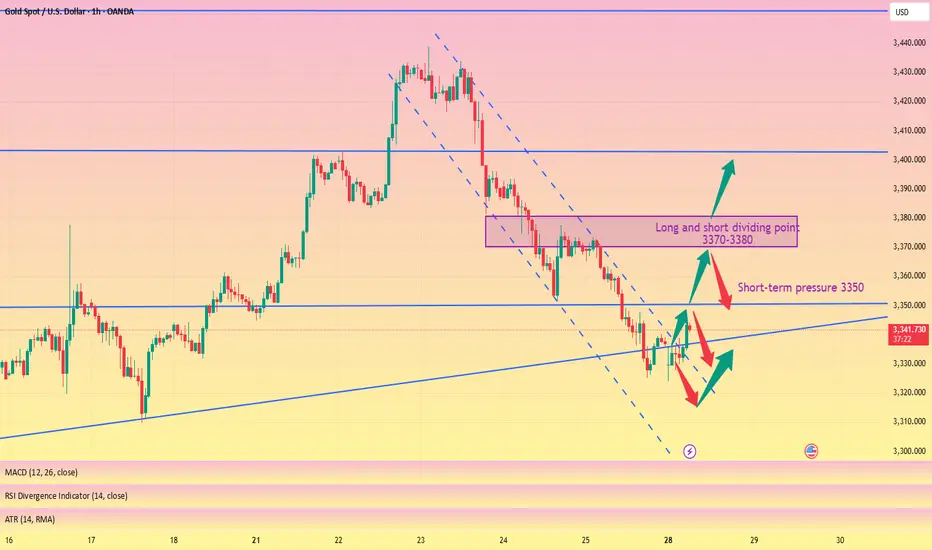
After opening today, gold tested the lowest point near 3324 and then rebounded, which is in line with my prediction of gold trend last night. Next, we need to pay attention to whether the upper 3345-3350 constitutes a short-term pressure level. If you are aggressive, you can consider shorting at 3345-3350, with the target at 3330-3325. Continue to hold if it falls below 3325, and stop loss if it breaks above 3350. After it breaks above, you can consider following up with a long order to close the position at 3360-3370. Short once at 3370-3380 for the first time, and stop loss if it breaks above 3380.
🚀 SELL 3345-3350
🚀 TP 3330-3325
🚀 BUY 3352-3355
🚀 TP 3360-3370
🚀 SELL 3370-3380
🚀 TP 3345-3325-3310
Be sure to study my trading strategy carefully. If you only look at the price points, you will definitely suffer certain losses. Participate in the transaction at the right time based on your own account funds and set stop losses.
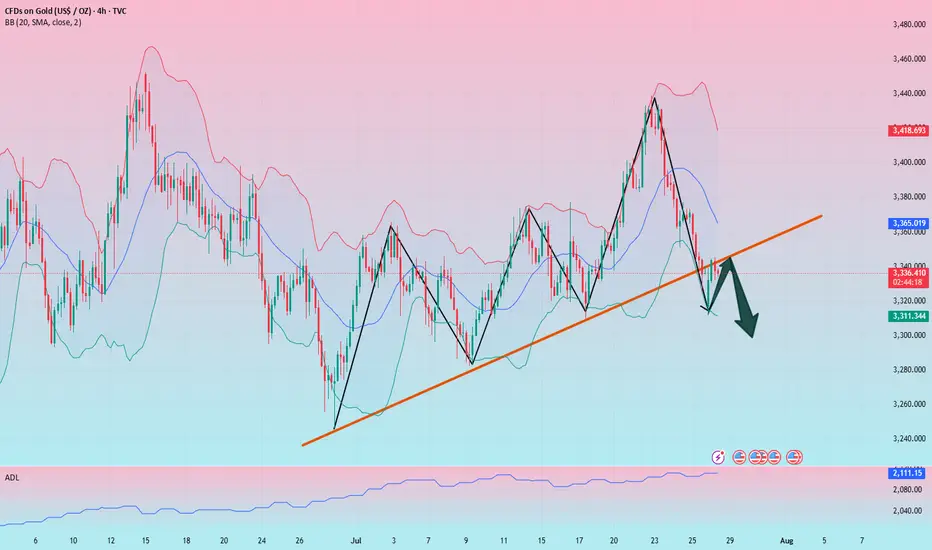
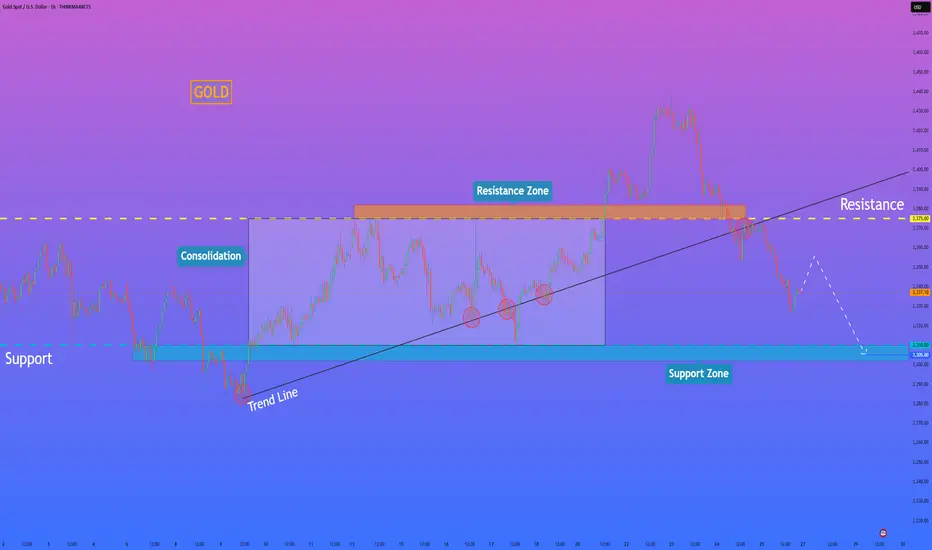
HelenP. I Gold can continue to decline to support zoneHi folks today I'm prepared for you Gold analytics. If we look at the price chart, we can observe a significant shift in the market structure, highlighted by the recent decisive break of a long-standing ascending trend line. This event suggests that the previous bullish momentum has been exhausted and that sellers are now taking control. The bearish case is further strengthened by the price trading below the key horizontal zone around 3375, which previously acted as support during the consolidation phase and is now poised to act as strong resistance. My analysis for a short position is built on this structural change. I believe that any attempt by the price to rally back towards the broken trend line or the 3375 resistance zone will likely be met with significant selling pressure, confirming the new downward trend. A rejection from this area would be the key condition validating the bearish bias. Therefore, the primary goal for this developing downward impulse is set at the 3305 level, as this aligns with the next major support zone where the price is likely to find its next pause. If you like my analytics you may support me with your like/comment.❤️
Disclaimer: As part of ThinkMarkets’ Influencer Program, I am sponsored to share and publish their charts in my analysis.
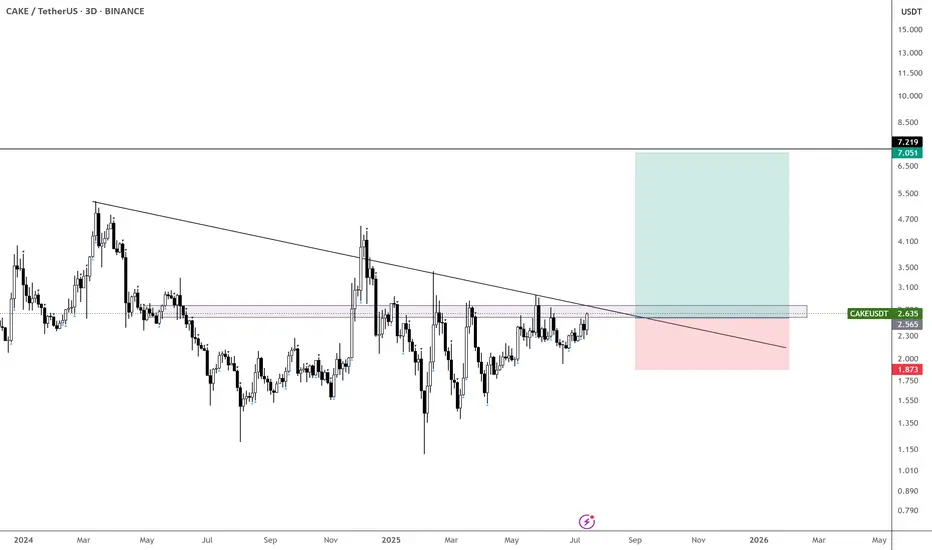
$CAKE is coiling up nicely - Aiming for $7
It hasn’t done much over the past few months, but it’s now above the yearly open and on its 6th attempt to break through the monthly supply zone.
Could this finally be the breakout that leads us toward $7?
Taking bids here and exercising patience.
With CRYPTOCAP:XRP , CRYPTOCAP:ETH , CRYPTOCAP:HBAR , and EURONEXT:ALGO already moving — and possibly CRYPTOCAP:BNB next — this could be a perfect setup for a delayed BINANCE:CAKEUSDT catch-up play.
XAUUSD - Gold is in for a big week?!Gold is trading below the EMA200 and EMA50 on the 4-hour timeframe and near the bottom of its medium-term ascending channel (breakout or no break is yet fully confirmed). A correction towards demand levels would provide us with a better risk-reward buying position, and if it rises, we could consider shorting it in supply levels.
In the past week, gold experienced two distinct phases in its price movement: a strong upward trend in the first half that stalled at key resistance levels, leading the market into a more cautious mode. The latest surveys reveal a clear division among gold analysts—some foresee a bearish outlook, while others prefer to remain neutral and wait for further signals. Meanwhile, retail traders remain optimistic about gold’s short-term trajectory and emphasize the continuation of its upward trend.
Analysts at Commerzbank believe the gold market is currently directionless and searching for a clear trend. In their view, recent news around potential trade agreements has weakened demand for gold as a safe-haven asset. They have adopted a neutral stance in the short term, stating that gold prices are near their upper limit with limited room for further gains at the moment.
Conversely, some experts are confident in the continuation of gold’s bullish trend. Rich Checkan, President and CEO of Asset Strategies International, declared: “Gold is in an uptrend. Today’s pullback is setting the stage for next week’s rally. If the Federal Open Market Committee (FOMC) meets expectations and holds rates steady, both gold and silver will keep climbing. And if the Fed exceeds expectations by cutting rates, we’ll see an even stronger surge in both metals. Either way, the direction is upward.”
At the same time, other analysts remain cautious about the trend’s sustainability. Mark Leibovit, editor of VR Metals/Resource Letter, warned that the U.S. dollar may be forming a bottom, which could exert downward pressure on gold and calls for increased caution from investors.
Despite continued political pressure from President Trump, the Federal Reserve is not expected to lower interest rates at the upcoming meeting. Central bankers have stated that they want to observe the economic effects of tariffs before making any adjustments. Although some Fed officials are moving away from the “wait and see” approach, analysts still believe the Fed will leave rates unchanged this week—though markets are closely watching for any signals suggesting that rate cuts could begin as early as September.
Meanwhile, China’s gold consumption in the first half of 2025 declined, though the drop was less severe than in previous years. The primary reason was increased demand for gold as a safe-haven investment, which partially offset reduced jewelry purchases due to high prices.
According to data from the China Gold Association, a government-affiliated body, gold consumption fell by 3.54% year-over-year in the first half of the year to 505,205 tons. In comparison, Q1 saw a 5.96% annual decline, and the same period in 2024 recorded a 5.61% drop.
The association stated that growing geopolitical tensions and ongoing economic uncertainty have strengthened gold’s role as a store of value and safe asset, prompting a significant rise in private investment in bars and coins.
Gold bar and coin purchases—a key indicator of safe-haven demand—surged by 23.7% to 264,242 tons, accounting for 52% of total consumption and overtaking jewelry as the largest consumption segment. Meanwhile, gold jewelry demand fell by 26% to 199,826 tons, reflecting weakened consumer interest due to high prices.
Still, the association noted that lighter jewelry products with unique designs and higher value-added features remain popular. Additionally, official data from the People’s Bank of China (PBOC) showed that the central bank increased its gold reserves in June for the eighth consecutive month.
On the supply side, domestic gold production fell by 0.31% year-over-year to 179,083 tons in the first half of the year, while output from imported sources rose by 2.29% to 76,678 tons. Altogether, China’s total gold production grew by 0.44%, reaching 252,761 tons.

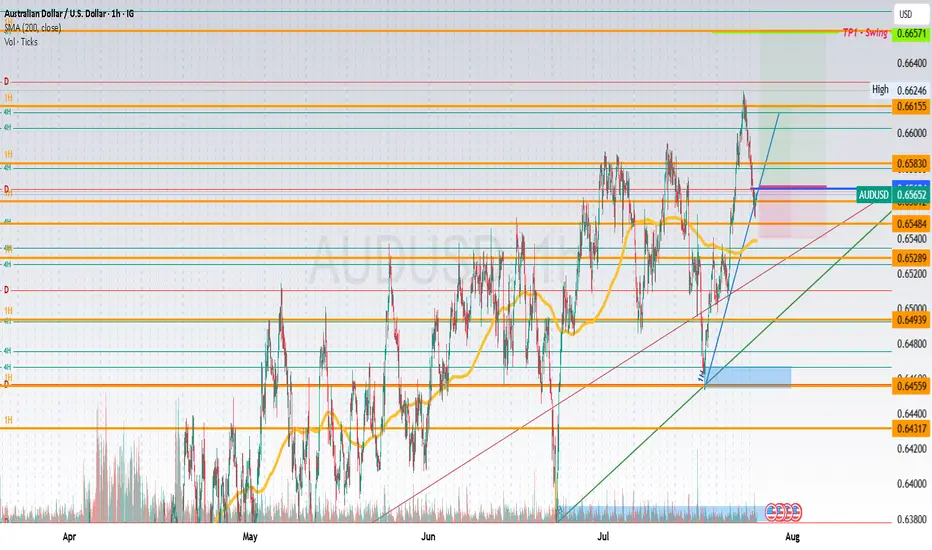
AU LongAUDUSD Entry
Entry @ break and retest of minor support/resistance and trendlines minor and 1H
TP1 where 1H and 4H PRZ share @ 0.66155 TP2 @ 0.66584
which also -27 on major structure fib
HH and HL showing on major structure, continuing the uptrend
Price retraced to 38.2, retesting 1H trendline
EU sell on minor structureEntry @ break and retest of minor support and trendlines minor and 1H
TP1 where 1H and 4H POC share @ 1.1693
which also -27 on minor fib
LH and LL showing on 1H structure,
On minor structure, price retraced 50%, retesting 1H trendline

Bitcoin Primed for Growth, Says Advanzia GroupBitcoin has once again ignited bullish expectations among institutional and retail investors alike, following a strong weekly close above key technical resistance levels. Market strategists and on-chain analysts now forecast significant upside potential for the world’s largest digital asset, with several signals pointing to a renewed leg higher in the ongoing crypto market cycle.
According to data from TradingView and Glassnode, Bitcoin closed the week above $117,000, confirming a bullish engulfing pattern on the weekly chart—typically viewed by traders as a strong sign of trend continuation. Momentum indicators such as the Relative Strength Index (RSI) and Moving Average Convergence Divergence (MACD) also suggest that buy-side pressure is building, with limited resistance until the $130,000 zone.
“Bitcoin just posted one of the strongest technical closes of the year,” says Alex Dornfeld, Senior Market Analyst at Advanzia Group, a digital wealth advisory firm. “The macro setup, institutional flows, and price structure all suggest that we may be entering the next wave of strategic accumulation.”
Institutional Capital Re-Emerges
Recent filings with the U.S. Securities and Exchange Commission (SEC) indicate that several hedge funds, family offices, and sovereign wealth vehicles are reactivating exposure to spot Bitcoin ETFs, especially after the June dip created what some viewed as an “institutional buying window.”
The resurgence in capital inflows has been supported by robust derivatives activity. Open interest on CME Bitcoin futures hit a 9-month high this week, reflecting renewed appetite for directional positions among professional traders.
"Liquidity has returned faster than expected," Dornfeld notes. "That alone is an incredibly strong signal that this rally is being built on more than retail enthusiasm."
On-Chain Metrics Confirm Accumulation
Blockchain analytics also support the bullish narrative. Glassnode data shows a surge in long-term holder supply, meaning more BTC is being transferred to cold storage wallets and held for longer durations. Historically, this behavior precedes major price increases, as reduced circulating supply squeezes market availability.
Additionally, net exchange outflows have exceeded $1.3 billion in the past two weeks, a clear sign that investors are positioning for medium- to long-term appreciation.
Advanzia Group: Helping Investors Capture the Upside
In this rapidly evolving digital asset landscape, Advanzia Group is helping investors navigate volatility and capitalize on the upside of the Bitcoin cycle. Through a mix of algorithmic risk management, macro trend analysis, and tailored portfolio strategies, the firm supports both institutional clients and high-net-worth individuals seeking measured exposure to digital assets.
“We believe in disciplined positioning,” says Dornfeld. “Our job is not to chase the market, but to help clients capture asymmetric opportunities like the one currently forming in Bitcoin—without taking on unmanaged risk.”
Advanzia’s latest research bulletin, released to private clients on Monday, outlines an expected range of $130,000–$145,000 for Bitcoin by late Q3 2025, assuming stable macro conditions and continued ETF inflows.
Outlook: The Momentum is Real
While risks remain—including macroeconomic shifts, regulatory unpredictability, and potential sell-offs—many analysts agree that the recent weekly close provides a strong technical foundation for further upside.
Whether Bitcoin reaches new all-time highs in the next few months or experiences interim corrections, the direction of travel appears increasingly tilted to the upside.
And for investors seeking to participate strategically, partners like Advanzia Group are proving essential—turning volatility into opportunity, and market signals into long-term performance.
Bitcoin, Politics, and Security: This Week in CryptoThis week brought a series of headline-making moves in the crypto space, reflecting the growing maturity and complexity of the digital asset landscape. From massive Bitcoin buys to cybersecurity initiatives and political implications, here's what stood out — and why it matters.
Strategy Buys $740M in Bitcoin
Institutional players continue to accumulate Bitcoin — but the scale and structure of Strategy’s recent purchase caught the attention of analysts. According to filings with the SEC, the firm added 11,000 BTC, bringing total holdings to 186,000 BTC — worth over $11 billion.
What’s notable is that Strategy appears to be financing these purchases using bond issuance, effectively applying low-interest leverage to increase crypto exposure. This marks a shift in how corporations are approaching Bitcoin — as both a reserve asset and a financial instrument.
Trump Media Discloses $2B in Digital Assets
In a surprising disclosure, Trump Media & Technology Group, the parent of Truth Social, revealed it holds $2 billion in digital assets — including USDC, Ethereum, and small allocations to Solana and Chainlink.
The move has sparked debate within both financial and political circles, given Donald Trump’s renewed activity as a U.S. presidential candidate. Such a significant crypto treasury tied to a politically active entity raises concerns about market influence and regulatory scrutiny.
CoinDCX Launches $1M Bug Bounty Program
Indian crypto exchange CoinDCX announced a $1 million bug bounty program, inviting white-hat hackers and security researchers worldwide to find vulnerabilities in its platform. This marks a shift toward proactive cybersecurity in the crypto exchange industry.
The company also plans to launch an open-source vulnerability-sharing platform to facilitate threat intelligence across exchanges — a move that could standardize Web3 security practices.
Bottom Line
This week underscored the increasingly strategic posture of major crypto market players. From treasury management and structured crypto financing to cybersecurity and institutional-grade governance, the digital asset sector is evolving rapidly.
For savvy investors and ecosystem participants, this complexity brings more opportunity than ever before — but also demands sharper focus, real-time analytics, and risk-aware strategies.
If you need these articles tailored for a newsletter, blog, or investor deck — just let me know!

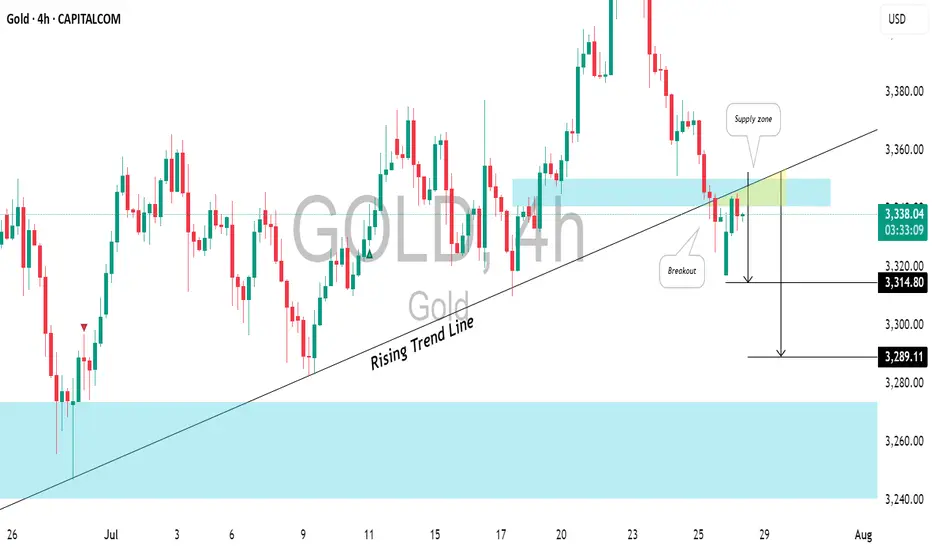
GOLD (XAUUSD): Important BreakoutsI've identified two significant breakouts on 📉GOLD.
The price violated a crucial intraday horizontal support and a major rising trend line.
These broken levels now form a contracting supply zone, suggesting that the price could continue to decline.
Target levels are 3314 and 3289.
Crypto VC Sees Resurgence — Satsuma Raises $135M, QCEX Secures $Amid persistent market volatility and macroeconomic uncertainty, venture capital is once again flowing into the crypto sector — and doing so with conviction. In recent weeks, two major players, Satsuma and QCEX, closed significant funding rounds, raising a combined $247 million. These deals signal a renewed appetite for Web3 and decentralized finance (DeFi) solutions, even as the broader market remains cautious.
Satsuma, a blockchain analytics and infrastructure startup, secured $135 million in its Series B round. According to insiders, leading investors include a16z Crypto, Polychain Capital, and Paradigm. The company focuses on developing high-performance tools for DeFi monitoring, on-chain risk management, and data analysis — solutions increasingly demanded by institutional clients.
Meanwhile, QCEX raised $112 million in a Pre-Series A round to accelerate the launch of its next-generation hybrid exchange. Targeting institutional traders, QCEX offers a dual-layer trading model that combines custodial infrastructure with decentralized security mechanisms. Investors include Galaxy Digital and several venture groups from the Middle East.
Why Do These Deals Matter?
Analysts say the return of venture capital to crypto is no longer driven by hype, but by fundamentals. Investors are now focusing on scalable, revenue-generating business models and robust technology stacks. After the fallout from FTX and the 2022–2023 market correction, due diligence is far more rigorous — and both Satsuma and QCEX meet these higher standards.
These funding rounds also create secondary market opportunities. Historically, successful VC deals have often preceded token launches or public offerings — opening the door for profitable early-stage investments. At BBDelta, we anticipate Satsuma may issue a utility token by 2026, while QCEX is already in talks with exchanges about potential listings.
The Bigger Picture
Crypto VC funding grew by 22% quarter-over-quarter, signaling the early stages of a new investment cycle. What’s notable is the shift in capital allocation: investors are moving away from purely speculative projects and into Web3 infrastructure, analytics, and compliance-focused platforms.
BBDelta believes this signals the arrival of "smart capital" — institutions betting not on short-term returns, but on long-term infrastructure that will underpin the next phase of crypto adoption.
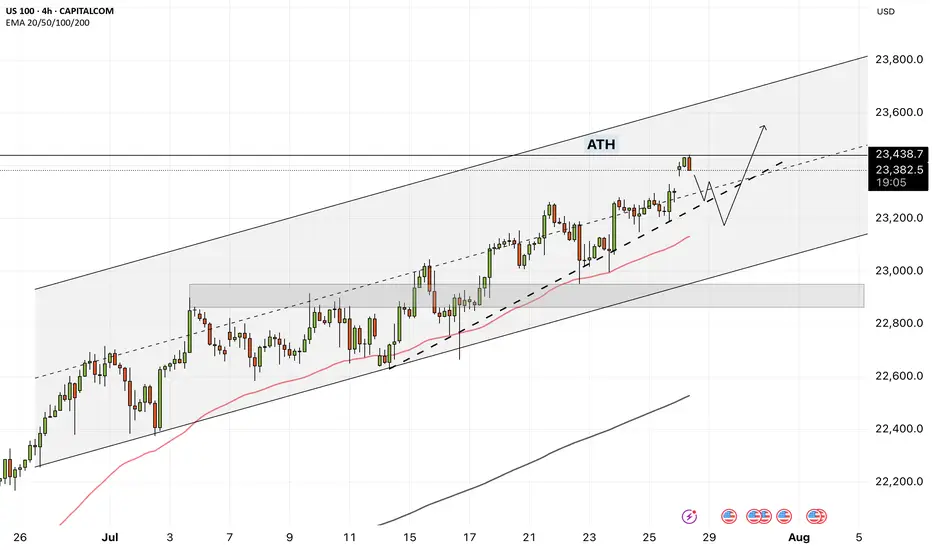
NAS100 - How will the stock market react to the FOMC meeting?!The index is trading above the EMA200 and EMA50 on the four-hour timeframe and is trading in its ascending channel. The target for this move will be the ceiling of the channel, but if it corrects towards the indicated support area, you can buy Nasdaq with better reward-risk.
As signs of easing global trade tensions begin to emerge, the Federal Open Market Committee (FOMC) is scheduled to meet this week. Analysts widely expect the Fed to hold interest rates steady for a fifth consecutive time. This anticipated decision comes as the U.S. President continues to push for rate cuts, persistently pressuring the Fed to adopt a more accommodative monetary stance.
So far, the Federal Reserve has kept its benchmark rate within a range of 4.25% to 4.5%. While some officials project two cuts by the end of the year, markets are waiting for the Fed’s patience to run out. According to the CME Group’s FedWatch tool, investors have priced in a 62% chance of a rate cut in the September meeting. By then, the Fed will have access to the July and August employment reports—key indicators of whether the labor market is weakening or remains resilient.
The upcoming week marks the peak of Q2 earnings season, with 37% of S&P 500 companies reporting results, including four major tech firms. In parallel, the August 1st tariff deadline for the EU and other countries is approaching, while legal challenges over existing tariffs remain ongoing.
According to a report by The Wall Street Journal, many large U.S. corporations have so far absorbed the bulk of tariff-related costs without passing them on to consumers. This strategy aims to maintain market share and avoid drawing criticism from President Trump. However, the question remains—how long can this continue?
Examples from the report include:
• General Motors paid over $1 billion in tariffs in Q2 alone without announcing any price hikes.
• Nike expects a $1 billion hit from tariffs this fiscal year and is planning price increases.
• Hasbro is working on a combination of price hikes and cost cuts to offset $60 million in tariff impacts.
• Walmart has made slight pricing adjustments (e.g., bananas rising from $0.50 to $0.54) and managed pressure through inventory reductions.
This week is shaping up to be one of the busiest on the economic calendar in recent months. A flood of key data on growth, inflation, and employment, alongside three major interest rate decisions, has markets on high alert.
On Tuesday, attention will turn to two significant reports: the Job Openings and Labor Turnover Survey (JOLTS) and the U.S. Consumer Confidence Index for July. These metrics will offer a clearer view of labor market dynamics and household sentiment heading into critical monetary policy decisions.
The most anticipated day is Wednesday. That day brings the ADP private payrolls report, the first estimate of Q2 GDP, and pending home sales data. Additionally, both the Bank of Canada and the Federal Reserve will announce rate decisions—events with the potential to simultaneously steer global market trajectories.
On Thursday, the July Personal Consumption Expenditures (PCE) price index will be released—a key inflation gauge closely monitored by the Fed. Weekly jobless claims data will also be published that day.
The week concludes Friday with two heavyweight economic indicators: July’s Non-Farm Payrolls (NFP) report, a crucial input for Fed policy decisions, and the ISM Manufacturing PMI, which offers insights into the health of the real economy.
Some economists argue that a September rate cut may be premature, and even suggest that no rate changes might occur in 2025. Analysts expect Fed Chair Jerome Powell to reiterate a data-dependent stance, consistent with previous meetings.
Still, beyond political dynamics, the July meeting holds independent significance.The Fed’s internal policy tone is gradually leaning more dovish, and subtle signals of this shift may emerge in the final statement. Given that only one meeting remains before September, if policymakers are leaning toward a rate cut then, it’s critical that the groundwork for such communication be laid now.