Solana (SOL) Revs Up Again — Fresh Breakout Above $200 in Sight?After months of consolidation, Solana (SOL) is once again showing signs of bullish momentum, trading near $176 and rapidly approaching a potential breakout level of $200. Investors and analysts alike are paying close attention, as on-chain activity and ecosystem development provide a compelling case for a renewed upward trajectory.
With growing demand for high-throughput blockchain infrastructure and new institutional integrations, Solana is positioning itself as more than just an Ethereum alternative—it’s emerging as a core infrastructure layer for high-performance Web3 applications.
Institutional Momentum Gathers Pace
In the last three weeks, several high-profile announcements have bolstered confidence in the Solana ecosystem. Fidelity Digital Assets revealed it is piloting tokenized bond products on Solana’s network, citing its fast settlement time and composability.
Meanwhile, Visa expanded its USDC settlement pilot on Solana across five countries, reinforcing the blockchain’s real-world financial use cases.
“Solana is no longer just retail-driven,” said Karla Nunez, digital asset strategist at ApexBridge. “Institutions are beginning to build directly on it—and that changes the dynamic.”
Ecosystem Growth and Developer Activity
The number of active developers on Solana has surged 38% quarter-over-quarter, according to Electric Capital’s Developer Report. Projects in DeFi, gaming, and NFTs continue to attract users, helped by extremely low transaction costs and sub-second finality.
Notably, the Solana Foundation recently launched a $100 million grant fund for AI-integrated crypto applications, which could catalyze the next wave of user adoption.
Technical Indicators Support Breakout Narrative
SOL has outperformed major altcoins this month, rising 21% in July. The token is now trading above its 50-day and 100-day moving averages, and momentum indicators suggest a potential breakout above the key psychological barrier at $200.
A confirmed break would likely open the door to $240–$260, with minimal historical resistance in that zone.
Macro Factors Provide Tailwind
The broader crypto market is recovering as inflation metrics cool and expectations for central bank easing rise. Solana, with its high beta to market movements, often leads altcoin rallies during bullish pivots.
Furthermore, the recent dip in Ethereum gas prices has had limited impact on Solana’s user base, suggesting its appeal is increasingly based on performance, not cost arbitrage.
Conclusion
While risks remain—from network outages to broader market volatility—Solana’s resurgence appears fundamentally supported. With institutional interest rising, technical signals aligning, and ecosystem momentum building, a clean break above $200 could mark the beginning of a new cycle for SOL.
For investors seeking exposure to high-speed smart contract platforms with real-world traction, Solana may be nearing another defining moment.
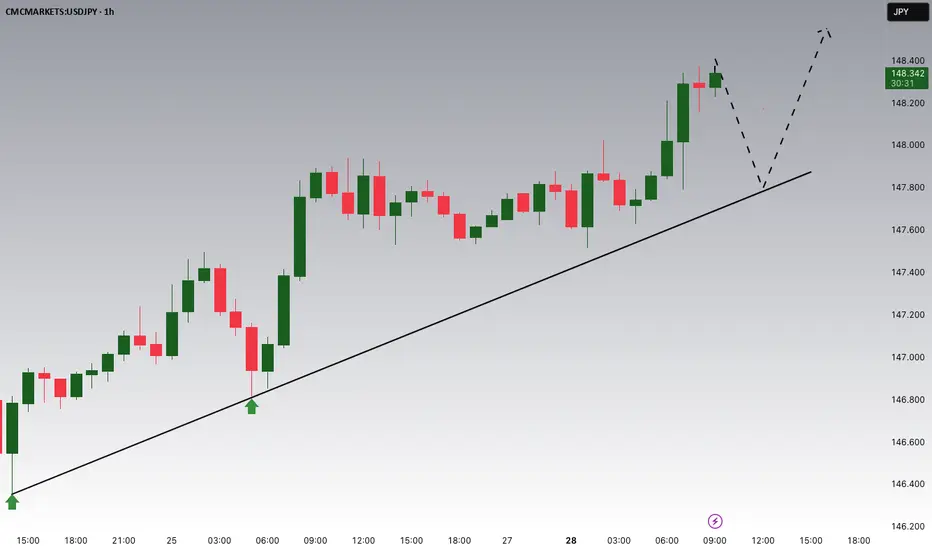
Trend Lines
USDJPY Potential UpsidesHey Traders, in today's trading session we are monitoring USDJPY for a buying opportunity around 147.800 zone, USDJPY is trading in an uptrend and currently is in a correction phase in which it is approaching the trend at 147.800 support and resistance area.
Trade safe, Joe.
Bitcoin Next Leg Incoming? Targets $134K from Bullish WedgeBTCUSDT is consolidating within a descending wedge right above a critical demand zone, following a impulsive breakout from its prior range structure. This current setup suggests another potential bullish continuation, especially as price continues to respect both the wedge support and internal demand.
With the higher timeframe structure favoring bulls and previous demand zones holding firm, the projected breakout targets align with $123,218 and $134,446 respectively.
A clean invalidation would only be confirmed on a sustained break below the wedge and loss of the strong support area near $110K.
All eyes on the wedge apex as BTC prepares for its next major leg.

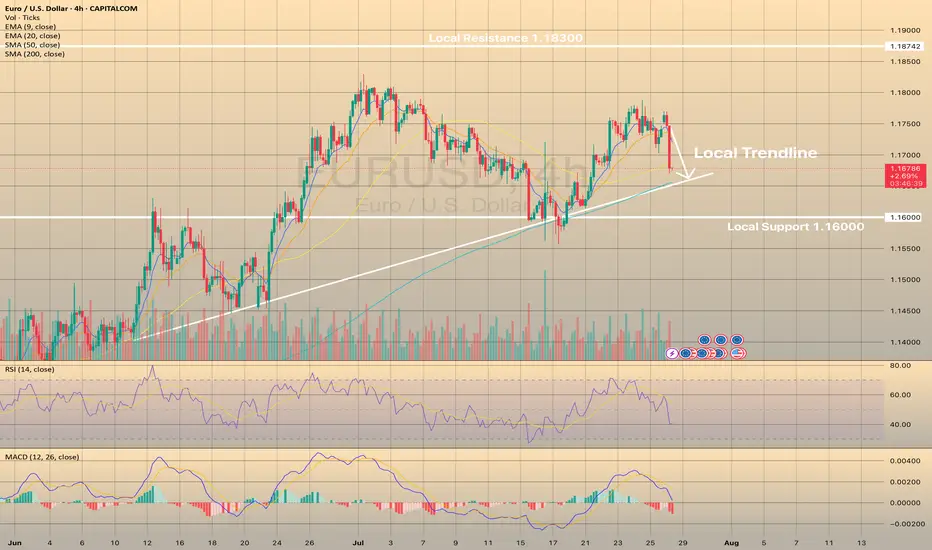
EURUSD LOSSES BULLISH MOMENTUM. WHERE TO GO?EURUSD LOSSES BULLISH MOMENTUM. WHERE TO GO?
The asset didn't reach the local resistance of 1.18300 and started to consolidate before reaching this level. RSI shows weakness of the impulse on 4-h chart, as well as MACD is in the red zone. Therefore, we expect the price to slowly decline towards local trendline, where SMA200 is situated.
EURJPY → Retest support before growthFX:EURJPY has been correcting since the opening of the European session. The movement was triggered by yesterday's news related to the trade deal between the US and Europe...
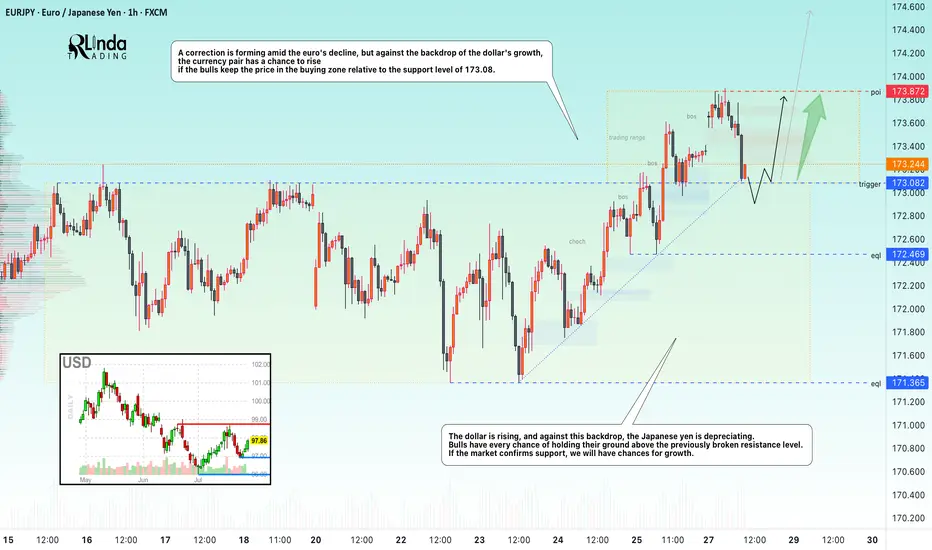
EURJPY is reacting to news related to the deal between the US and Europe. A correction is forming amid the fall of the euro, but against the backdrop of the dollar's growth, the currency pair has a chance to rise if the bulls keep the price in the buying zone relative to the support level of 173.08.
The dollar is rising, and against this backdrop, the Japanese yen is falling. Bulls have every chance of holding their ground above the previously broken resistance. If the market confirms support, we will have chances for growth.
Resistance levels: 173.87
Support levels: 173.082, 172.47
The currency pair may form a liquidity trap relative to the previously broken consolidation resistance. A false breakdown of support and price consolidation in the buying zone (above 173.1) could trigger further growth.
Best regards, R. Linda!
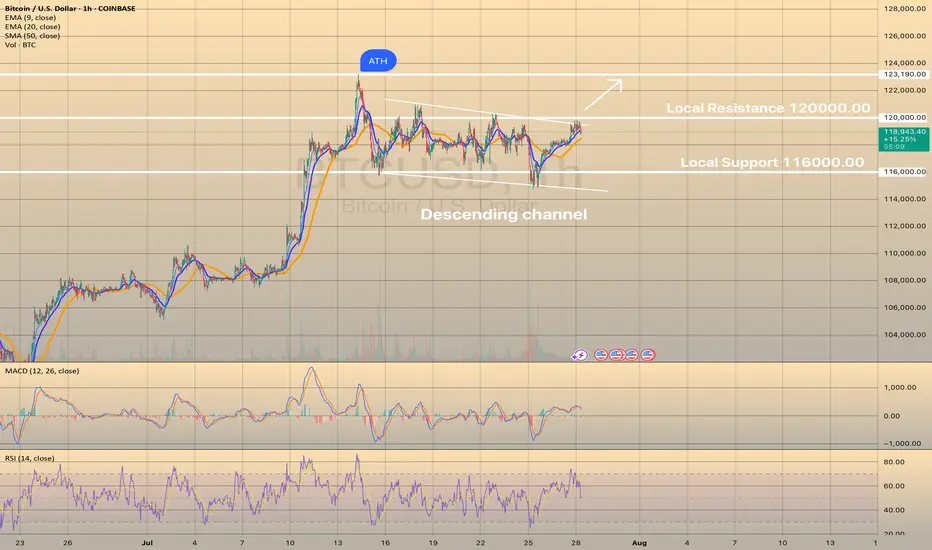
BTCUSD IS READY TO BREAK THE DESCENDING CHANNELBTCUSD IS READY TO BREAK THE DESCENDING CHANNEL
In our latest report we wrote down that the asset may rebound from lower border of the descending channel and head toward local resistance level of 120,000.00. The forecast has successfully worked out, so what's next?
Currently the price consolidates slightly below the upper border of the descending channel and local resistance level of 120,000.00. Although, the RSI and MACD confirm bullish impulse and, in general, the asset is in mid-term bullish trend, still would be safer for long trade to wait for a breakout of the resistance with first target of 123,190.30 (ATH).
ETHUSD HEADS TOWARDS WEEKLY RESISTANCEETHUSD HEADS TOWARDS WEEKLY RESISTANCE
ETHUSD has broken local resistance of 3,850.00 and is currently heading towards weekly resistance of 4,100.00, the level, established in 2021. Last time the asset came close to this level at the end of last year and reversed from it afterwards. Same situation is expected here.
Price may retest the level of 3,850.00 and then head towards 4,100.00 level. No reversal signs on RSI or MACD. Vice a versa, RSI shows local strength of the asset, MACD is in the green zone. Buying volume highlights current bullish impulse.

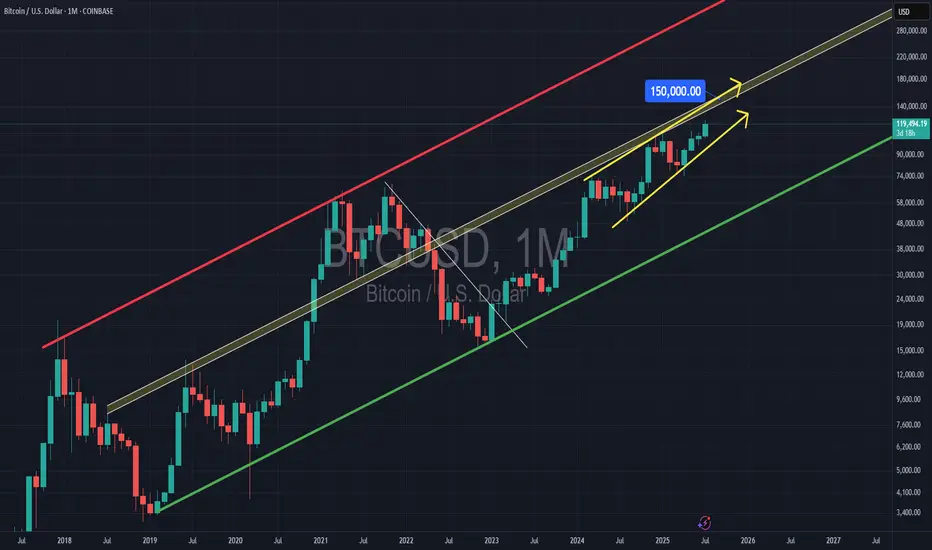
BITCOIN & 150kBitcoin in this RISING WEDGE, inside this huge RISING CHANNEL, gives us the resistance of the rising wedge & the middle line of the rising channel at $150,000.
This might be the TOP.
A Legends Continuation. BTCHello I am the Cafe Trader.
Today we are going to look at a trade inspired by the Legendary Trader and Scalper Al Brooks.
If you are not familiar with him I recommend having a strong foundation with price action before giving him a look.
It's no secret that BTC is at levels many thought it would never reach, and yet many others are convinced of 5 - 10x more from this run alone. It can be crushing to feel like you missed out on the move, so instead of getting FOMO, I've detailed a guide to help you in the short or the long term.
Long Term
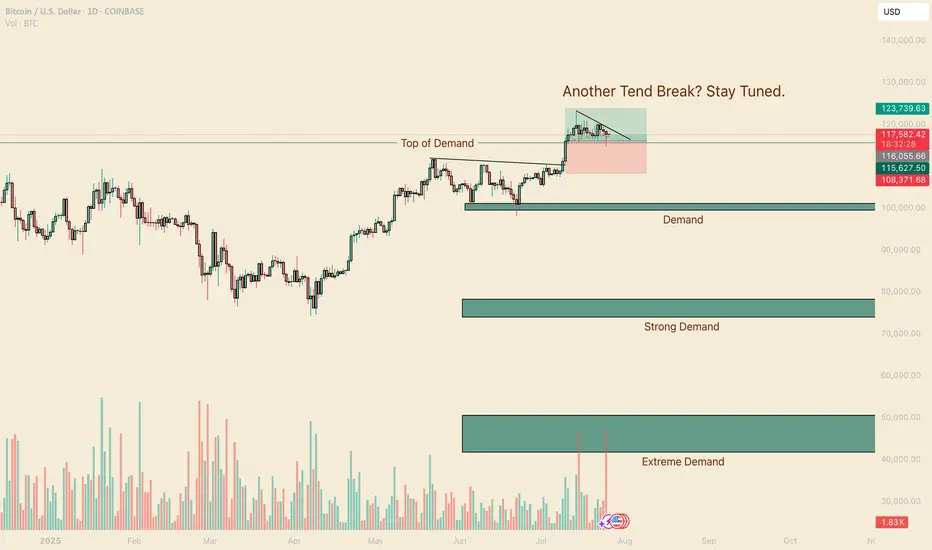
As of right now you are looking at 4 different levels of demand. It is up to you to measure your conviction, understanding why you want to invest, and how much you are willing to risk. Recognize that Many Big hedge funds have been hesitant with accumulating hoards of Crypto do to its volatile nature, considering it too risky.
So with this in mind, I have given you 4 levels to add BTC to your long term depending on your personal conviction.
Hyper Aggressive = Top of Demand $115,500 (willing to risk 50%)
Aggressive = Demand $99,500-101,250 (willing to risk 40%)
Fair Price = Strong Demand $74,000 - 78,000 (willing to risk 25%)
Steal = Extreme Demand $42,000 - 50,800 (willing to risk 10%)
Thinking about how much you are willing to risk will help you level out your Fear of missing this move, and get pricing that meets your personal demand.
Short Term
My fellow traders, this is a nugget (inspired) from Al Brooks. The "Two Bar Trend Break" .
In a strong trend (not in a range), When you get a trend break (I like to go top of wick to top of wick for this trade), if the second bar doesn't have a huge topping tail, but closes near the top, you can enter this trade.
Here is a trade that happened this month That hasn't filled yet (it got close).
Entry At the close of the second green candle $116,000.
Measure the bottom of the First candle that broke (called the Signal candle) to the top of the second bar that broke (called the Entery Candle). If you take that measurement, and add it to your take profit, you will have a 1R Scalp (1 measure of risk to 1 measure of reward).
This isn't a true scalp, typically they should be in the same bar or next bar, but this follows similar principles.
That's all for BTC, stay tuned for more analysis as we go over Ethereum, XRP, and one more of your choosing.
Happy Trading!
@thecafetrader
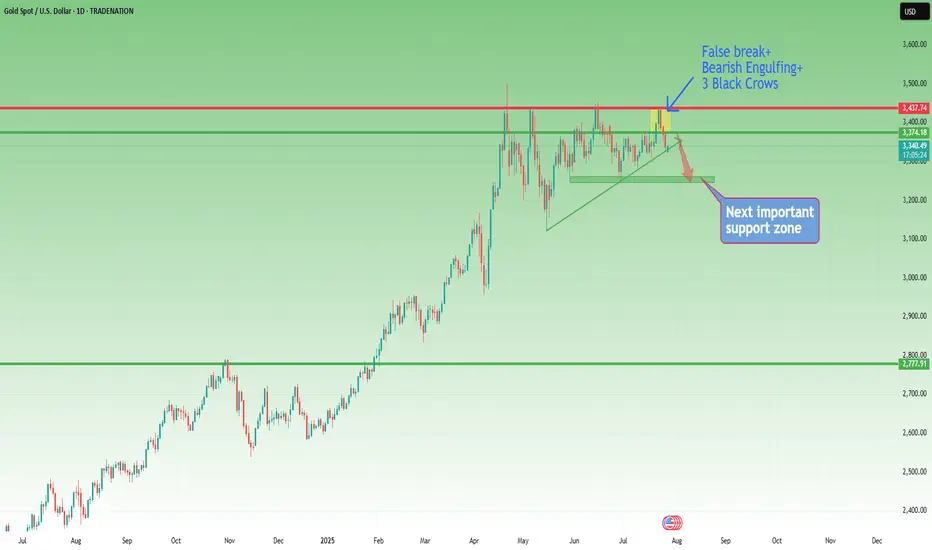
Gold Breakout Failed – Bearish Reversal in Play?Last week was both interesting and revealing for Gold.
After breaking above the key $3375 resistance—which also marked the upper boundary of a large triangle—price quickly accelerated higher, reaching the $3440 resistance zone.
However, instead of a bullish continuation, we witnessed a false breakout and sharp reversal. What initially looked like a healthy pullback turned into a full bearish rejection by week’s end.
________________________________________
📉 Current Technical Picture:
• On the daily chart, we now see a clear Three Black Crows formation
• On the weekly chart, a strong bearish Pin Bar confirms rejection
• And if we add the failed breakout above 3375, the bias tilts decisively bearish
________________________________________
📌 Key Zones and Trading Plan:
• Gold is currently bouncing from the ascending trendline zone, which is natural after dropping more than 1,000 pips in just 3 days
• The $3375–3380 area has regained importance as a key resistance zone, and that’s where I’ll be looking to sell rallies
• A bullish invalidation would only come if price manages to stabilize above $3400
Until then, this remains a bear-dominated market, and a drop below $3300 is on the table.
________________________________________
🧭 Support levels to watch:
• First support: $3280
• Major support: $3250 zone
________________________________________
📉 Conclusion:
The failed breakout, bearish candle formations, and current price structure all point to a market that's shifting in favor of sellers.
I’m looking to sell spikes into resistance, with a clear invalidation above $3400.
Disclosure: I am part of TradeNation's Influencer program and receive a monthly fee for using their TradingView charts in my analyses and educational articles.
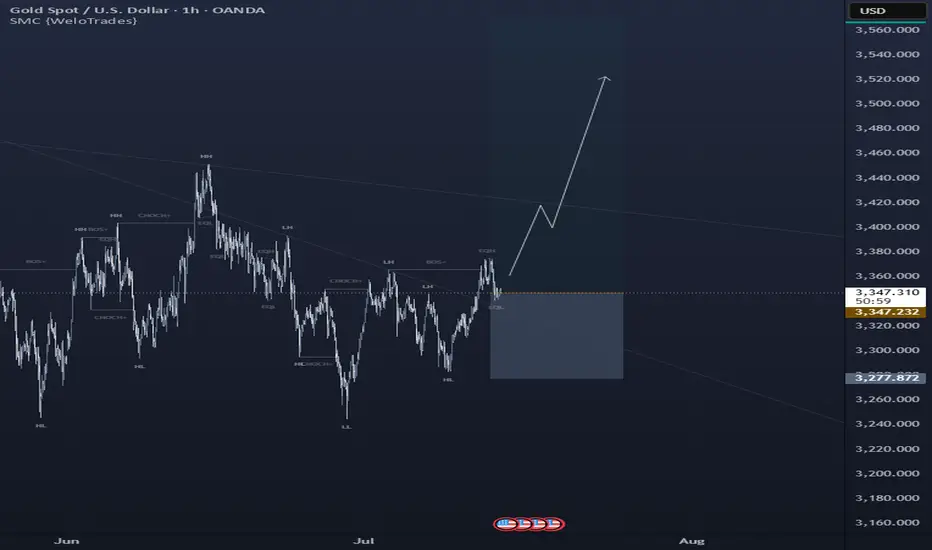
bullish on GOLDTrading Idea Setup:
XAUUSD has given me enough confirmation indicators to forecast a bullish run from this price point. ↗️🟢
✅Favorable TP level(s):
⦁ 3414.022
⦁ 3445.179
🛑Stop Loss:
⦁ 3277.205
Indications used:
Trend confirmation indicator
Elliot wave assistance
Momentum indicators
______________________________
Trading Involves Risk: Decisions to buy, sell, hold, or trade in securities, commodities, and other investments carry inherent risk, including the possibility of substantial losses. Please ensure every trade placed is supported by your own thorough analysis and/or fundamental research.
Ps: All the trades that I place, I do hold indefinitely unless noted otherwise but TP points will always be provided. Happy Trading 🖤
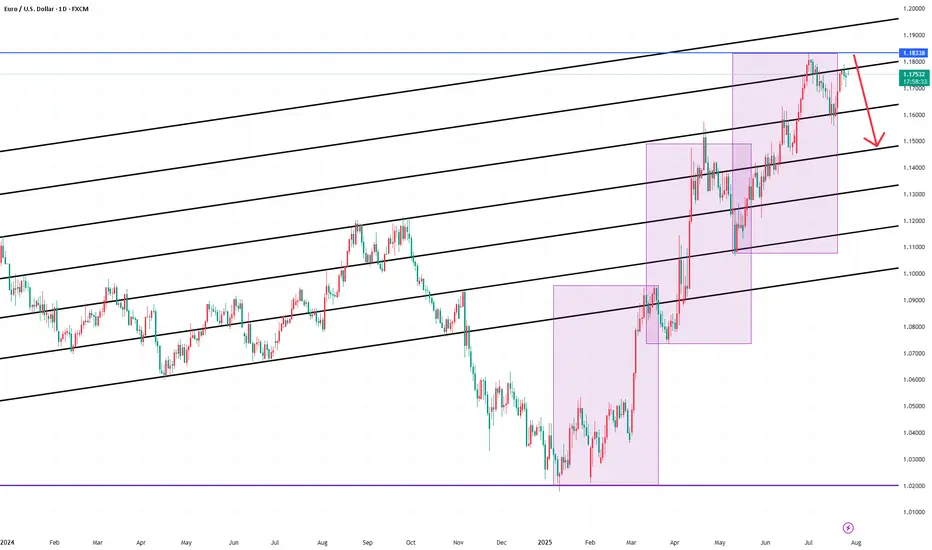
EURUSD InsightWelcome, everyone.
Please share your personal opinions in the comments. Don’t forget to hit the boost and subscribe buttons.
Key Points
- The U.S. and the EU have reached a trade agreement to impose a 15% tariff on EU goods, including automobiles. However, President Trump stated that pharmaceuticals, steel, and aluminum would be exempt from the 15% tariff. Both sides also agreed to mutually waive tariffs on "strategic items" such as aircraft and semiconductor equipment. Additionally, the EU has agreed to purchase $750 billion worth of U.S. energy and to invest an additional $600 billion in the U.S.
- High-level trade talks between the U.S. and China will be held on July 28–29, with the market expecting an extension of the current trade truce.
- Ahead of the FOMC meeting scheduled for July 29, markets are projecting an interest rate cut more likely in September rather than July.
Key Economic Events This Week
+ July 29: U.S. Department of Labor JOLTS
+ July 30: Germany Q2 GDP, U.S. July ADP Non-Farm Employment Change, U.S. Q2 GDP, Bank of Canada interest rate decision, FOMC meeting outcome
+ July 31: Bank of Japan interest rate decision, Germany July CPI, U.S. June Core PCE Price Index
+ August 1: Eurozone July CPI, U.S. July Non-Farm Payrolls, U.S. July Unemployment Rate
EURUSD Chart Analysis
The pair is showing an upward trend after finding support near the 1.16000 level. However, with resistance at the 1.18000 level—where the price previously faced rejection—the overall bias still appears bearish. That said, a breakout above this resistance line could signal a continuation of the uptrend, warranting close monitoring. For now, the outlook remains bearish toward the 1.15000 level. Should a breakout be confirmed, we will promptly revise our strategy.
GBP/CAD 4H Setup – Bearish Rejection at Key ZonePrice retested the 1.8420–1.8437 supply zone and showed a clear rejection, aligning with the previous trendline break. We're now seeing lower highs forming with bearish momentum.
🔻 Entry: Around 1.8410 – 1.8400
🎯 Target: 1.8313 (previous demand zone)
🛑 Stop Loss: 1.8437 (above structure)
Bias: Bearish below 1.8437 zone
If momentum continues, price could drop toward the 1.8310 support zone. Structure shows clean bearish control unless a breakout occurs back above the supply area.

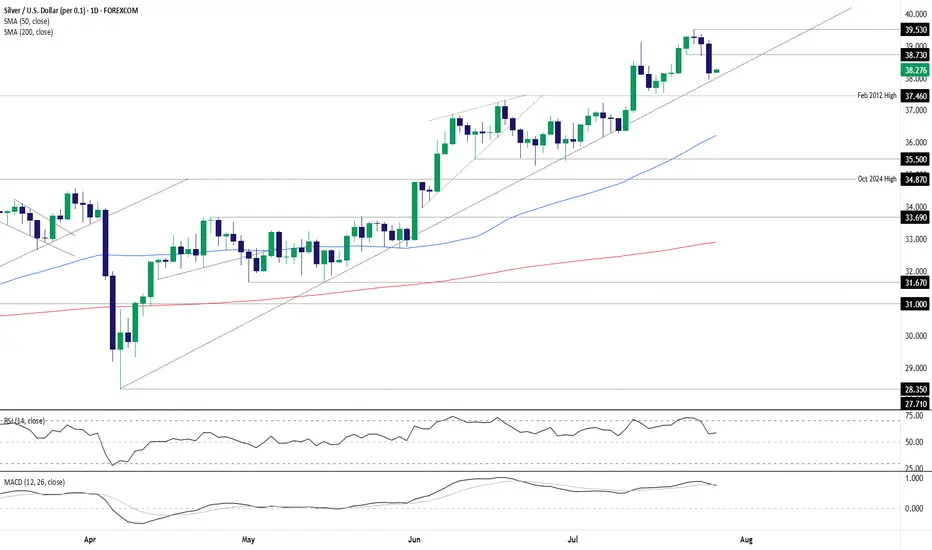
Silver dips to trendline, bulls eye bounceSilver’s latest pullback has seen it move back towards long-running uptrend support, creating a decent entry level for longs with price momentum favouring buying dips over selling rips.
Longs could be established above the trendline with a stop beneath for protection, targeting minor resistance at $38.73 initially and, if broken, the July 23 swing high of $39.53. If the latter were to be achieved, price and momentum signals at the time should dictate whether to hold for a potential test of the psychologically important $40 level.
The price has already bounced off the uptrend on numerous occasions since being established, enhancing the appeal of the setup. While RSI (14) and MACD are not screaming buy when it comes to market momentum, they’re tilted bullish rather than bearish, favouring upside.
If silver were to break and close beneath the uptrend, the bullish bias would be invalidated.
Good luck!
DS
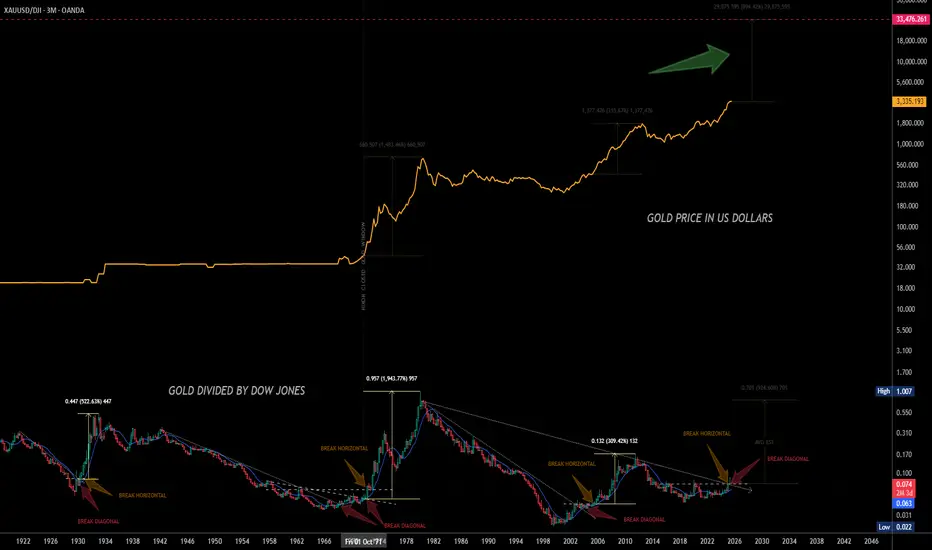
$33K GOLD looks as if the XAUUSD/DJI chart is demonstrating an early look into a repeat performance .. could gold go to $33K ..and if so, what will a tin of tuna cost?
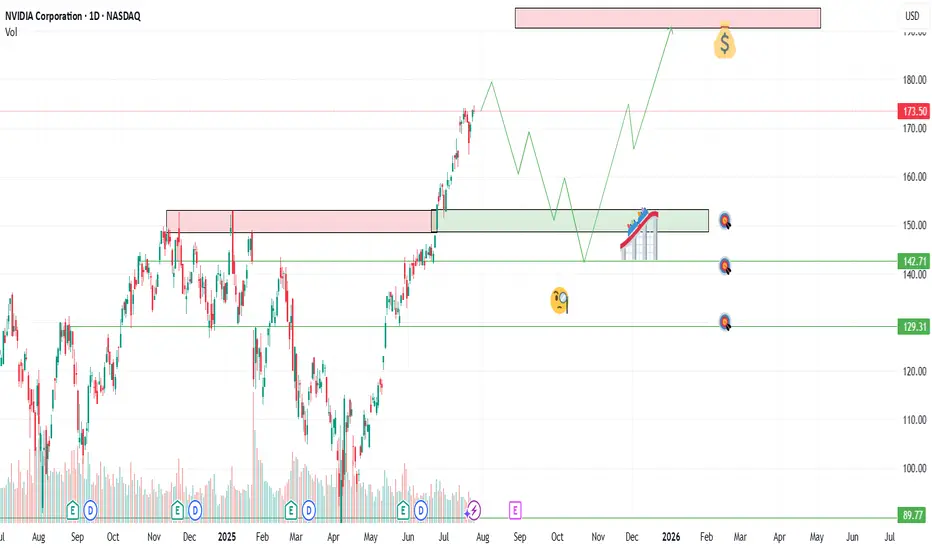
NVDA-the AI TitanNVIDIA (NVDA) continues to dominate the AI semiconductor space and remains one of the strongest momentum names in the market. After reaching new highs, price action is now offering a clean multi-tiered entry opportunity for swing traders positioning for the next leg up.
Entry Points
✅ $160 – Breakout retest zone
✅ $145 – Key technical support
✅ $130 – Strong demand zone from prior consolidation
Profit Targets
📈 TP1: $180
🚀 TP2: $190
💰 TP3: $200+
📌 Disclaimer: This is not financial advice. Just sharing my view and trade idea. Always do your own research and manage risk accordingly.
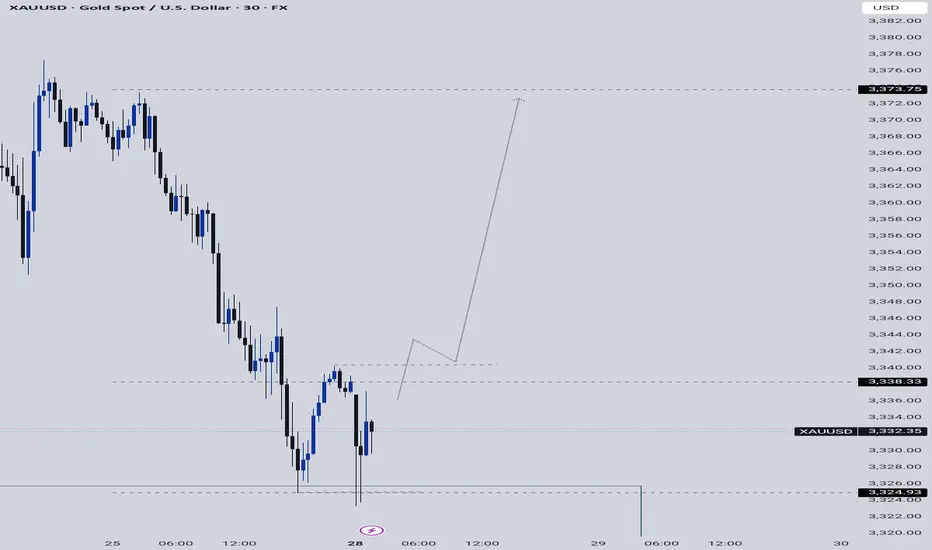
XAUUSD Gold just jumped to our 4H POI, we now wait for confirmation for buys to the upside targeting new highs.
How's your outlook?
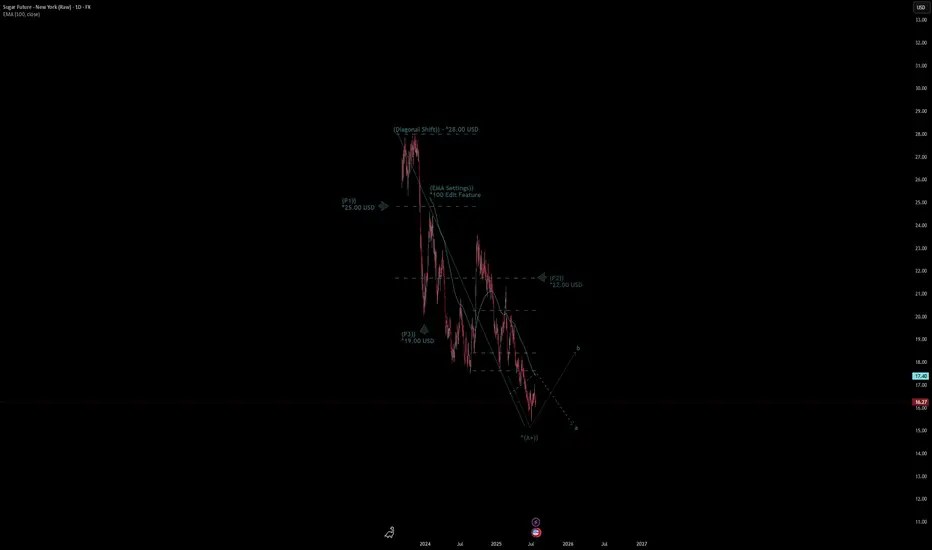
Sugar Future - New York (Raw) Quote | Chart & Forecast SummaryKey Indicators On Trade Set Up In General
1. Push Set Up
2. Range Set Up
3. Break & Retest Set Up
Notes On Session
# Sugar Future - New York (Raw) Quote
- Double Formation
* (Diagonal Shift)) - *28.00 USD | Completed Survey
* (EMA Settings)) - *100 Edit Feature | Subdivision 1
- Triple Formation
* (P1)) / (P2)) & (P3)) | Subdivision 2
* (TP1) = a / Long Consecutive Range
* (TP2) = b / Short Consecutive Pullback | Subdivision 3
* Daily Time Frame | Trend Settings Condition
- (Hypothesis On Entry Bias)) | Regular Settings
- Position On A 1.5RR
* Stop Loss At 19.00 USD
* Entry At 16.00 USD
* Take Profit At 12.00 USD
* (Downtrend Argument)) & No Pattern Confirmation
- Continuation Pattern | Not Valid
- Reversal Pattern | Not Valid
* Ongoing Entry & (Neutral Area))
Active Sessions On Relevant Range & Elemented Probabilities;
European-Session(Upwards) - East Coast-Session(Downwards) - Asian-Session(Ranging)
Conclusion | Trade Plan Execution & Risk Management On Demand;
Overall Consensus | Sell
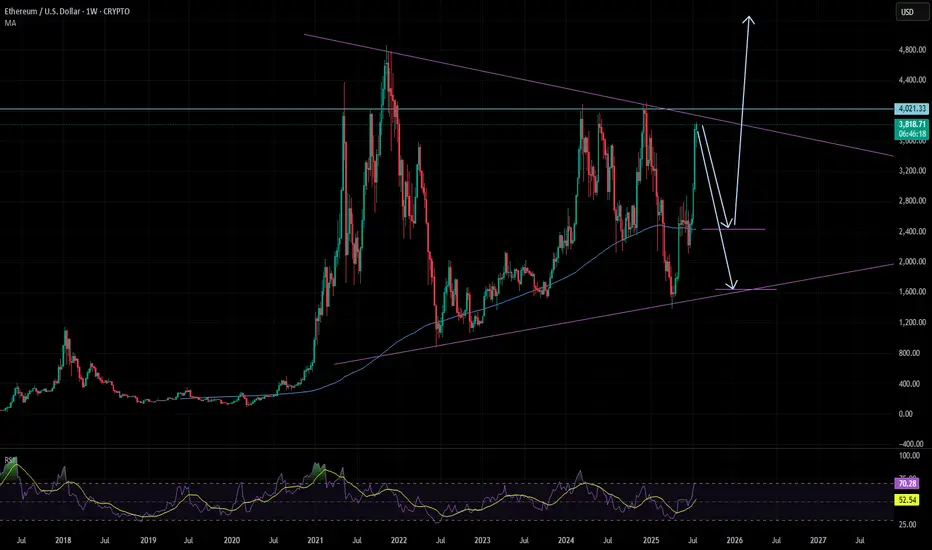
ETH is not going up soonETH made a beautiful bullrun from the trendline.
Now most people will be convinced we will break the 4K level and so straight up.
I'm not convinced, and that is because the last bullist candles are too extended. It's highly unlikely it will go straight up to + 4k from here.
Second we are in a massive triangle that has to play out first.
So what I believe will happen in the next months is that ETH will pullback to 2500 or even lower 1700. Allot of buyers that FOMO in now will be trapped and panic sell.
Then end on the year when QE has done and there is enough fuel to break out of the triangle. It will happen fast maybe arround nov / dec.
So don't fomo in wait
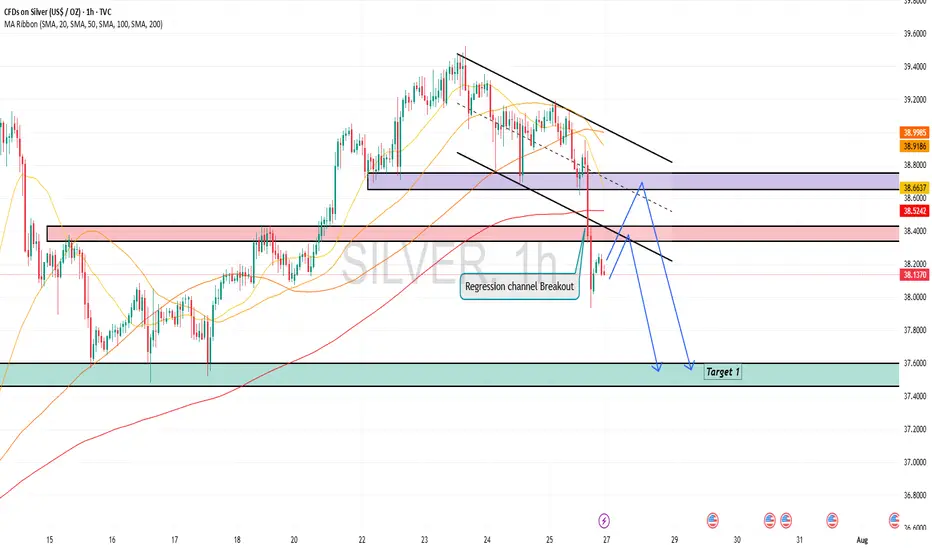
Silver is in the Bearish trend after testing ResistanceHello Traders
In This Chart XAGUSD HOURLY Forex Forecast By FOREX PLANET
today XAGUSD analysis 👆
🟢This Chart includes_ (XAGUSD market update)
🟢What is The Next Opportunity on XAGUSD Market
🟢how to Enter to the Valid Entry With Assurance Profit
This CHART is For Trader's that Want to Improve Their Technical Analysis Skills and Their Trading By Understanding How To Analyze The Market Using Multiple Timeframes and Understanding The Bigger Picture on the Charts
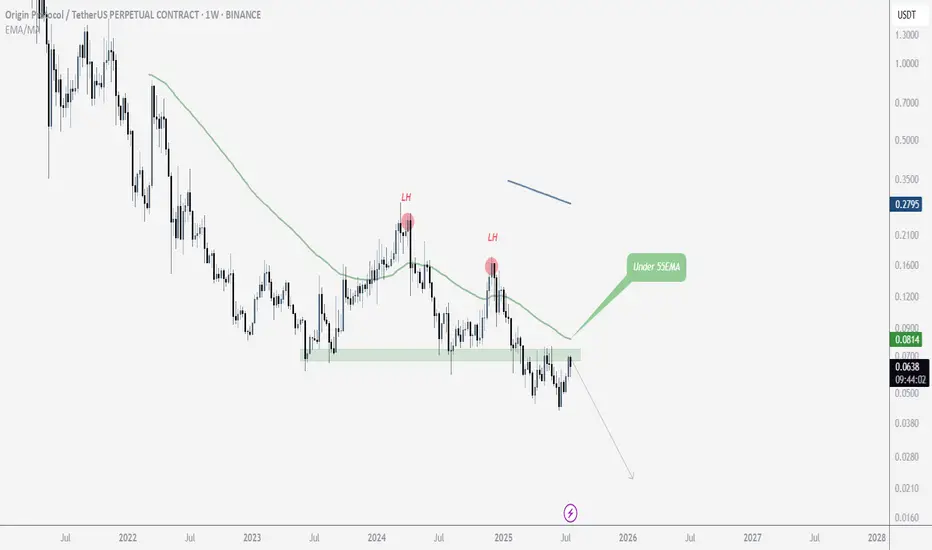
$OGN OGN is in a broader downtrend on the weekly timeframe, consistently forming lower highs (LH). This presents a good opportunity to consider entering a short position. It's worth keeping an eye on it
$ETH Mid-TermLooking at Ethereum from a mid-term perspective, it’s currently sitting near its price ceiling, suggesting a potential need for a correction. Of course, it’s also possible that this level could be broken, depending on overall market conditions. However, the primary scenario is that it fails to break through and pulls back, with the potential reversal zone identified based on Fibonacci levels. On the other hand, the 55 EMA is also providing solid support.
If Ethereum manages to break above this resistance, then we'll wait for either a confirmation or a pullback before entering a long position

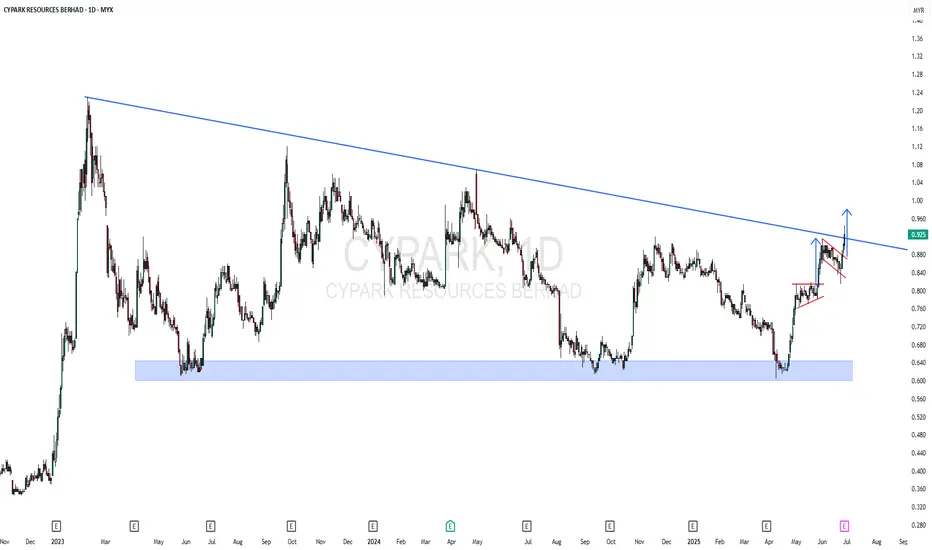
CYPARK - 52 WEEK HIGH CYPARK - CURRENT PRICE : RM0.925
CYPARK made a NEW 52 WEEK HIGH on 26 JUNE 2025. It also breakout a significant down trendline - indicating strong bullish momentum. Nearest target will be the measurement of flag pattern price target which is RM0.980. Then if it continues to rise, RM1.02 will be second target. Stop loss level is RM0.850.
ENTRY PRICE : RM0.920 - RM0.930
TARGET : RM0.980 and RM1.02
STOP LOSS : RM0.850