$Link/USDTLINK has taken on a strong upward trend on the daily timeframe and has the potential for solid growth. The EMA cross also confirms this trend. You can either wait for a pullback or consider entering a partial position at the current level
Trend Lines

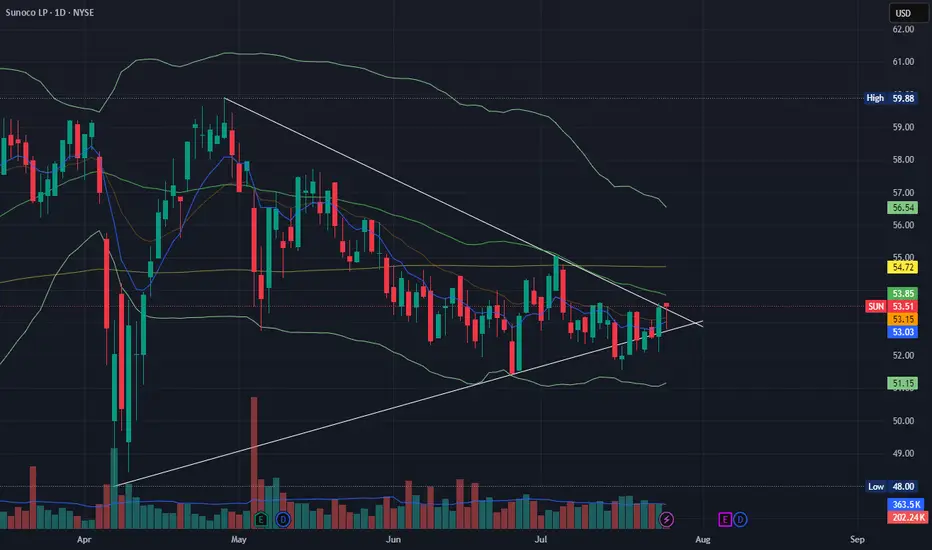
Could this break!?It seems the stock is now found on a range within the EMA9 and EMA21.It now draw a hammer pushing up and heading to test the SMA50.
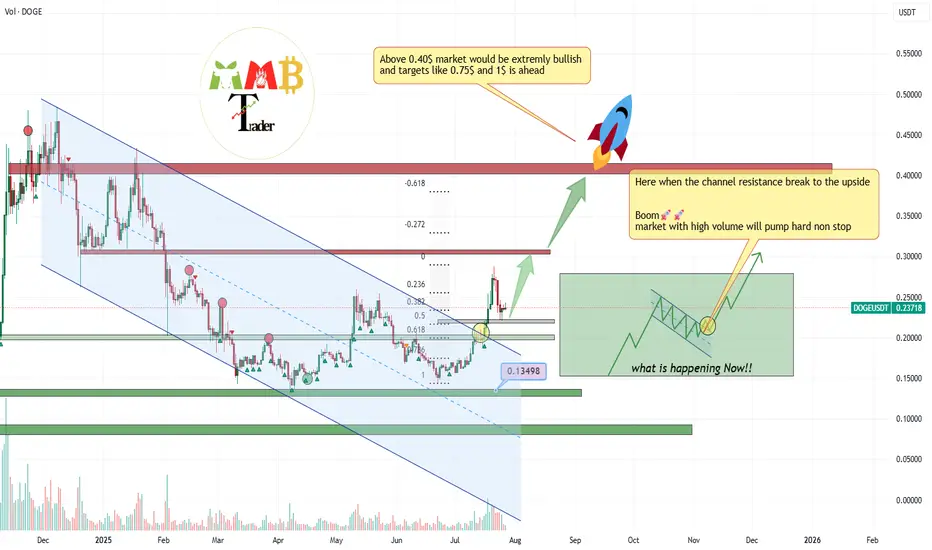
DOGEUSDT is testing 0.5 Fibonacci support (more gain)As we can see the breakout of red trendline also completed and volume increases after that and now market is testing major Fib levels like 0.5 & 0.61 soon we can expect more pump and gain here like the green arrows.
so many stop loss also hit on this fast correction to the downside and price is ready to start next boom pump with kicking out leverage buyers first.
DISCLAIMER: ((trade based on your own decision))
<<press like👍 if you enjoy💚
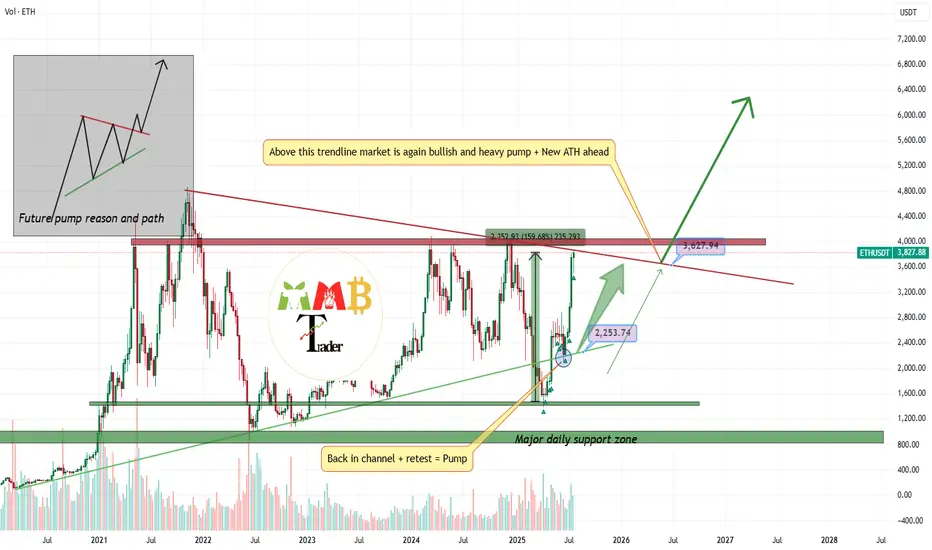
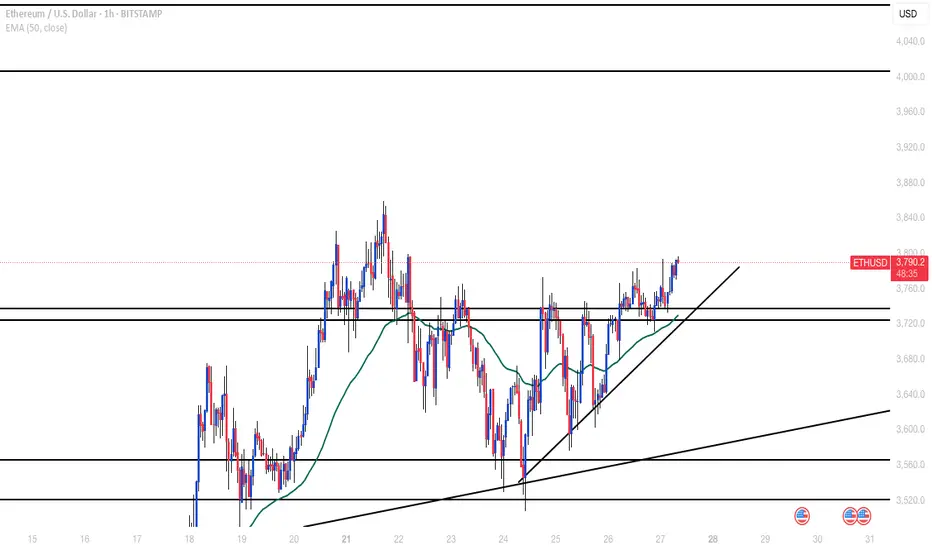
ETHUSDT market is ready to explode and PumpAs we mentioned before Price is now near weekly resistance and range and even short-term fall here is expected but this time i am looking for breakout to the upside and huge pump after that like the green arrows on chart.
So get ready and wait for that breakout and next phase of bull run to start soon.
DISCLAIMER: ((trade based on your own decision))
<<press like👍 if you enjoy💚
Gold Potential UpsidesHey Traders, in tomorrow's trading session we are monitoring XAUUSD for a buying opportunity around 3,320 zone, Gold is trading in an uptrend and currently is in a correction phase in which it is approaching the trend at 3,320 support and resistance area.
Trade safe, Joe.

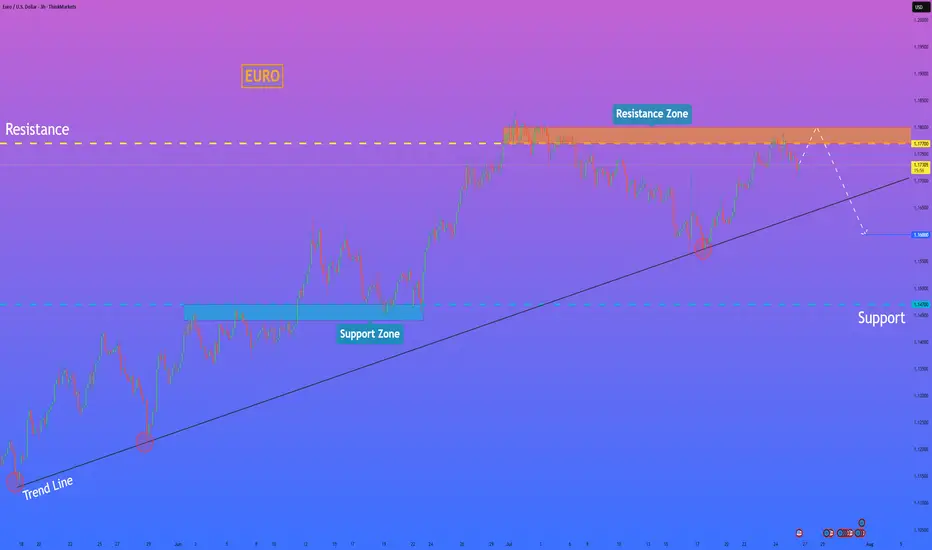
HelenP. I Euro can reach resistance zone and then dropHi folks today I'm prepared for you Euro analytics. If we look at the chart, we can observe a mature uptrend that has been supported by a major ascending trend line for an extended period. However, the momentum of this trend appears to be waning, as evidenced by the price's recent failure to establish new highs. The asset is currently trading below the critical resistance zone of 1.1770 - 1.1800, an area that has proven to be a significant barrier for buyers. My analysis for a short position is based on the condition of a final retest of this resistance zone. I believe the price will make another attempt to rally into this area, and a forceful rejection from this zone would serve as the confirmation that sellers are taking definitive control of the market. Such a rejection would likely initiate a strong downward impulse with sufficient momentum to break the long-standing ascending trend line, a pivotal event that would shift the market structure. Therefore, the primary goal for this bearish scenario is set at the 1.1600 level, a logical target for the price to reach after such a significant structural break. If you like my analytics you may support me with your like/comment ❤️
Disclaimer: As part of ThinkMarkets’ Influencer Program, I am sponsored to share and publish their charts in my analysis.
EURUSD: Detailed Support Resistance Analysis For Next Week
Here is my latest support & resistance analysis for EURUSD
for next week.
Consider these structures for pullback/breakout trading.
❤️Please, support my work with like, thank you!❤️
I am part of Trade Nation's Influencer program and receive a monthly fee for using their TradingView charts in my analysis.

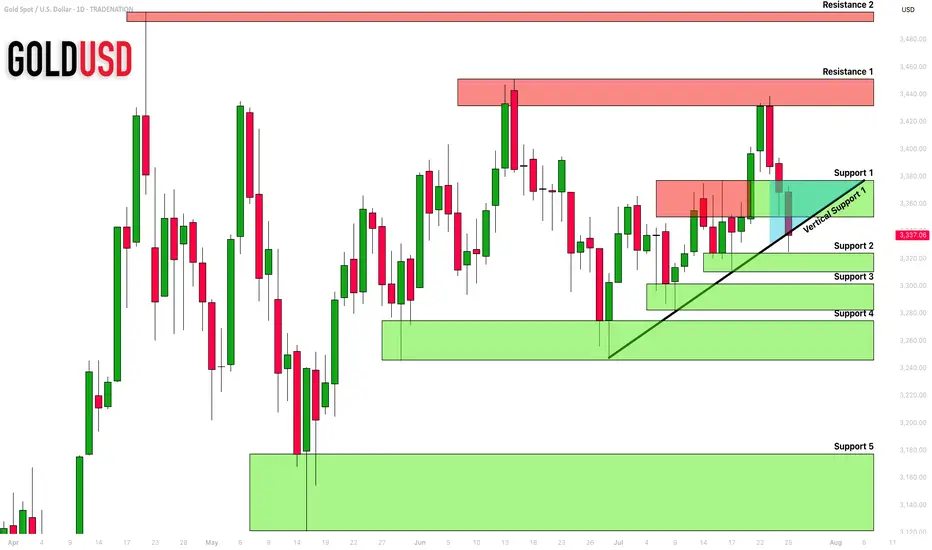
GOLD (XAUUSD): Support & Resistance Analysis for Next Week
Here is my latest structure analysis and important
supports and resistances for Gold for next week.
Consider these structures for pullback/breakout trading.
❤️Please, support my work with like, thank you!❤️
I am part of Trade Nation's Influencer program and receive a monthly fee for using their TradingView charts in my analysis.
ETHUSDBroke above H4 resistance and retested multiple times. Also broke above minor H1 resistance with a retest. Looking at 4,000 as main target
SEI Breakout Setup: Buy the Dip Before the Next Leg UpAfter the low around 0.13 in April, SEI started to recover, and although the first attempt to reclaim the 0.25–0.26 zone failed in mid-May, that key area—a former support from last year—was finally broken at the end of June.
Now, this previous resistance has turned into support, and even though gains have so far been capped by the falling trendline, price is consolidating above support – which could be a sign of bullish pressure building.
If we get a clean break above this descending trendline, momentum could accelerate, opening the way for a push toward the 0.75 resistance.
This is exactly the scenario I’m working with.
I'm looking to buy dips, with an ideal entry around 0.30, while keeping in mind that a move below 0.25 would invalidate the setup.
✅ Risk-reward? With a stop below 0.25, this setup offers a 1:4 R:R, and even a realistic chance at a 2x trade, which would be quite reasonable under current market conditions.

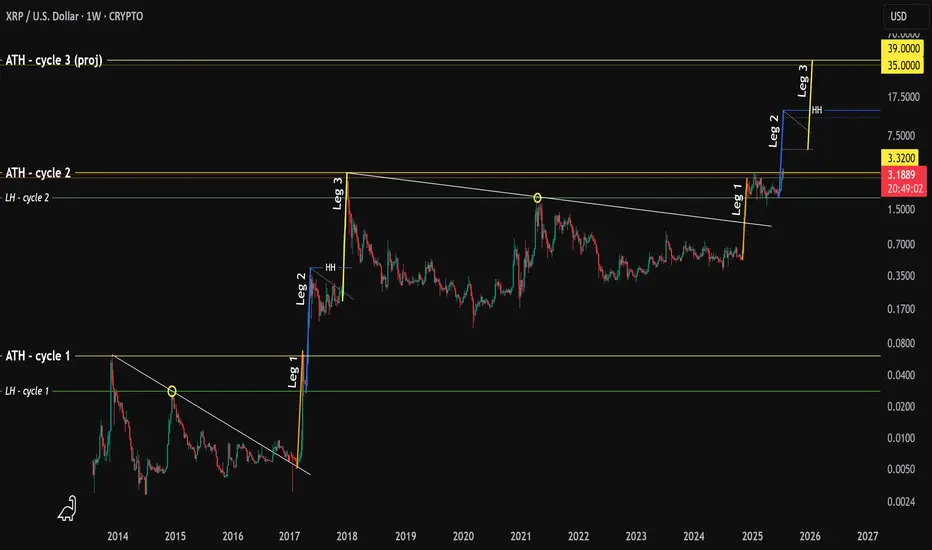
XRP - history repeating?Hello.
I'm going to walk you through what happened in the early years of XRP p.a. and how this fractal might play out today.
Here's what happened.
1. A high was printed in 2013 (ATH)
2. Followed by a lower high (LH)
3. XRP broke out of a downtrend 📈
4. In 2017 price increased 1,280% finding resistance @ ATH (we'll call this "Leg 1")
5. The LH then acted as support, followed by sideways price movement
6. Price increased 1,460% creating a higher-high (or "HH") which surpassed the ATH and this is "Leg 2"
7. Again, sideways price movement.
8. An increase of 1,560% creating a new ATH Dec 2017 - "Leg 3"
What's interesting here is that each leg takes 5 weeks to play out (that's 5 green weekly candles to put a finer point on it).
Fast forward in time - what do we see?
A high..
A lower high....
A breakout of the downtrend..
Followed by..... you guessed it... 5 green weekly candles
Hold on...
A rejection at the ATH
The LH acting as support...
With sideways movement .. 👀
The symmetry is quite profound and provides us with an idea of what will happen next.
If we consider the move in Nov 2024 as "Leg 1" then one could argue that "Leg 2" is currently in play.
Leg 1 was not as significant as the uplift we saw in 2017 (480% vs 1,280%)
However, if we assume that the variance between Leg 1 and Leg 2 rhymes then the projected uplift from the LH would be 550%.. making XRP price roughly $11-13
It follows that price will then move sideways/consolidate/capitulate for several months.
Followed by one last move to the upside which, using the variance between Leg 2 and Leg 3 put the final leg @ 585% or $35-39.
Wild guess but based on historical Bitcoin halving peaks and XRP ATH in both cycle 1 and 2 landed at the back end of Q4, it is assumed the same could happen (put simply: the end of 2025).
You're welcome.
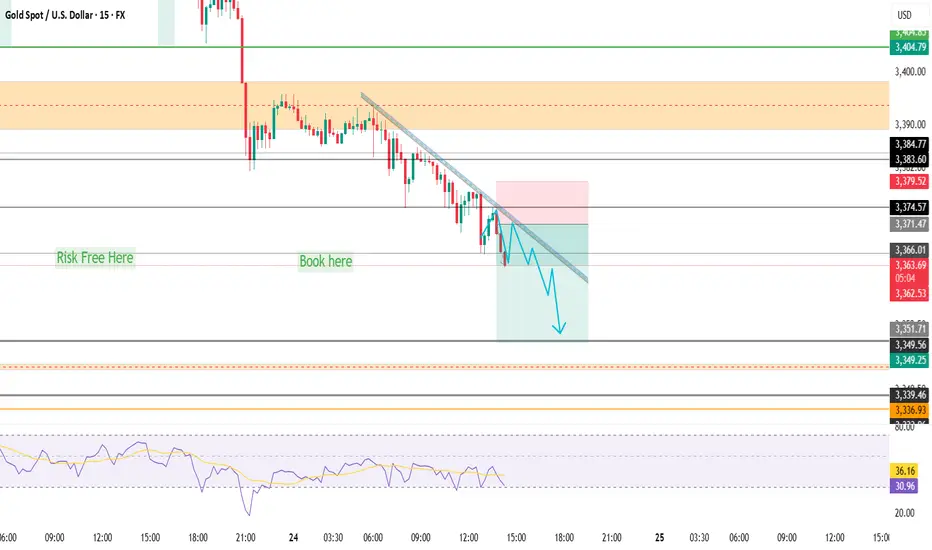
XAUUSD Our old trade is holding in profits from top. but this one is reetry and played well but news can change thing dramatically
Manage risk at first
Sell short plan 15 minutes time frame
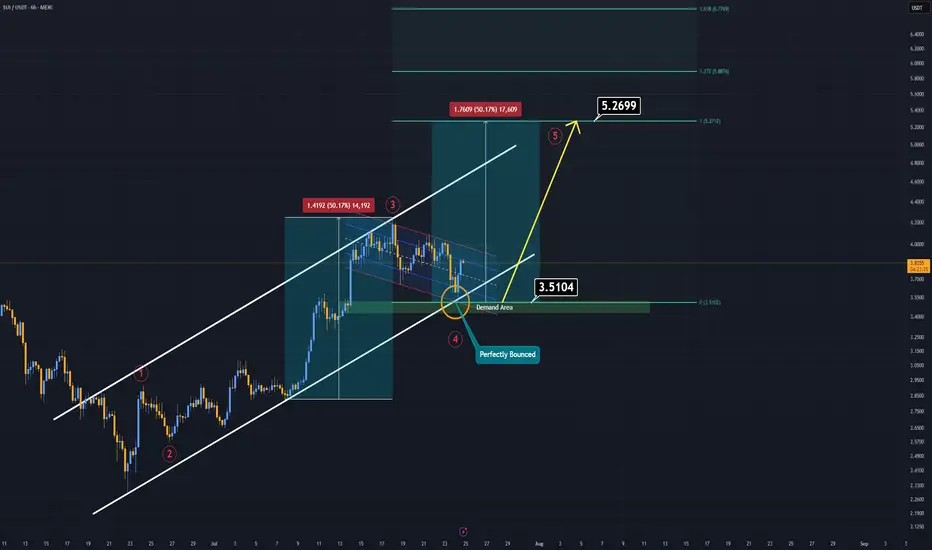
SUI Analysis (6H)If you're on the hunt for extreme risks and potentially high rewards — SUI might be calling your name.
Currently, SUI is trending within a well-respected ascending channel, and just today, it tapped both the demand zone and the lower boundary of this channel.
That’s what we call a double support, and it often signals a strong potential bounce.
SUI now appears to be forming a bullish flag pattern. If this formation breaks to the upside, it could trigger the fifth impulsive wave in line with Elliott Wave Theory.
In such a case, the main target is projected around $5.00–$5.20.
Extreme setups demand extreme conviction.
Good luck.
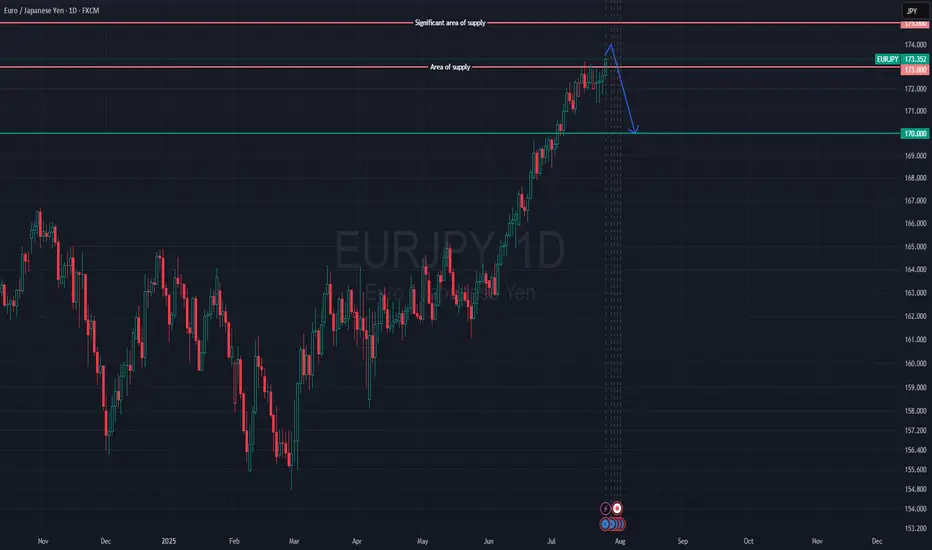
EUR/JPY is Approaching a Key Supply Zone, Possible ShortWe initially anticipated a reversal around the 173.000 supply zone. It’s important to note that the Bank of Japan is currently facing a serious issue in the bond market — there have been several sessions with no bids for Japanese government debt. This is a troubling development and likely means the central bank will step in to purchase bonds soon.
That said, price closed above the 173.000 level on Friday, signaling further bullish momentum. The next key area of interest is the 175.000 level — a significant supply zone we are monitoring closely. If price reacts and pulls back from this level, we’ll be analyzing the yen across other major pairs, as well as keeping a close eye on the euro.
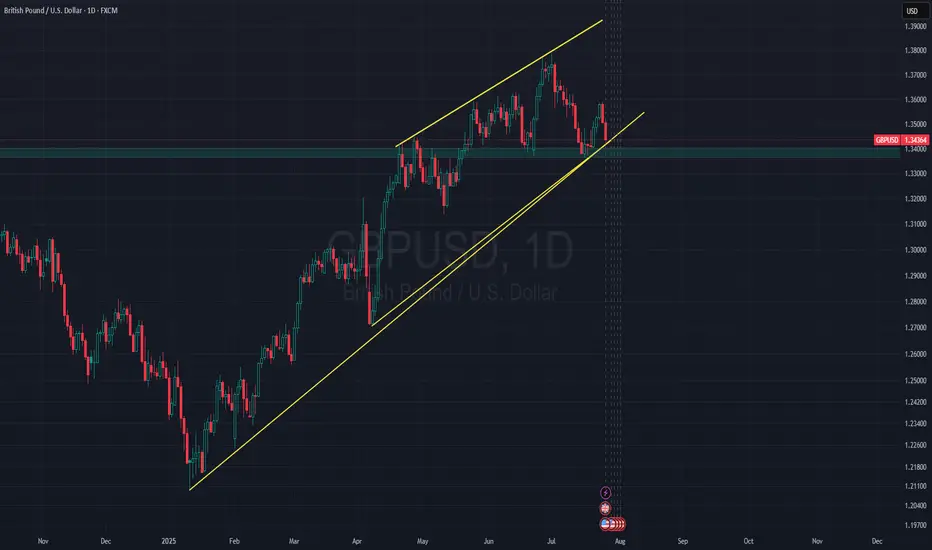
GBP/USD Holds Trendline Support as USD Shows StrengthThe US dollar showed some strength against the British pound during Thursday and Friday session, reflecting overall USD resilience.
Despite the prevailing uptrend, it's possible that GBP/USD may begin to consolidate, given how extended the pound's bullish run has been.
Currently, price is holding above a rising trendline, with additional support near the 1.3350 level. That trendline could play a key role if price pulls back further.
This pair often acts as a gauge for broader USD strength, considering the pound's relative strength. A decisive break above the 1.3600 level could open the door for a move toward 1.3750 in the sessions ahead.
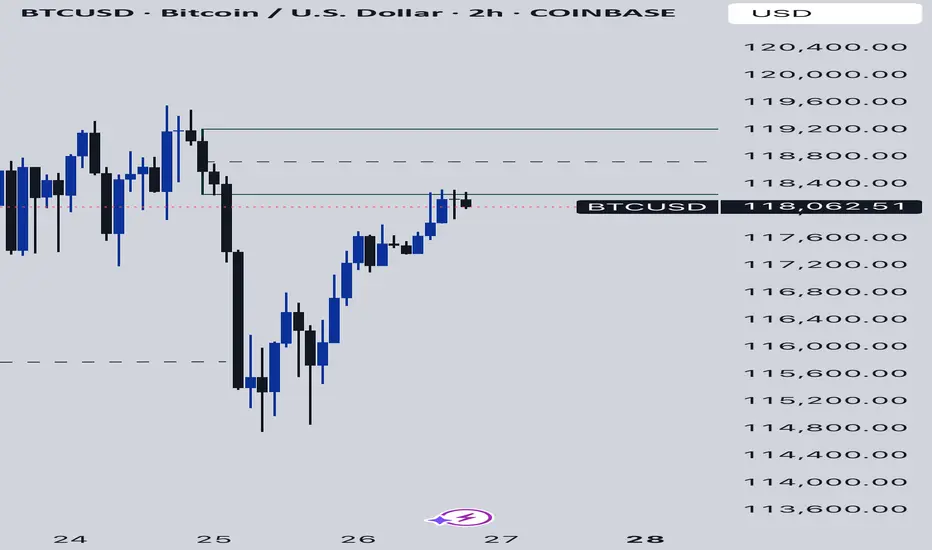
BTCUSD As BTCUSD fell back to 118k, we’ve some good break of structure to the downside with some good momentum seen from the H4 timeframe. Could this be giving us some good bearish sentiment? Or it’s just one of the mini-fluctuations pullbacks as they accumulate enough orders to push the BTCUSD markets even higher.
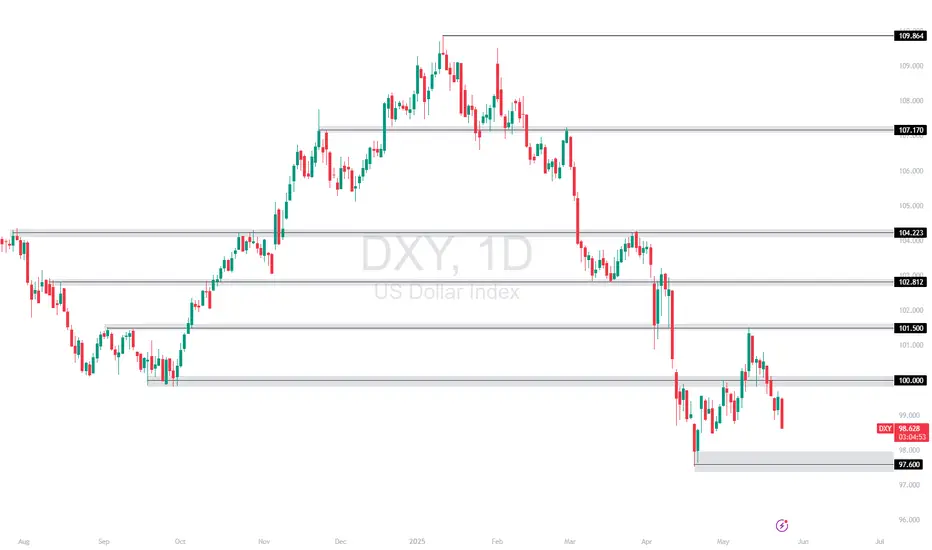
Dollar Index Dips – All Eyes on 97.600?The US Dollar Index (DXY) is currently trading just below the 100.000 🔼 resistance area, following a series of lower highs and lower lows that reflect a clear bearish trend. Price is now approaching the 97.600 🔽 level, which has previously acted as a key turning point and could influence the next directional move.
Support at: 97.600 🔽
Resistance at: 100.000 🔼, 101.500 🔼, 102.812 🔼, 104.223 🔼
🔎 Bias:
🔽 Bearish: The trend remains bearish while price stays below 100.000. A break below 97.600 may lead to further downside continuation.
🔼 Bullish: A bounce from 97.600 followed by a move back above 100.000 could open the door for a recovery toward 101.500.
📛 Disclaimer: This is not financial advice. Trade at your own risk.
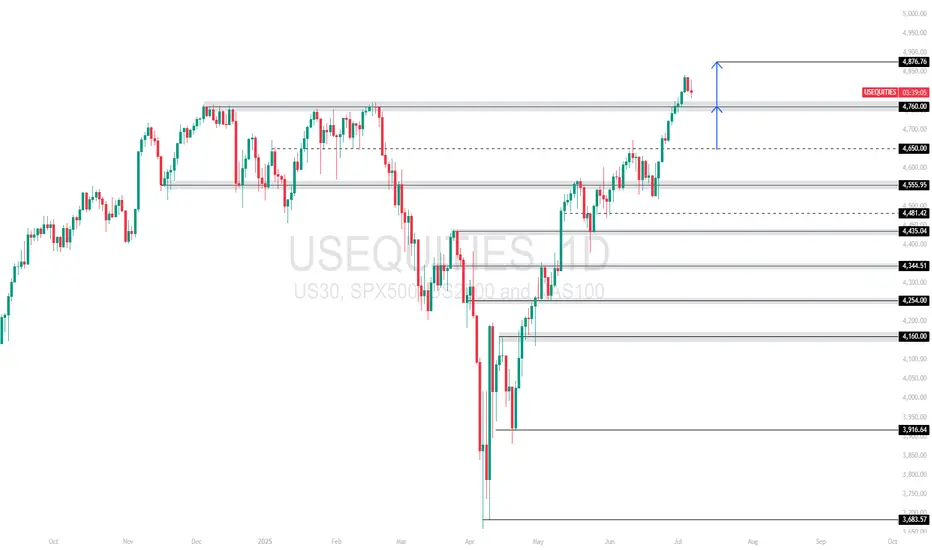
US Equities Index – Retesting Breakout Zone After Strong RallyUS Equities Index recently broke through the 4,760.00 resistance zone with strength, but price is now pulling back slightly, possibly retesting this level as new support. The projected upside targets the 4,876.76 zone, which remains the next key resistance.
Support at: 4,760.00 🔽 | 4,650.00 🔽
Resistance at: 4,876.76 🔼
🔎 Bias:
🔼 Bullish: Holding above 4,760.00 confirms breakout structure with potential continuation toward 4,876.76.
🔽 Bearish: A breakdown back below 4,760.00 could shift bias short-term toward 4,650.00 and 4,555.95.
📛 Disclaimer: This is not financial advice. Trade at your own risk.
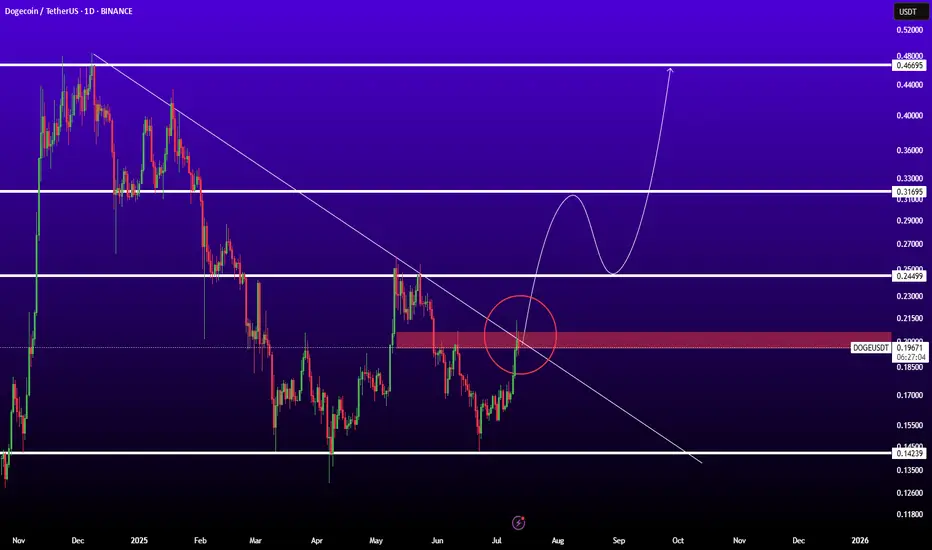
DOGEUSDTBINANCE:DOGEUSDT is in good level for pump because if breaked trendline and resistance 0.200$ ready for sharp movement to next levels.
Resistances: 0.25 - 0.32 - 0.45
Support: 0.15
USDJPY Breakout and Potential RetraceHey Traders, in today's trading session we are monitoring USDJPY for a buying opportunity around 146.300 zone, USDJPY was trading in a downtrend and successfully managed to break it out. Currently is in a correction phase in which it is approaching the retrace area at 146.300 support and resistance area.
Trade safe, Joe.

ETH Soars $2.6B: Inside BBDelta and Cathie Wood’s Strategic BetIn July 2025, the Ethereum network witnessed an unexpected wave of withdrawals totaling over $2.6 billion in unstaked ETH — one of the largest single-month movements since Ethereum’s transition to proof-of-stake. While headlines suggested panic, BBDelta’s analysts and Ark Invest CEO Cathie Wood see a different narrative unfolding: one rooted in strategic portfolio rebalancing and maturing market behavior.
Beyond the Headlines: What the Data Really Shows
According to BBDelta’s internal chain analysis, over 842,000 ETH were unstaked across major validator pools including Lido, Rocket Pool, and Coinbase. However, contrary to expectations, there was no mass sell-off. In fact, more than 65% of unstaked ETH remained idle or were redirected to DeFi platforms such as Aave and Curve.
This distinction is crucial. “Unstaking doesn’t necessarily equal selling,” explains Anna Keller, Senior Market Strategist at BBDelta. “It reflects evolving investor preferences, where capital seeks higher yield or greater liquidity in anticipation of macroeconomic shifts.”
Cathie Wood concurs, stating in a Bloomberg interview, “Ethereum’s staking environment is beginning to resemble fixed-income markets. Institutional holders are unstaking not out of fear, but in search of more dynamic return models.”
Institutional Movements Driving the Shift
One of the primary drivers behind the recent wave appears to be institutional rebalancing. As yields on real-world assets (RWAs) and tokenized Treasury instruments improve, large crypto holders — including family offices and asset managers — are rotating exposure from static ETH staking to diversified yield strategies.
BBDelta’s research notes a spike in ETH deployment into liquid staking derivatives (LSDs) and restaking protocols like EigenLayer, signaling a pivot toward composable and flexible income mechanisms.
Moreover, geopolitical uncertainty and rate policy ambiguity continue to drive caution. “The macro backdrop — especially ongoing tensions around U.S. debt restructuring and eurozone contraction — is pushing capital toward adaptable on-chain positions,” Keller adds.
Cathie Wood’s Perspective: Strategy, Not Stress
Cathie Wood, whose firm Ark Invest holds significant ETH positions, argues the current trend mirrors broader crypto-market maturity. “Volatility remains, but the investor base is smarter,” she says. “What we’re seeing with this $2.6 billion movement is the normalization of active asset allocation in crypto.”
She draws parallels to traditional finance, where fixed-income investors routinely rotate holdings between instruments based on risk and duration. “Ethereum has reached a point where it can sustain a yield curve of its own — that's a sign of strength, not weakness.”
BBDelta’s Market Outlook
BBDelta expects a continued reshaping of Ethereum’s staking landscape, with less concentration in passive lockups and more emphasis on modular strategies. The firm predicts ETH will increasingly serve as a base asset in complex, multi-layered DeFi ecosystems — from restaking protocols to derivatives and real-world asset bridges.
In the near term, BBDelta projects moderate price consolidation around the $3,400–$3,800 range, driven by macro correlations with tech stocks and bond yields. However, the firm remains long-term bullish, citing Ethereum’s dominant position in smart contract execution, enterprise adoption, and regulatory clarity across the EU and Asia-Pacific.
Final Thoughts
The $2.6 billion Ethereum unstaking should not be misinterpreted as a crisis. Rather, as BBDelta and Cathie Wood both emphasize, it represents a milestone in Ethereum’s financial evolution. Sophisticated capital is optimizing exposure, not fleeing risk — and in that, the Ethereum ecosystem proves its readiness for the next institutional wave.

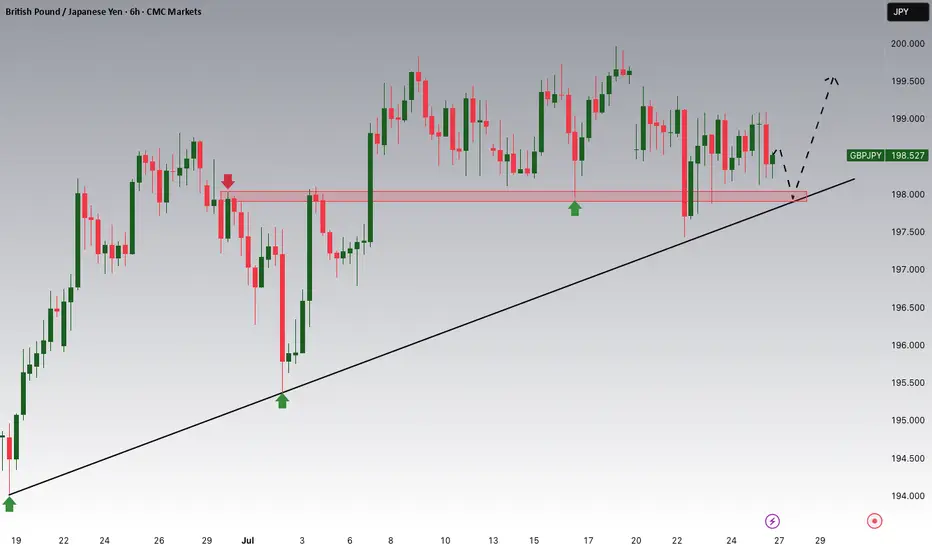
GBPJPY Potential UpsidesHey Traders, in the coming week we are monitoring GBPJPY for a buying opportunity around 197.900 zone, GBPJPY is trading in an uptrend and currently is in a correction phase in which it is approaching the trend at 197.900 support and resistance area.
Trade safe, Joe.
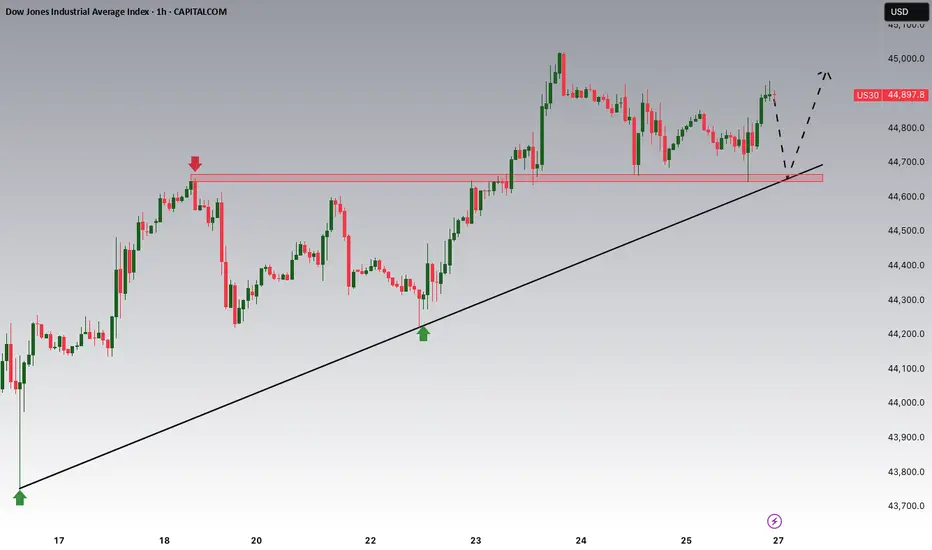
Dow Jones Potential UpsidesHey Traders, in the coming week we are monitoring US30 for a buying opportunity around 44,650 zone, Dow Jones is trading in an uptrend and currently is in a correction phase in which it is approaching the trend at 44,650 support and resistance area.
Trade safe, Joe.