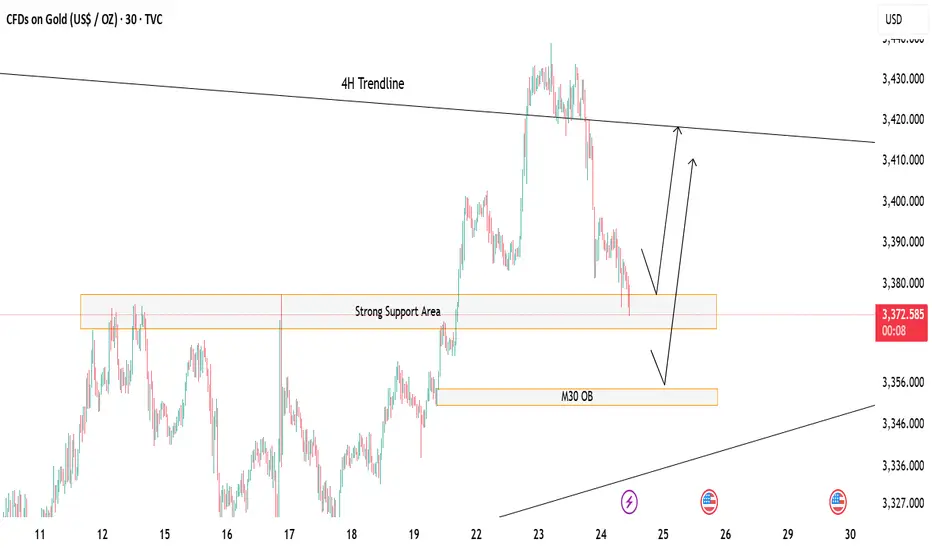
Gold at Key Decision Zone – Bounce or Break?Price is currently hovering above a strong support zone, showing potential for a short-term bounce. 🔁
If this zone holds, we could see a bullish reaction toward the 4H trendline resistance above. 📈
However, a break below may lead price to drop and tap into the M30 Order Block (OB) for a deeper mitigation before any move up. ⚠️
If this happen we could look for potential sell till the OB test otherwise the buying opportunity should focused more
🎯 Watch these key zones carefully – market is at a decision point!
Both buy and sell setups possible depending on how price reacts at these levels.
Trend Lines
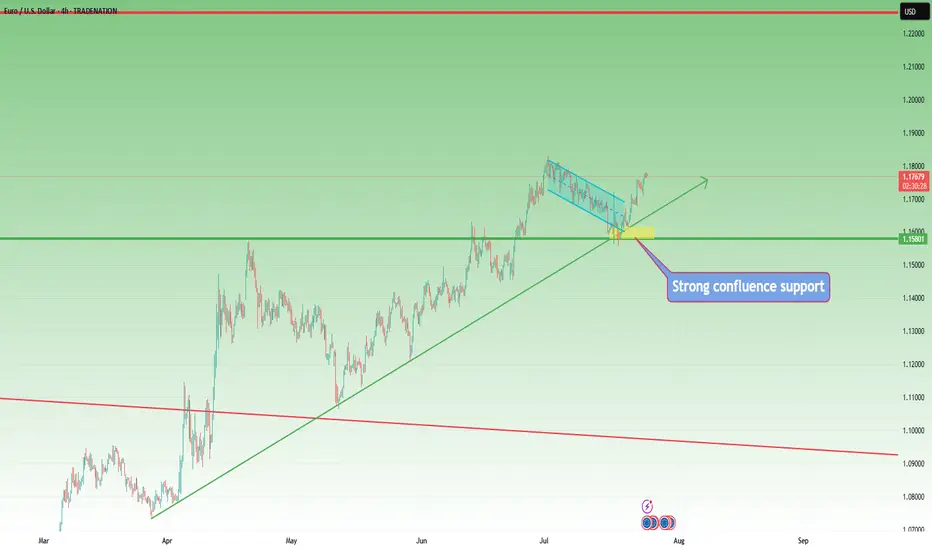
EURUSD – Bulls Still in Control, Trend ResumesIn my previous EURUSD analysis, I pointed out that the pair was nearing an important confluence support around 1.1620, and that – given the overall bullish trend – this zone could offer solid long opportunities.
What followed?
The market briefly dipped below that zone, even challenging the psychological 1.1600 round number. But instead of breaking down, bulls regrouped, stepped in with force, and pushed the pair aggressively higher.
📍 At the time of writing, EURUSD is trading at 1.1770, and my long trade is running with a comfortable 150 pips profit.
🔍 W hat’s Next?
The current structure suggests a continuation of the uptrend, and the logical technical target is the recent high at 1.1830.
Until proven otherwise, this is still a buy-the-dip market.
✅ Buying around 1.1700 could be a valid setup, especially if we see buying power on the intraday chart
⚠️ The Warning Sign
Despite the bullish bias, keep in mind:
If EURUSD drops and closes below 1.1670, the structure begins to shift — and this could signal a deeper correction or even trend reversal.
📌 Until then, the bias remains bullish, dips are to be watched for entries, and 1.1830 is the next checkpoint.
D isclosure: I am part of TradeNation's Influencer program and receive a monthly fee for using their TradingView charts in my analyses and educational articles.
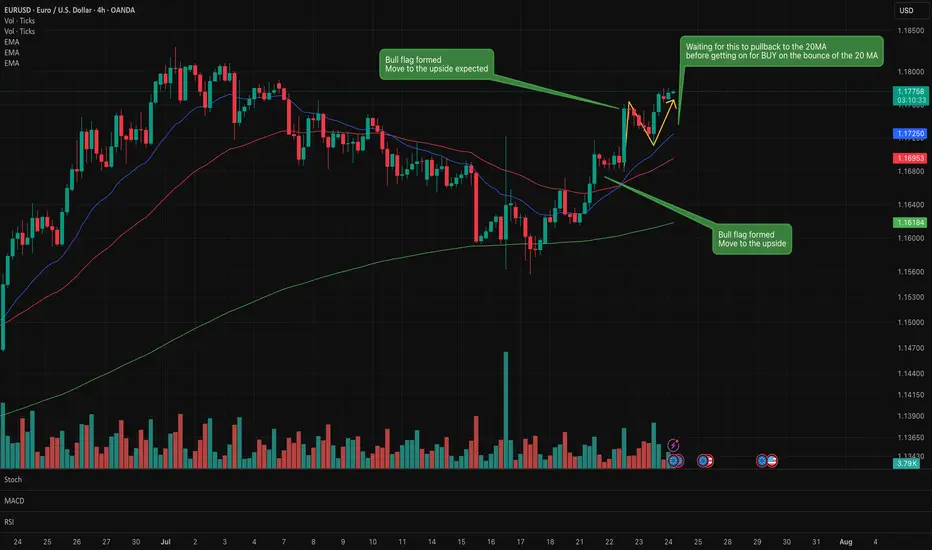
EUR/USD Lots of bull flags formed on the recent chart. Buy/Long Lots of bull flags on this chart which confirmed a move to the upside.
Waiting for a little pullback to the 20MA before considering a buy long order
Waiting to see if this small bear flag forms.
A very interesting instrument to watch at the moment. Full of various signals.
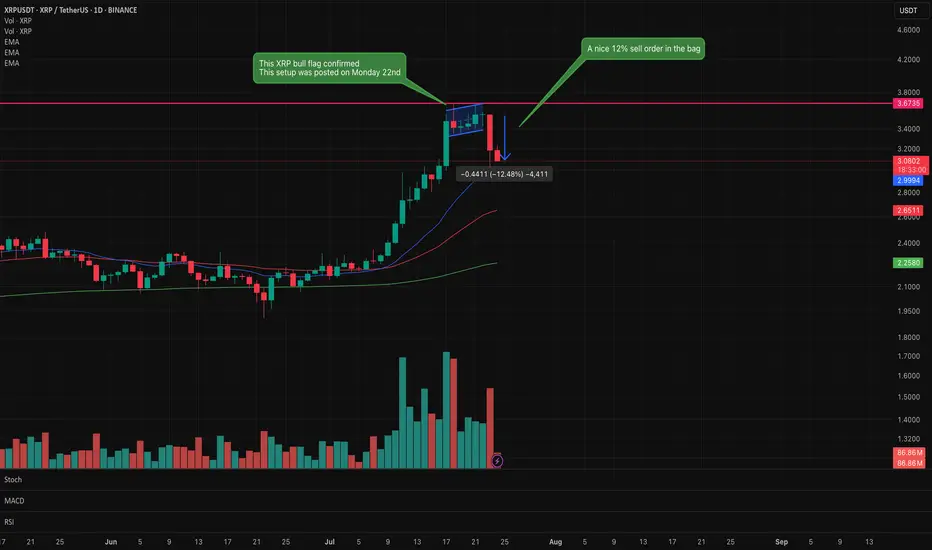
XRP Bear flag confirmed. Looking for support in the decline.XRP bear flag identified on Monday 22nd has now confirmed with a nice 12% short sell.
This signals do not always confirm but when they do it is satisfying that the analysis and patience has paid off.
Trading is all about controlling emotions and being patient. Wait for the confirmation before executing.
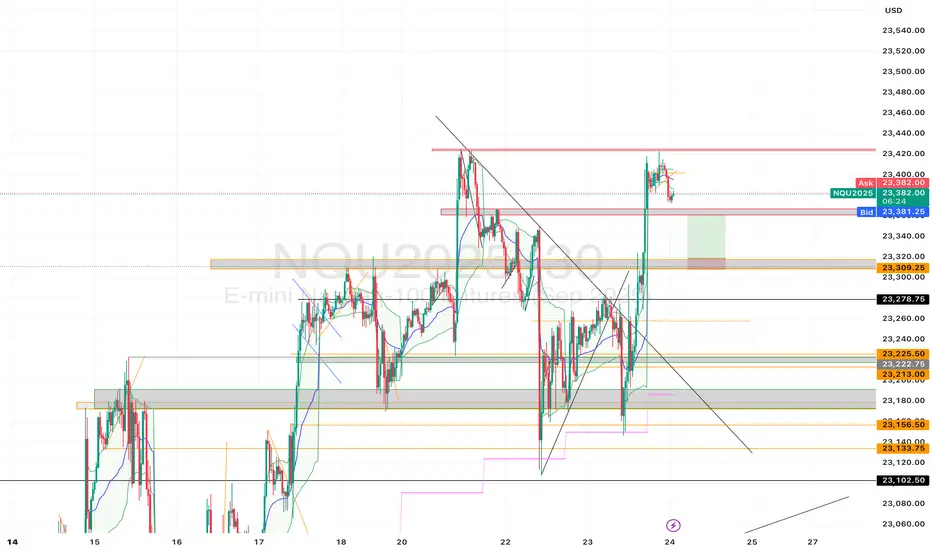
Overnight/Thursday 7/24 trade idea. Looking for some pull back to the 23,310 area for a 50 point gain. I’m actually going to enter with two positions with micro contracts four micros at 310 and another four at 300 with a stop around 290.
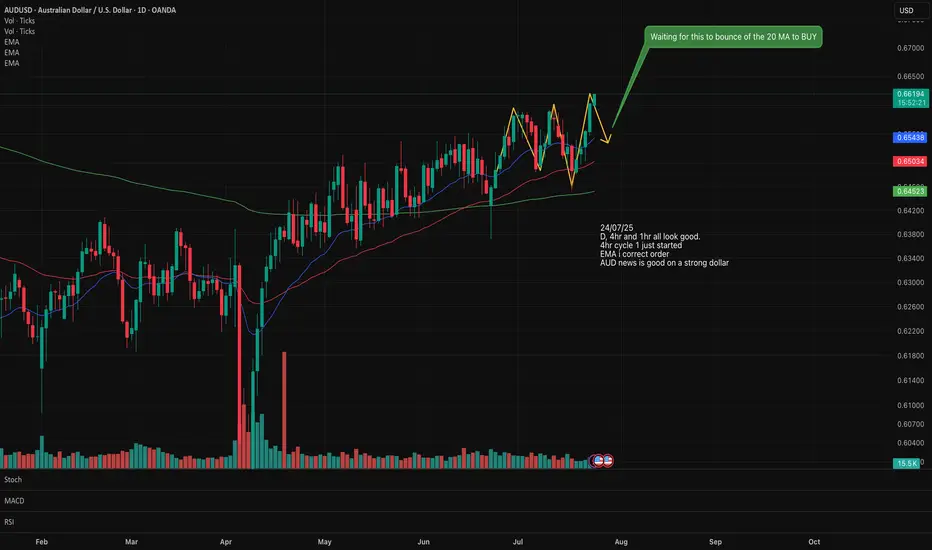
AUS/USD Long/Buy setting upLooking at AUS/USD for a potential Buy setting up on the Daily and 4 hr.
EMA has lined up in the correct stacking order.
An upward trend can be observed. The 20 has crossed over the 50.
We are starting a new Cycle 1 on the upward so I will wait for the pull back to the 20MA which will form the Cycle 2 then wait for the new Cycle 1 on the upward to start again before I buy in.
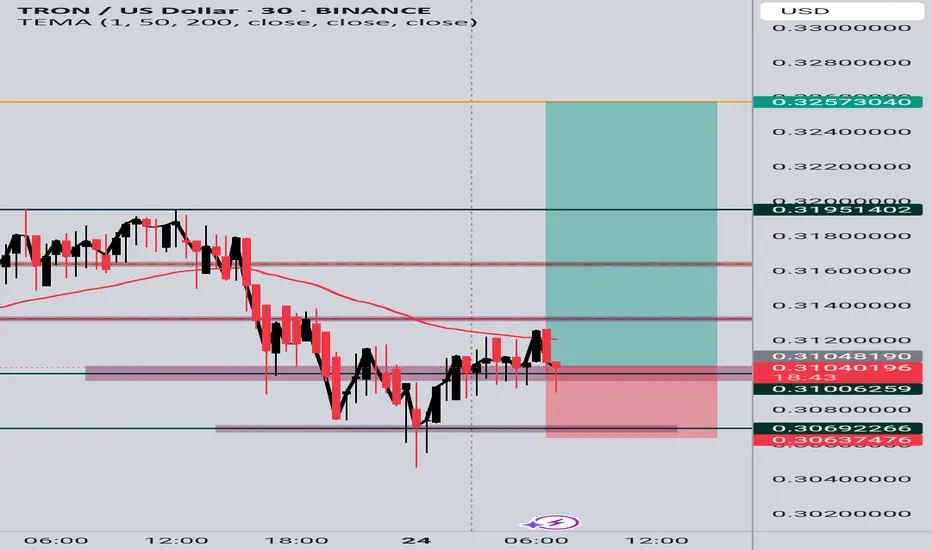
TRX/USD Long Setup (30m Chart)TRX/USD Long Setup (30m Chart)
Price formed a consolidation base around 0.3100 after a strong drop. I entered long on a potential bullish breakout above the short-term structure, targeting partial profits at key resistance levels:
TP1: 0.3195
TP2: 0.3257
Stop loss is set below recent support near 0.3063.
Entry is based on a possible reversal and EMA resistance break.
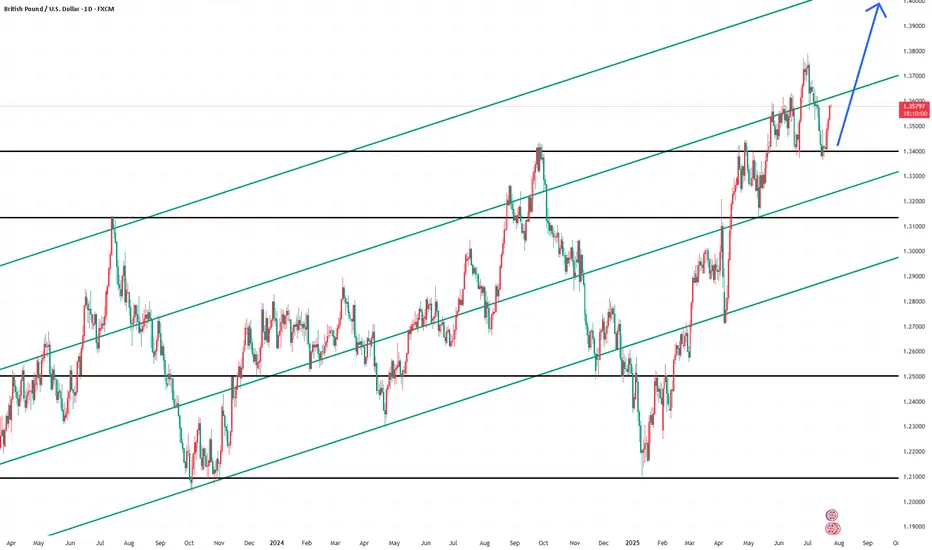
GBPUSD InsightWelcome, everyone!
Please share your personal opinions in the comments. Don’t forget to hit the booster and subscribe!
Key Points
- Japanese Prime Minister Shigeru Ishiba has completely denied reports suggesting he might resign, indicating his intention to remain in office.
- The European Union is reportedly preparing retaliatory tariffs worth €100 billion in case negotiations with the United States break down.
- According to major foreign media outlets, the U.S. is close to agreeing on a plan to impose a 15% tariff on EU goods, including automobiles.
This Week's Key Economic Event
+ July 17: Eurozone June Consumer Price Index (CPI)
GBPUSD Chart Analysis
After confirming support at the 1.34000 level, the pair has rebounded and is maintaining an upward trend. The 1.36000–1.36500 range, where trendline resistance lies, will be a key hurdle. If it successfully breaks through this zone, the uptrend is expected to continue smoothly toward the 1.40000 level.
However, if the market unexpectedly shifts downward, we will promptly adjust our strategy.
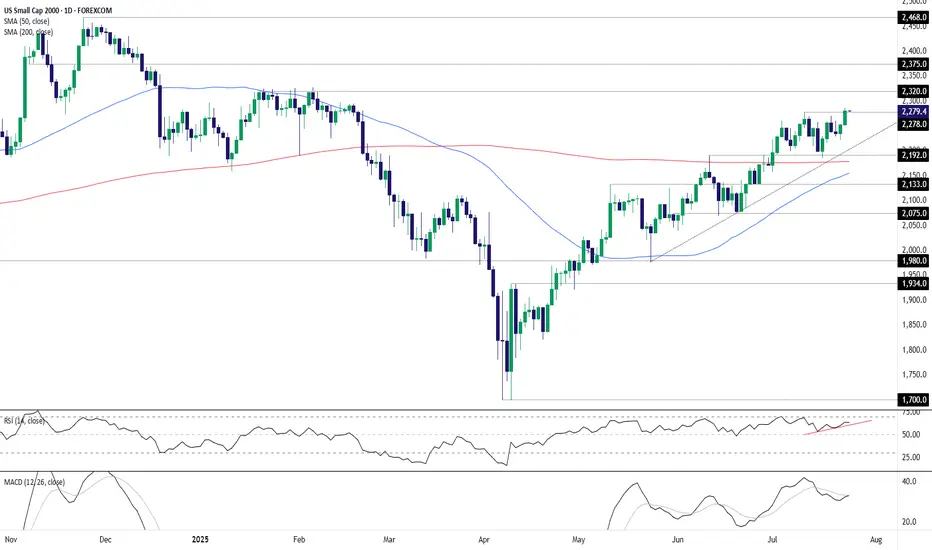
U.S. Small Caps Break Out: Dash for Trash Gathers SteamSitting in an obvious uptrend with momentum indicators skewing increasingly bullish, it looks like the U.S. small cap 2000 contract wants to go higher. The dash for trash is on!
Having just cleared the July 10 high of 2278, it’s provided a decent setup to initiate fresh longs, allowing for a stop beneath that level for protection against a reversal.
2320 screens as an initial target given the contract consistently struggled to break above it earlier this year. Beyond that, 2375 and the record high of 2468 are the levels to watch.
Good luck!
DS
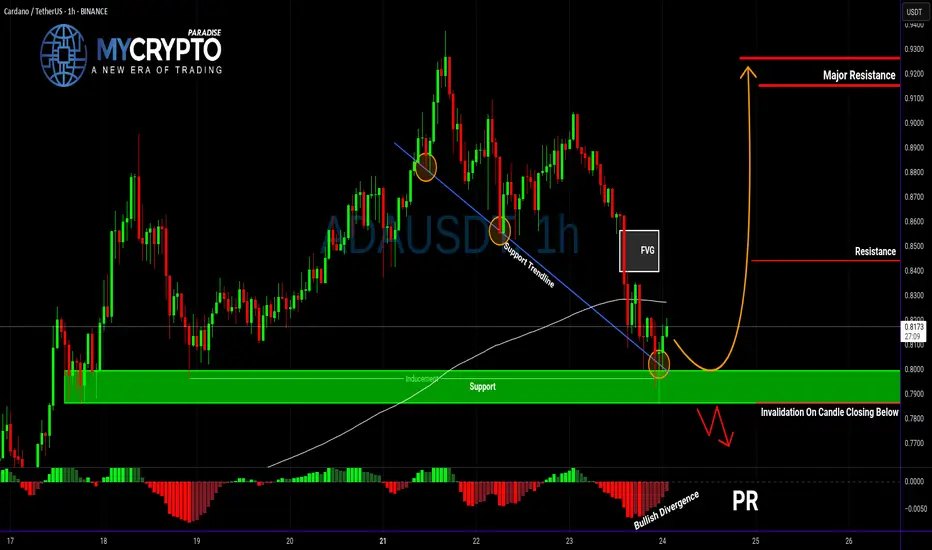
ADA About to Explode or Collapse?Yello Paradisers — is ADA gearing up for a breakout, or are we walking straight into a bull trap? After the recent pullback, the market is throwing mixed signals, but this setup is becoming too important to ignore. Here’s what we’re seeing right now on ADAUSDT.
💎ADA is currently showing positive signs of strength after a solid retracement. Current support zone is not only a historical price pivot, but it's also aligned with a supportive trendline, the 200 EMA, and a developing bullish divergence on the chart. All these factors combined are increasing the probability of a short-term bounce — but that doesn't mean we go in blind.
💎For aggressive traders, entering at the current price might make sense, especially if you’re targeting the first resistance level. However, it’s important to note that this entry offers a relatively limited reward compared to the risk — roughly a 1:1 risk-reward ratio — so it’s crucial to size your position accordingly and keep tight control over your stop loss.
💎If you're looking for a cleaner setup with a better risk-to-reward profile, patience is key. A more favorable scenario would be waiting for a proper pullback and a confirmed retest of the support zone. Ideally, you want to see a strong bullish candle at the support level to signal continuation — that’s when the setup shifts from average to high-probability.
💎But be cautious. If the price breaks down and closes a candle below our support zone, the entire bullish idea becomes invalid. In that case, it’s much wiser to step back and allow the market to develop more structure before re-engaging. Forcing trades in uncertain conditions is where most traders lose, and we don’t want to be part of that crowd.
🎖Strive for consistency, not quick profits. Treat the market as a businessman, not as a gambler. Be patient, Paradisers — only those who follow structured strategies and risk management will thrive in the long run.
MyCryptoParadise
iFeel the success🌴
USDCHF is Attempting to Break the Trend!!Hey Traders, in today's trading session we are monitoring USDCHF for a selling opportunity around 0.79720 zone, USDCHF was trading in an uptrend and currently seems to be attempting to break it out. If we get dips below the trend i will be looking for a retrace towards more lows.
Trade safe, Joe.

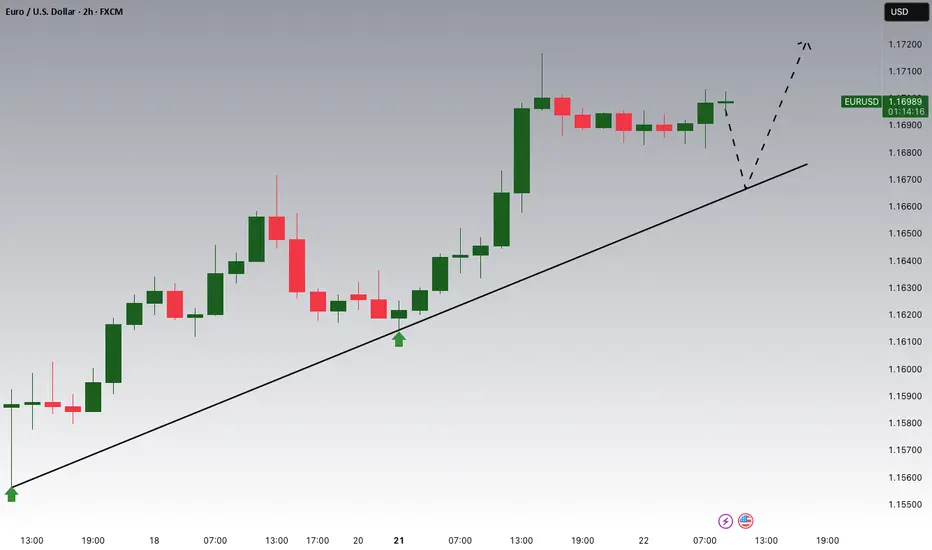
EURUSD Potential UpsidesHey Traders, in today's trading session we are monitoring EURUSD for a buying opportunity around 1.16650 zone, EURUSD is trading in an uptrend and currently is in a correction phase in which it is approaching the trend at 1.16650 support and resistance area.
Trade safe, Joe.
EUR/USD Surges into Resistance Ahead of ECBEuro is poised to snap a two-week losing streak with EUR/USD up more than 1.2% since the Sunday open. The advance takes price back into weekly resistance ahead of tomorrow’s European Central Bank rate decision and the focus now shifts to the weekly close for guidance.
Euro plunged more than 2.3% off the June high with price briefly registering an intraweek low at 1.1557 before rebounding. The rally takes EUR/USD into resistance at the objective high-week close (HWC) / high-close at 1.1775- looking for a reaction off this mark with a weekly close above needed to keep the immediate advance viable into the close of the month.
Initial weekly support remains with the 2016 swing high at 1.1616 with the medium-term outlook still constructive while above the March trendline (red). Ultimately, a break below the 2020 / 2022 highs at 1.1497 would be needed to suggest a more significant high is in place / a larger correction is underway with subsequent support seen at the 2024 high close / May low-week close (LWC) at 1.1164.
A breach / close above this pivot zone exposes the upper parallel (blue), currently near 1.1840s, with the next major technical consideration eyed at 1.1917-1.2020- a region defined by the 100% extension of the 2022 advance and the 38.2% retracement of the 2008 decline (area of interest for possible top-side exhaustion / price inflection IF reached). Subsequent resistance objectives eyed at the 2021 HWC at 1.2227 and the 2018 high-close at 1.2456.
Bottom line: Euro rebounded just ahead of the March uptrend with the rally now testing the yearly high-close ahead of the ECB- watch the Friday close with respect to 1.1775. From a trading standpoint, a good zone to reduce portions of long-exposure / raise protective stops- losses would need to be limited to this week’s low IF price is heading higher on this stretch with a close above the upper parallel still needed to fuel the next major leg of the advance.
-MB

PLTR moving higherPLTR expected to move higher.
The price is bouncing off the 20MA and respecting it.
Making new higher/highs and higher lows.
Earnings is due shortly, which could have a negative impact to the price.
However, the long term outlook for the company is still strong.
Anyone else have thoughts on this stock?

Perfect profit on short position, long TP 3450#XAUUSD
Gold is in an upward trend from the daily chart. From the technical indicators, the SMA5-SMA10 moving averages are golden crosses, BOLL opens upward, the K line runs on the upper track of the daily Bollinger Band, and the MACD continues to increase, indicating that the bullish trend remains unchanged📈.
The approaching August 1st tariff deadline, coupled with uncertainties such as the Federal Reserve, provide short-term support for gold🔍.
📊The current lower support is at 3410-3400. If it falls back to this level during the day, you can consider going long. Gradually check 3430 and 3440 on the upside, and pay close attention to the breakthrough of the 3450 level🏅. If it effectively breaks through 3450, gold is expected to break through the historical high. If it encounters resistance near 3450 as in the previous trend, you can consider shorting📉.
🚀BUY 3410-3400
🚀TP 3430-3440
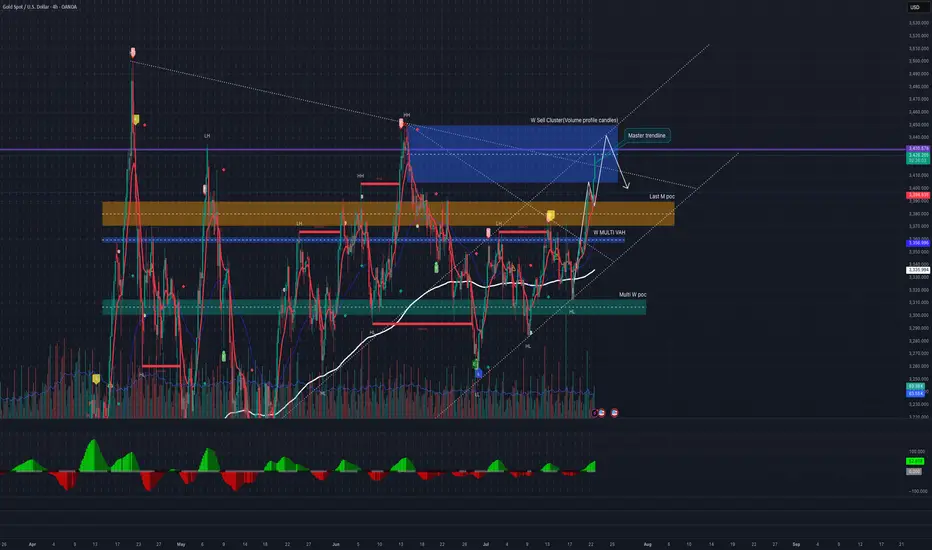
Short Idea possibleFollowing up from the recent run up to @ 3400, from a trend line POV there are still 2 targets that will be favourable for shorts.
These levels are 3400, 3420 to 3440.
The 3420 to 3440 range also confluences with weekly sell cluster, which means seller conviction in the past. As time went by, this level was protected by sellers, high probability they do this same this time
Looking for a slow rotation and Choch on 5 to 15 mins within the ranges of 3420 - 3440 for a strong pullback to @ 3370.
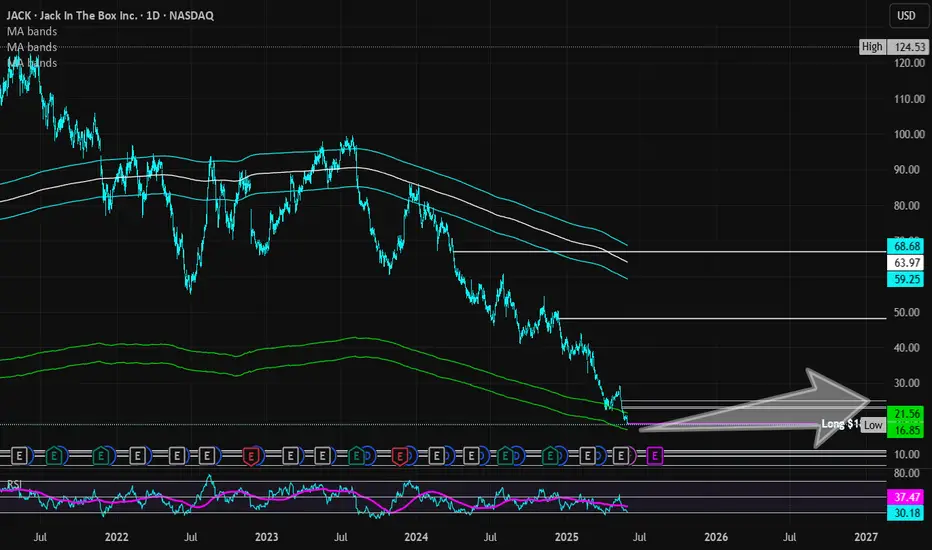
Jack in the Box | JACK | Long at $18.48Jack in the Box NASDAQ:JACK has taken a massive hit to its stock price since its peak in 2024 at just over $124 a share. It's currently trading around $18 and has entered my "crash" simple moving average zone. More often than not, this area signifies a bottom (or future bounce), but I view it more as a consolidation area to accumulate shares. Float = 18M; short interest = 19%...
Looking at NASDAQ:JACK fundamentally, this isn't the healthiest of restaurant companies. It is using a high level of debt to finance its operations and a high dividend yield of 9.28%. The company's revenue and profits have been slowly declining since 2023, as well. However, after 2025, the company anticipates a slow turnaround to begin. It will be closing 80-120 restaurants across the U.S. in 2025, which is a positive to help the company moving forward. NASDAQ:JACK also just got a new CFO and they are (at least from an outsider's view) attempting to change to generate share value. At this share price, I believe the company is in dire straits to get some investor confidence back. It's a strong name with long history.
While the stock price may hit true resistance at just under $17, NASDAQ:JACK is in a personal buy zone at $18.48. Targets are set low due to economic uncertainty.
Targets:
$23.00 (+24.5%)
$25.00 (+35.3%)
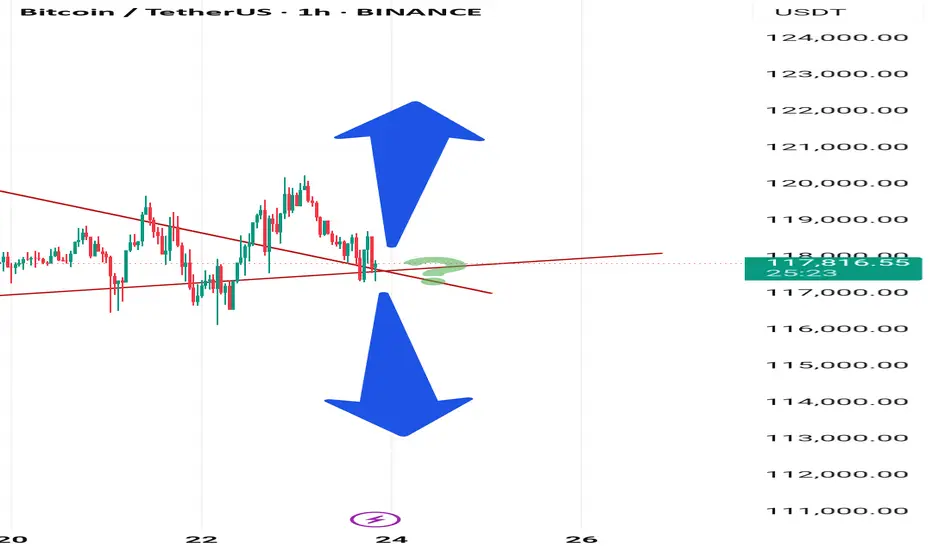
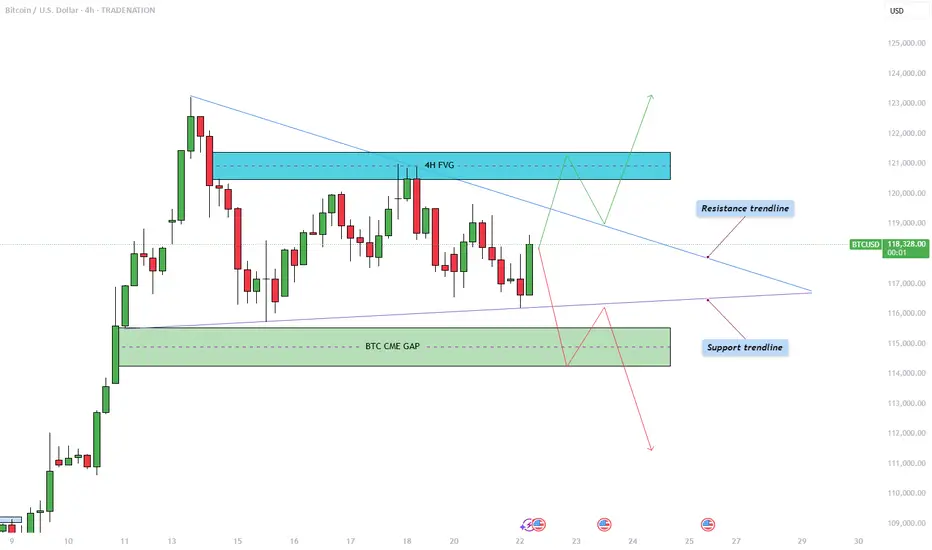
Bitcoin - Triangle pattern consolidation!The Bitcoin price action is currently coiling within a symmetrical triangle pattern on the 4-hour chart, as illustrated in the chart provided. After a significant bullish move earlier this month, BTC has now entered a phase of consolidation, marked by a series of lower highs and higher lows. This has formed a triangle pattern, suggesting an imminent breakout as price nears the apex. The upper boundary of the triangle acts as dynamic resistance, while the rising lower trendline provides firm support. Given the preceding upward momentum leading into this consolidation, the bias slightly favors a breakout to the upside, though the market can always surprise.
Bullish Scenario
In the bullish case, Bitcoin would need to break convincingly above the descending resistance trendline. Should that occur, the next key level to watch lies within the 4-hour bearish Fair Value Gap (FVG) between $120,500 and $121,400. This region represents an area of inefficiency where price moved rapidly in the past, and it is likely to attract selling pressure again. Bulls would ideally aim to reclaim this zone with strong momentum and potentially use it as support in a retest scenario. A successful retest of the triangle’s upper boundary could also trigger a liquidity grab above recent highs, particularly above the all-time high levels.
Bearish Scenario
On the flip side, a bearish breakout would involve BTC breaking below the ascending support trendline. If this happens, the most probable downside target would be the CME gap left behind from two weekends ago, located between $114,300 and $115,500. This price gap occurred due to the discrepancy between Friday’s closing price and Sunday’s opening price on the Chicago Mercantile Exchange, often a magnet for price reversion. After this gap is filled, it is possible that BTC sees a short-term bounce to retest the triangle from below, before potentially continuing lower to address further imbalances in price action.
How to Confirm a Valid Breakout
Trading triangle patterns can be deceptive, as BTC often exhibits false breakouts designed to trap traders on the wrong side. To confirm a valid breakout, it's crucial to observe at least a few 4-hour candles closing decisively above or below the triangle boundaries. Additionally, breakout strength should be accompanied by a noticeable increase in volume. A breakout without volume confirmation is often a sign of a fake move, and entering trades under such conditions can be highly risky.
Final Thoughts
BTC is currently consolidating within this symmetrical triangle formation, signaling a period of indecision and potential volatility ahead. While both bullish and bearish scenarios are plausible, it is essential to wait for clear confirmation before committing to a position. Patience and discipline are key, especially when navigating patterns prone to fake-outs. For now, remaining on the sidelines until a confirmed breakout occurs may be the most prudent strategy.
--------------------------
Disclosure: I am part of Trade Nation's Influencer program and receive a monthly fee for using their TradingView charts in my analysis.
Thanks for your support. If you enjoyed this analysis, make sure to follow me so you don't miss the next one. And if you found it helpful, feel free to drop a like and leave a comment, I’d love to hear your thoughts!
The callback continuity is poor, and the bulls are still strong📰 News information:
1. Geopolitical situation
2. Tariff retaliation
📈 Technical Analysis:
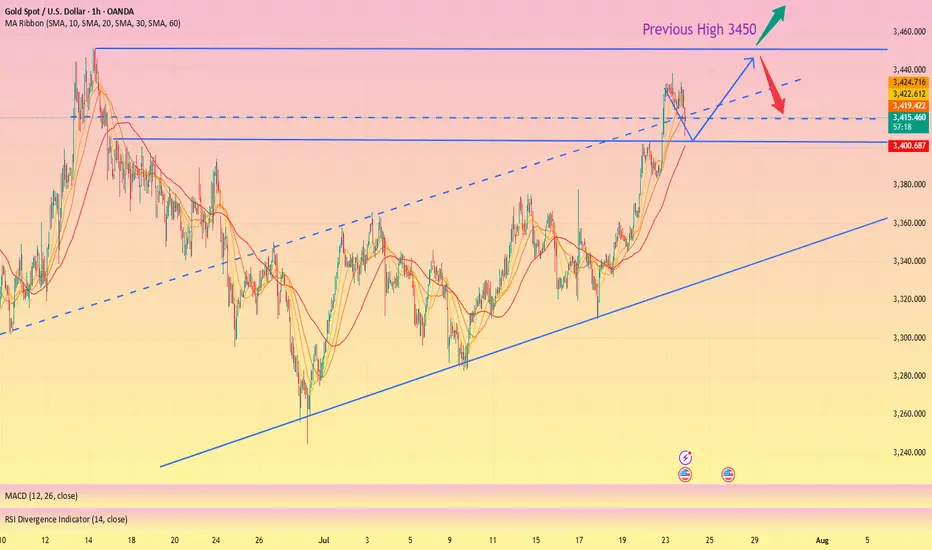
Trump continued to lash out at the Fed, but seemed to have backed off on whether to remove Fed Chairman Powell. The continuous rise of the gold index, once close to 3440, also ushered in a new high in more than a month. Next, we need to pay attention to whether gold can reach the 3450 mark.
Judging from the daily chart, there were three times when it touched around 3450 and then fell back. If it breaks through and stabilizes above 3450 this time, the historical high of 3500 may be refreshed. If it cannot effectively break through 3450, the probability of subsequent retracement is still very high.
From the hourly chart, the bottom support is almost at 3405-3400. However, the recent rhythm belongs to the consolidation of the Asian and European sessions, the US session has begun to rise, and the risk of serious overbought data indicators is still there. This is why I told everyone in the morning that we need to be vigilant about the current rise. Waiting for a pullback to go long is relatively more stable. I also explained in the morning that if it falls below 3405-3400, the decline may continue to around 3385. After all, the fundamental purpose of our trading is to make a profit, so we must minimize the foreseeable risks to the greatest extent possible.
On the whole, if there is an obvious stop-loss signal at 3405-3400, you can consider going long and looking at 3450. Once it falls below 3400, don't chase it easily, and pay attention to the possibility of a retracement below 3385.
🎯 Trading Points:
BUY 3405-3400
TP 3440-3450
In addition to investment, life also includes poetry, distant places, and Allen. Facing the market is actually facing yourself, correcting your shortcomings, facing your mistakes, and exercising strict self-discipline. I share free trading strategies and analysis ideas every day for reference by brothers. I hope my analysis can help you.
FXOPEN:XAUUSD OANDA:XAUUSD FX:XAUUSD FOREXCOM:XAUUSD PEPPERSTONE:XAUUSD TVC:GOLD
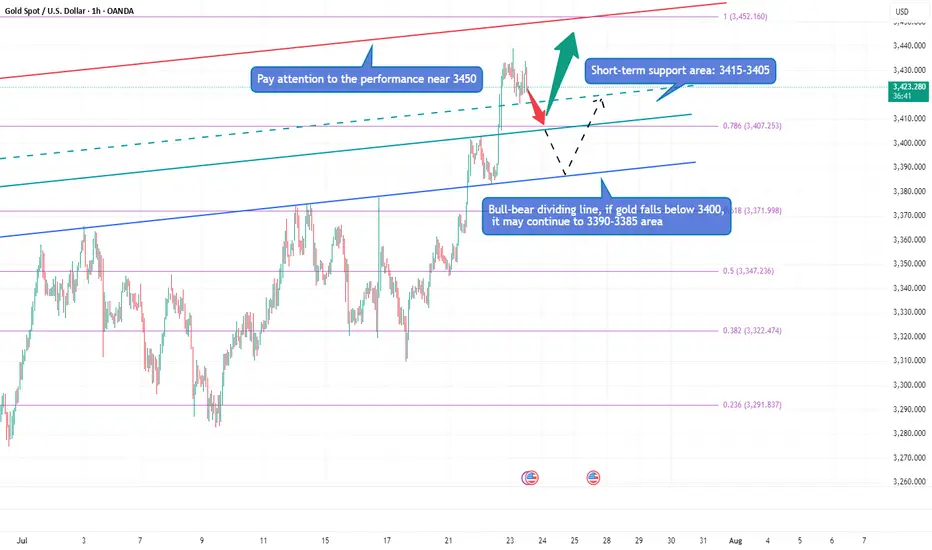
Gold is surging, can it hit 3500?Due to the trade tensions caused by tariffs and the continued conflict between the White House and the Federal Reserve, gold continued to rise, and the current highest has reached around 3438. Obviously, after gold rose strongly and broke through the 3400 and 3420 areas, the bullish sentiment of gold has been ignited. Next, we need to pay attention to whether gold can test and stand firm at 3450.
Gold is currently extremely strong, and there is basically no room for retracement during the rise. As gold rises, the short-term support below has also moved up to the 3415-3405 area; and the upper side needs to pay attention to the breakthrough of the 3450 mark. If gold continues to break through 3450, then gold has the potential to challenge 3500 again; however, if gold still cannot effectively break through when it touches the area near 3500 again, the sentiment of gold cashing out and leaving the market may be stimulated, resulting in gold There may be room for retracement in the short term. If gold falls below 3400 during the retracement, the decline may continue to the 3395-3385 area.
Therefore, for the next short-term trading, we can first wait for the opportunity for gold to pull back, and then consider going long on gold with the 3415-3405 area as support; if gold does not give a chance to pull back, then when gold first touches the area around 3440-3450, we can consider starting to short gold.
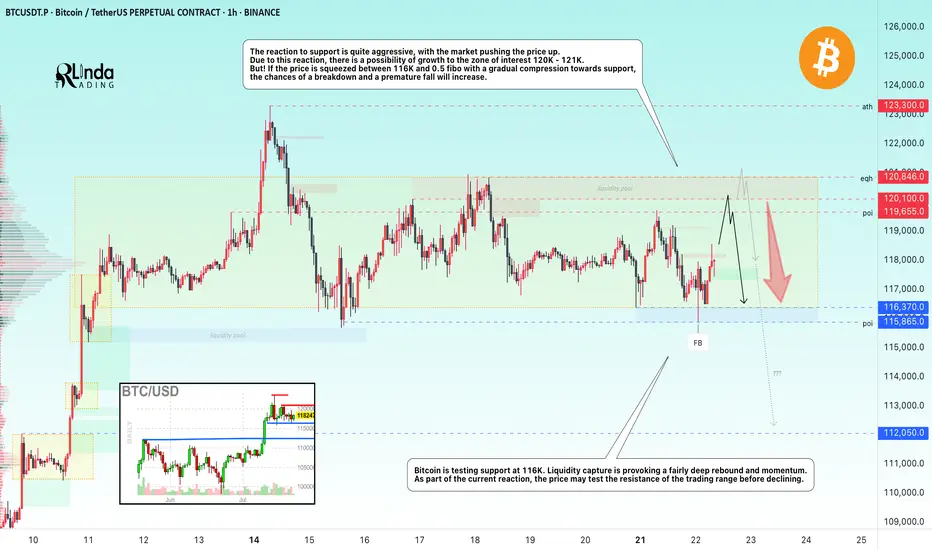
BITCOIN → Consolidation and compression to 116K. Correction?BINANCE:BTCUSDT.P continues to consolidate, with the price testing support at 116K, leaving behind the zone of interest at 120K-121K. Are there any chances for further growth?
(Alternative scenario (if growth to 120K does not occur))
Fundamentally, there is nothing particularly new, and the hype surrounding Bitcoin is stagnating. Technically, on D1, consolidation is underway with pressure from bears against the backdrop of an outflow of funds into altcoins. However, the dominance index is starting to rise, which could trigger some correction in the market. The price on the working timeframe, without updating local highs, is testing lows, and the latest retest of the liquidity zone is provoking a fairly aggressive reaction that could bring the price to retest the zone of interest at 120K-121K.
But! If the price is squeezed between 116K and 0.5 Fib with a gradual squeeze towards support, the chances of a breakdown and a premature fall will increase.
Support levels: 116370, 115860
Resistance levels: 119650, 120100
Technically, the market needs a breather or correction, which is generally a sign of health. The nuance with Bitcoin is that below 115860 there is no support until 112K, and if the market breaks the current consolidation boundary, the further correction could be quite deep. In the current situation, I do not yet see any drivers or reasons for another rally.
Best regards, R. Linda!