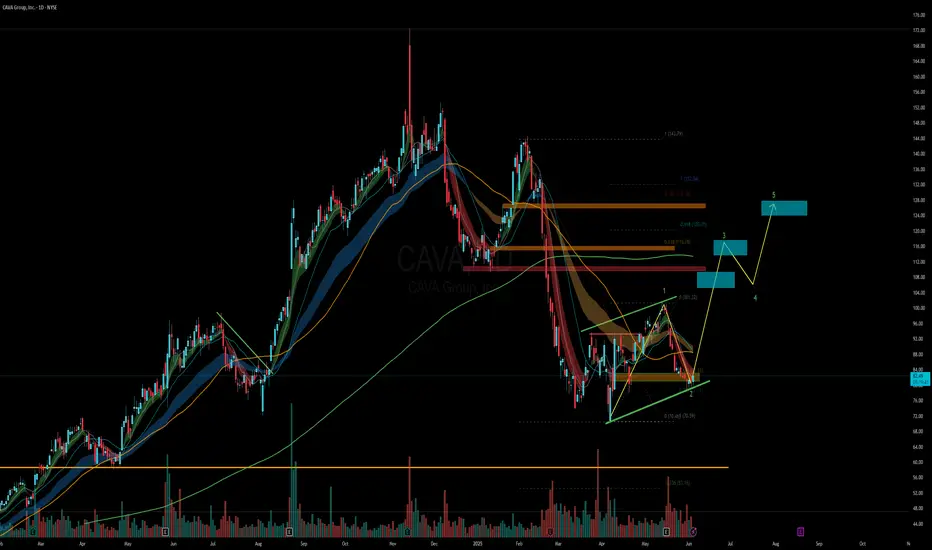
CAVA - Setting up good for a runCAVA looks good here, ambiguously looking like a bear flag though.
But if it holds these levels can see a good run upto 100+
Target 1 - 100
Target 2 - 110
Target 3 - 130
Trend Lines
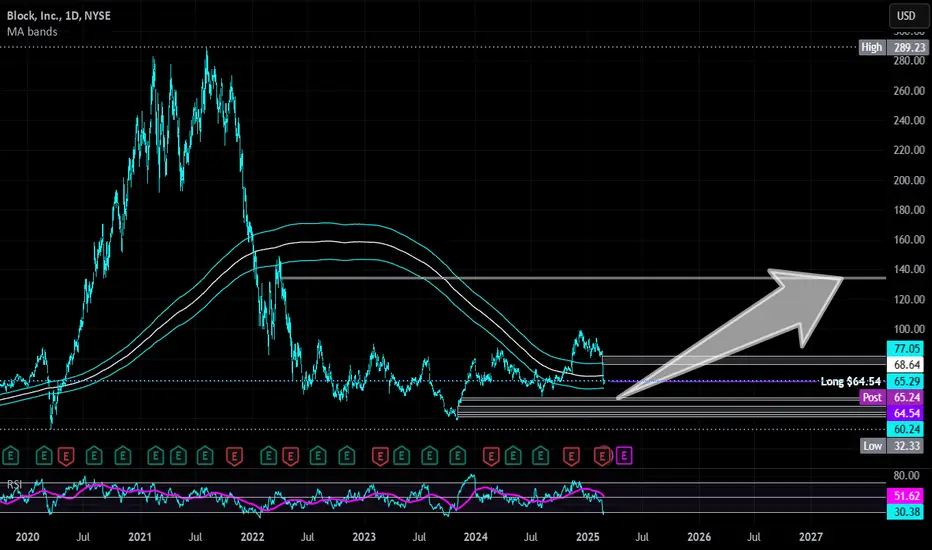
Block | XYZ | Long at $64.84Block's NYSE:XYZ revenue is anticipated to grow from $24 billion in FY2024 to $32 billion in FY2027. With a current price-to-earnings ratio of 13.8x, debt-to-equity ratio of 0.36x, and rising cash flow in the billions, it's a decent value stock at its current price. Understandably, there is some hesitation among investors due to competitive fintech market and economic headwinds. But, like PayPal NASDAQ:PYPL , growth is building.
From a technical analysis perspective, the price dropped to within my historical simple moving average bands. Often, but not always, this signals a momentum change and the historical simple moving average lines indicate an upward change may be ahead. While the open price gaps on the daily chart in the $40s and GETTEX:50S may be closed before a true move up occurs, NYSE:XYZ is in a personal buy zone at $64.84.
Targets:
$80.00
$90.00
$100.00
[*) $134.00 (very long-term)
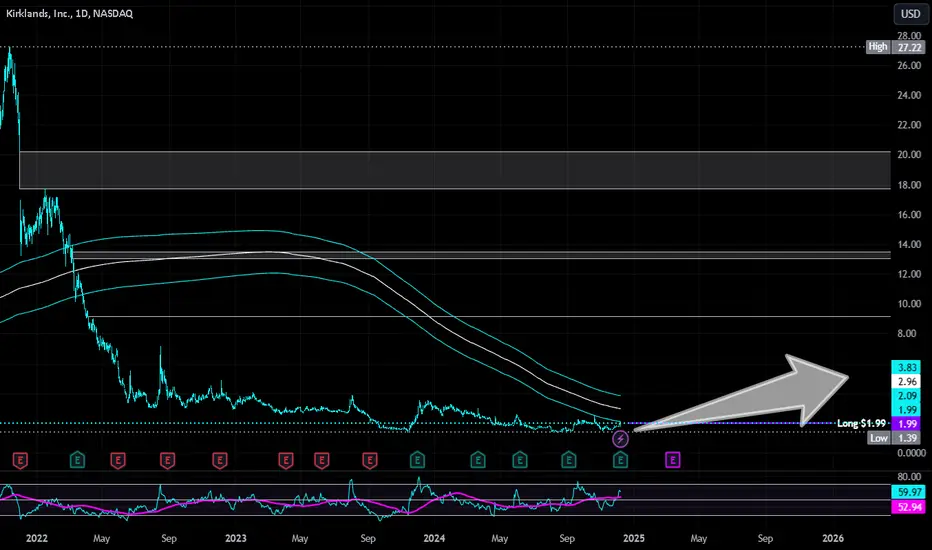
Kirklands | KIRK | Long at $1.99Kirklands $NASDAQ:KIRK. A strong move may be brewing... The historical simple moving average (SMA) is flirting with the price and has yet to break the barrier - which often results in a sharp price increase. The downward trend is finally starting to reverse based on this measure, too. While it may not soar to crazy highs like in 2021, the chart setup is exactly what I like to see for an anticipated move up as it consolidates. A 12M float and 7% short interest could get the ball rolling if/when the price breaks into the historical SMA.
Fundamentally, NASDAQ:KIRK is a small-cap with $114 million in sales. It recently partnered with NYSE:BYON as an exclusive licensee of Bed Bath & Beyond neighborhood stores, positioning the company as a multi-brand retailer. The first Bed Bath & Beyond neighborhood store is planned for a 2025 opening. Could this be the force for a future price move? Time will tell.
At $1.99, NASDAQ:KIRK is in a personal buy zone.
Target #1 = $2.50
Target #2 = $2.75
Target #3 = $3.00
Target #4 = $4.00
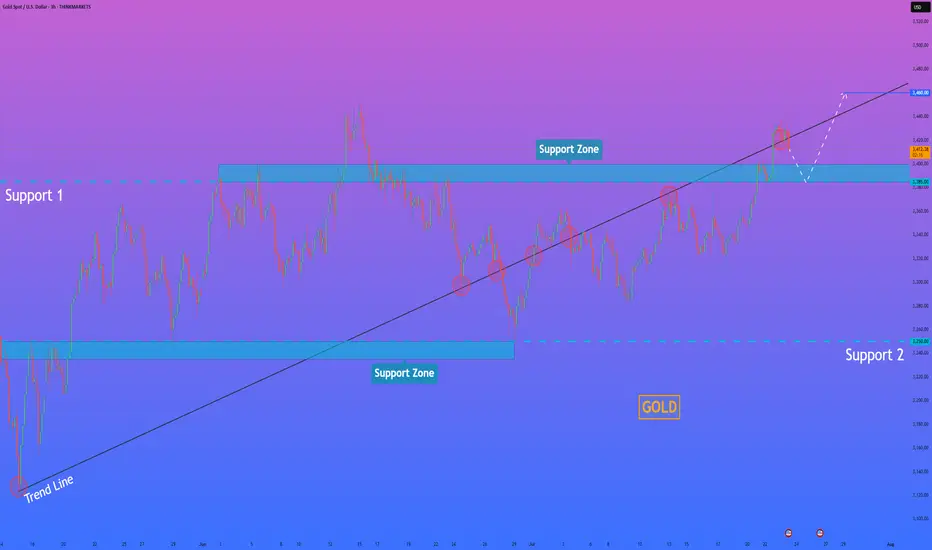
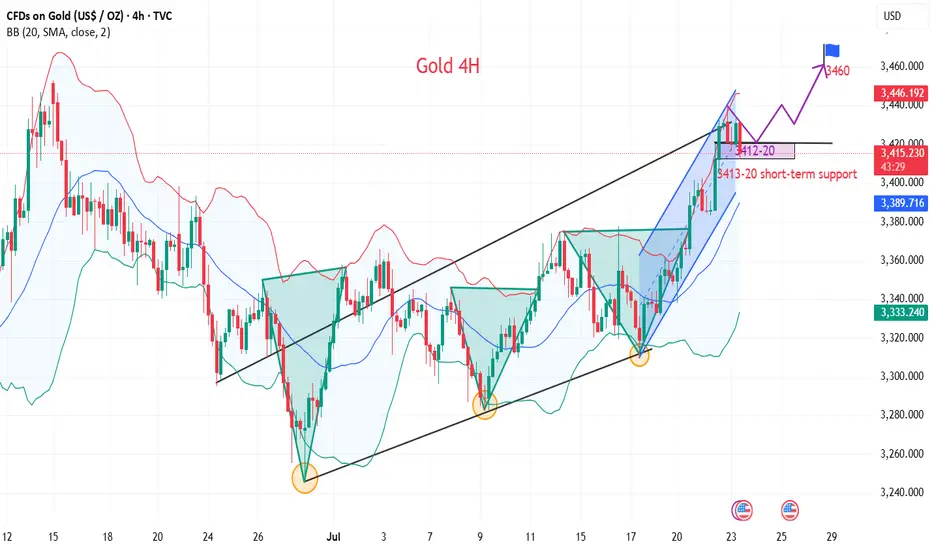
HelenP I. Gold, after small correction, can continue to move upHi folks today I'm prepared for you Gold analytics. If we look at the chart, the dominant feature is a strong, sustained bullish trend defined by a major ascending trend line that has repeatedly served as a reliable foundation for the price, confirming that buyers currently maintain firm control. At present, the price action is consolidating above a crucial horizontal pivot area, the support zone between 3385 and 3400. The significance of this zone is high, as it's a classic polarity point where previous resistance has flipped to become support, suggesting a concentration of buying interest. My core analysis hinges on the scenario of a brief, healthy corrective move down to retest this support zone. I believe this retest is a key market dynamic to confirm buyers' commitment. If the price dips into the 3385-3400 area and is met with a decisive rejection of lower prices, it would provide a powerful signal that the underlying bullish sentiment remains fully intact. A successful defense of this zone would be the primary trigger, creating the momentum for the next upward leg. Therefore, I have set the primary goal for this move at the 3460 level. If you like my analytics you may support me with your like/comment.❤️
Disclaimer: As part of ThinkMarkets’ Influencer Program, I am sponsored to share and publish their charts in my analysis.
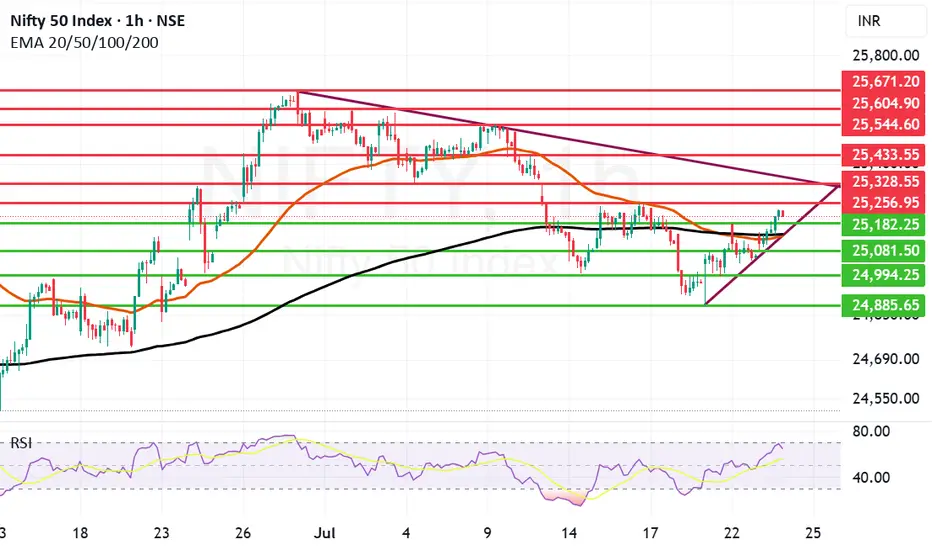
Strong Comeback by Nifty few Resistances ahead.Nifty made a remarkable comeback today ending 159 points up closing at 25219. Infosys has posted better than expected result and as of now the Infosys ADR is up by 1.26%. So if there is a turnaround in the IT sector we can see Nifty fly upwards.
The next resistance ahead of Nifty is at 25256 if we get a closing above this the next will be at 25328. These 2 will be critical resistances to cross. Once we get a closing above 25328 Nifty can target 25433 and 25544. Above 25544 Nifty becomes very strong. In case Nifty is not able to cross 25256 or 25328 levels the supports for Nifty are at 25182. After this zone there is a dual support of Mother and Father line of Hourly chart at 25136 and 25142.
These are very strong supports. (Thus the zone between 25182 to 25136 is full of supports). We hope that these supports are held. In case we get a closing below 25136 Nifty will again fall into bearish territory and can plunge towards 25081, 24994 or even 24885.
The shadow of the candles right now is positive but 2 very important resistances mentioned earlier are yet to crossed so game is in balance but only slightly in favour of Bulls.
Disclaimer: The above information is provided for educational purpose, analysis and paper trading only. Please don't treat this as a buy or sell recommendation for the stock or index. The Techno-Funda analysis is based on data that is more than 3 months old. Supports and Resistances are determined by historic past peaks and Valley in the chart. Many other indicators and patterns like EMA, RSI, MACD, Volumes, Fibonacci, parallel channel etc. use historic data which is 3 months or older cyclical points. There is no guarantee they will work in future as markets are highly volatile and swings in prices are also due to macro and micro factors based on actions taken by the company as well as region and global events. Equity investment is subject to risks. I or my clients or family members might have positions in the stocks that we mention in our educational posts. We will not be responsible for any Profit or loss that may occur due to any financial decision taken based on any data provided in this message. Do consult your investment advisor before taking any financial decisions. Stop losses should be an important part of any investment in equity.
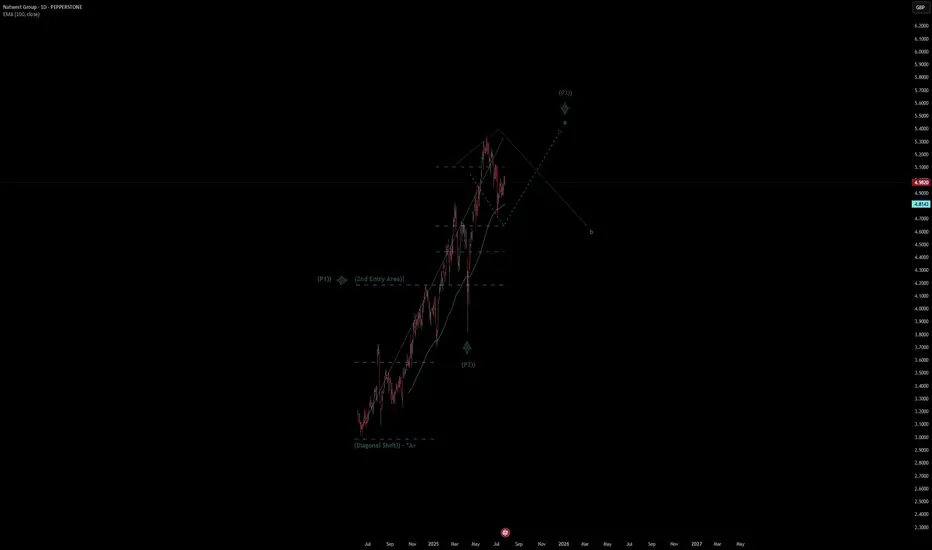
Natwest Group Quote | Chart & Forecast SummaryKey Indicators On Trade Set Up In General
1. Push Set Up
2. Range Set Up
3. Break & Retest Set Up
Notes On Session
# Natwest Group Quote
- Double Formation
* (Diagonal Shift)) - *A+ | Completed Survey
* (2nd Entry Area)) | Subdivision 1
- Triple Formation
* (P1)) / (P2)) & (P3)) | Subdivision 2
* (TP1) = a / Long Consecutive Range
* (TP2) = b / Short Consecutive Pullback | Subdivision 3
* Daily Time Frame | Trend Settings Condition
- (Hypothesis On Entry Bias)) | Indexed To 100
- Position On A 1.5RR
* Stop Loss At 150.00 GBP
* Entry At 156.00 GBP
* Take Profit At 167.00 GBP
* (Uptrend Argument)) & No Pattern Confirmation
- Continuation Pattern | Not Valid
- Reversal Pattern | Not Valid
* Ongoing Entry & (Neutral Area))
Active Sessions On Relevant Range & Elemented Probabilities;
European-Session(Upwards) - East Coast-Session(Downwards) - Asian-Session(Ranging)
Conclusion | Trade Plan Execution & Risk Management On Demand;
Overall Consensus | Buy
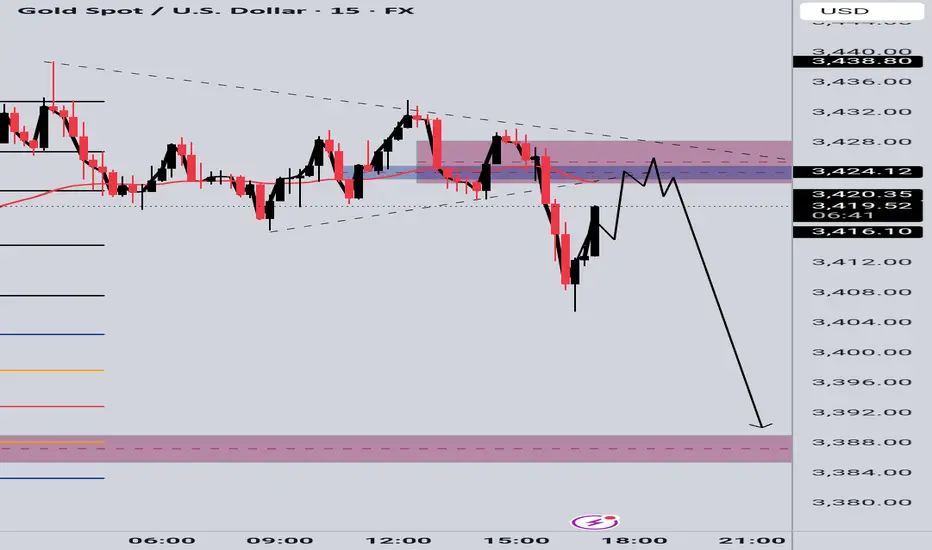
GOLD SELL SETUPWe failed the bullish momentum on previous chart ,now aiming for the continuation to the downside;
🔹 Entry Zone: 3425–3430 (Supply Rejection)
🔸 Trendline Break + Liquidity Sweep Confirmed
🎯 Targets:
— TP1: 3410
— TP2: 3388 (Major Demand Zone)
🔒 Bearish momentum building, watching for continuation toward the lower zone.
The real target of gold is more than 3400
💡Message Strategy
The United States has recently made frequent moves in global tariff policies. Treasury Secretary Bensont has clearly set August 1 as a hard deadline for tariff negotiations among countries. At present, EU trade negotiations have been decoupled from the issue of sanctions against Russia and Ukraine, while Japan's negotiations are progressing smoothly.
These dynamics reflect that the United States is reshaping the global trade pattern through differentiated strategies, and countries are forced to adjust their economic and trade policies under the pressure of tariffs. As the deadline approaches, gold is facing a test of long and short positions.
The White House's pressure on the Federal Reserve is still fermenting. The US Treasury Secretary said that the Federal Reserve should cut interest rates now, but at the same time said that there is no sign that Powell should resign now. If he wants to leave early, he should do so. Powell gave a public speech yesterday, but to the disappointment of the market, he did not mention monetary policy and the possibility of resignation. However, Trump's pressure on the Federal Reserve has taken effect, and the market has turned its attention to interest rate cuts.
📊Technical aspects
Yesterday, Tuesday, we believed that the trade negotiations between Europe and the United States were on the verge of breaking down, which led to a rise in risk aversion in the market, boosted gold safe-haven buying, and supported the price of gold to a one-month high.
Therefore, we suggest that you take a bullish approach in terms of operation. Pay attention to the support below at $3,380, and pay attention to the breakthrough of $3,402 above. As expected, it broke through to $3,440, reaching our expected profit target.
From the 4H trend structure, gold has been climbing rapidly along the upward channel recently. It broke through yesterday and took the 3400 mark in one fell swoop, reaching our expected target of 3440. At present, gold is blocked and falls back on the channel boundary support.
At the same time, the 1-hour RSI broke through the upward trend line support and tested the resistance again, releasing a callback signal in the short term. It is necessary to pay attention to the possibility of short-term adjustments. Today, we can focus on the key resistance around 3415 and try long opportunities.
💰Strategy Package
Long Position:3410-3420,SL:3390,Target: 3440,3460
Gold breaks new high, expect a pullback in the evening#XAUUSD
After the rapid rise of the previous day, the gold market has fallen into an overbought state, but yesterday's increase of nearly $60 still provided solid support for the bulls. It is expected that the market will show repeated fluctuations in the future⚖️.
In terms of operation, it is recommended to pay close attention to the gains and losses of the 3,400 mark. If it is successfully broken through, it is expected to further test the 3,420-3,425 and 3,450 lines; on the downside, pay attention to the top and bottom conversion support of 3,403📈.
📊At present, you can consider shorting near 3430, defending 3440, and aiming at 3410💡
🚀SELL 3430-3440
🚀TP 3415-3405
Gold is often bullish and bearish, with a focus on the 3411 wate
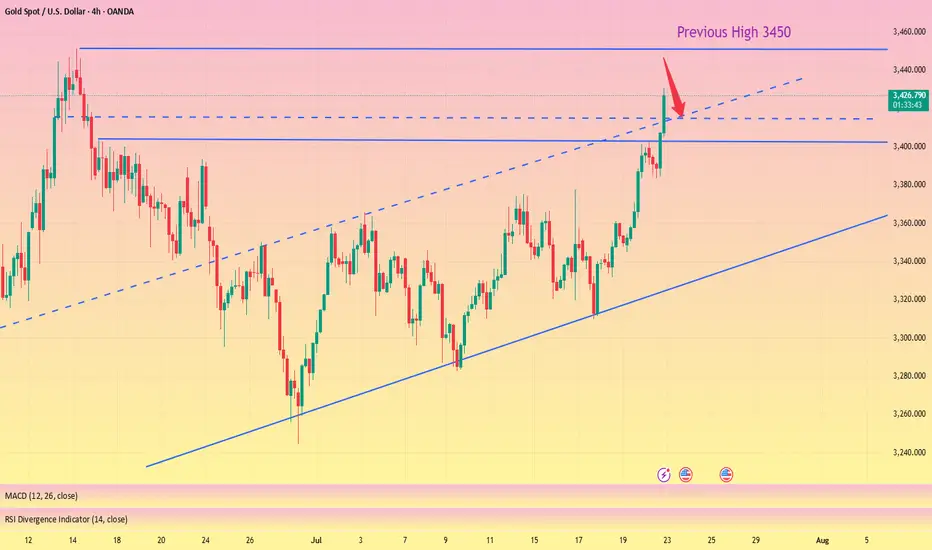
Gold prices hit a five-week high of $3,439 an ounce on Wednesday before turning lower on profit-taking and a rebound in the dollar. However, from a technical perspective, the path of least resistance for gold prices still appears to be to the upside. Looking ahead, trade and political developments will continue to play a key role in gold price movements, while traders will also be keeping a close eye on the feud between Trump and Fed Chairman Powell.
Why did gold return to $3,400? Reasons explained!
1 As investors continue to focus on U.S. President Trump's August 1 tariff deadline, trade uncertainty and weaker U.S. Treasury yields have pushed gold prices to a five-week high. At the same time, trade uncertainty is also triggering some safe-haven demand.
2 Meanwhile, investors are also preparing for the Fed meeting next week. Although the Fed is expected to keep interest rates unchanged, the market expects that the Fed may cut interest rates in October. Gold is traditionally seen as a hedge in uncertain times and tends to perform well in a low-interest rate environment.
What do you think of today's gold trend!
Today, gold rose to 3439 and then continued to fluctuate sideways. At present, gold has been fluctuating and weakening near 3420. Relatively speaking, the trend is still strong, but the trend has not continued to break through the high point. In this trend, it is actually unwise to chase the rise. At present, we still have to wait for the market sentiment to be fully mobilized before continuing to operate!
The hourly line is still the view of the previous post. Near 3411 is the key position for the second bullish today. Unfortunately, the fluctuation has been fluctuating around 15 points today, and the amplitude of the fluctuation has slowed down. It is still necessary to wait quietly. After all, under the current situation of large repetitiveness, it is not easy to enter the market at a good point and there is a high probability that there will be no good profit margin. If there are other changes later, I will give them in real-time guidance!
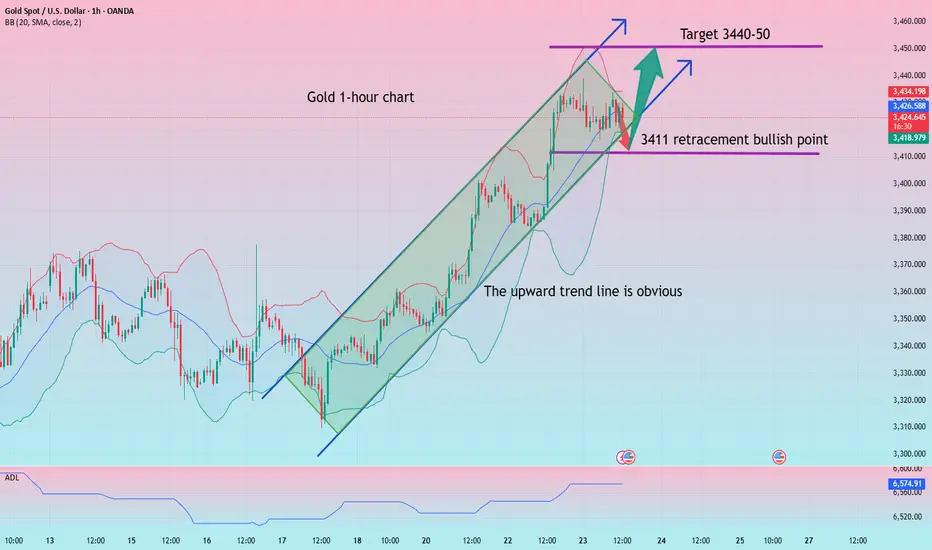
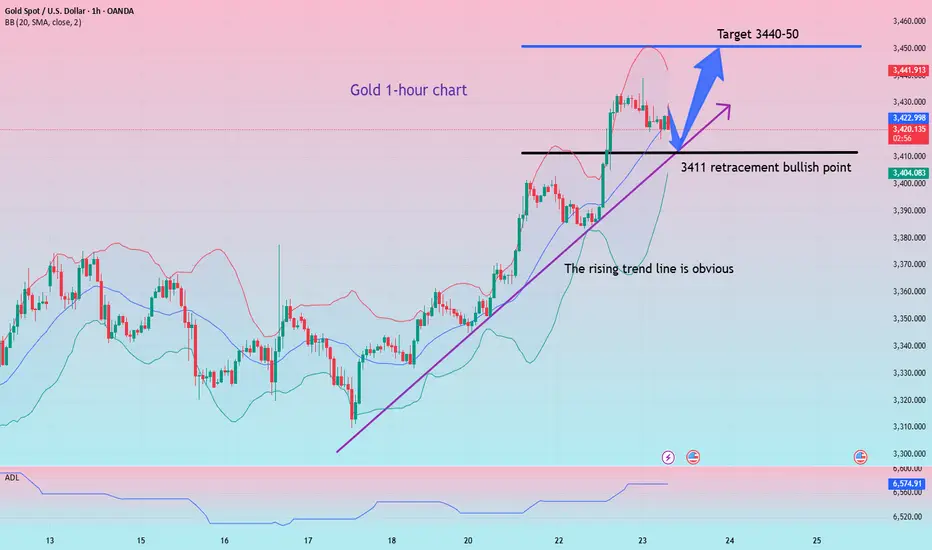
Gold: More near 3411, defend below 3403, and the target is 3440-50!
GOLD | Bullish Bias Amid Fed & Trade Policy UncertaintyGOLD | Bullish Bias Amid Fed & Trade Policy Uncertainty
Gold prices edge higher as markets weigh conflicting signals from the Federal Reserve and renewed trade policy uncertainty. Diverging opinions among Fed officials regarding the inflationary impact of President Trump's proposed tariffs have fueled demand for safe-haven assets.
While some members like Waller and Bowman appear open to rate cuts, others remain cautious about lingering inflation risks, adding to market volatility.
Technical Outlook:
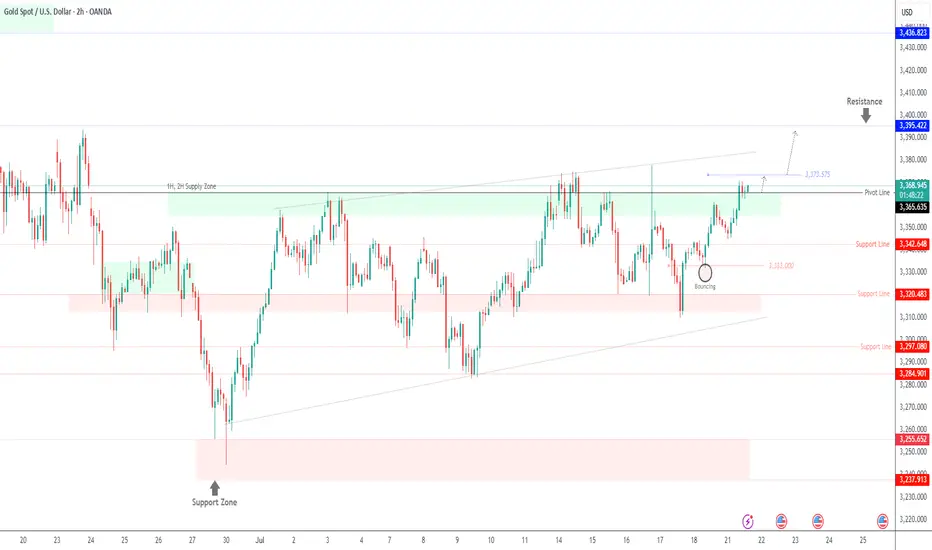
Gold maintains bullish momentum above 3365. A break and hold above this pivot supports continuation toward 3375, and if momentum builds, toward 3385 and 3395.
However, any sustained move below 3365 may trigger a bearish correction toward the support zone between 3355 and 3342.
Pivot Line: 3365
Resistance Levels: 3375 · 3385 · 3395
Support Levels: 3355 · 3342
Bias: Bullish above 3365
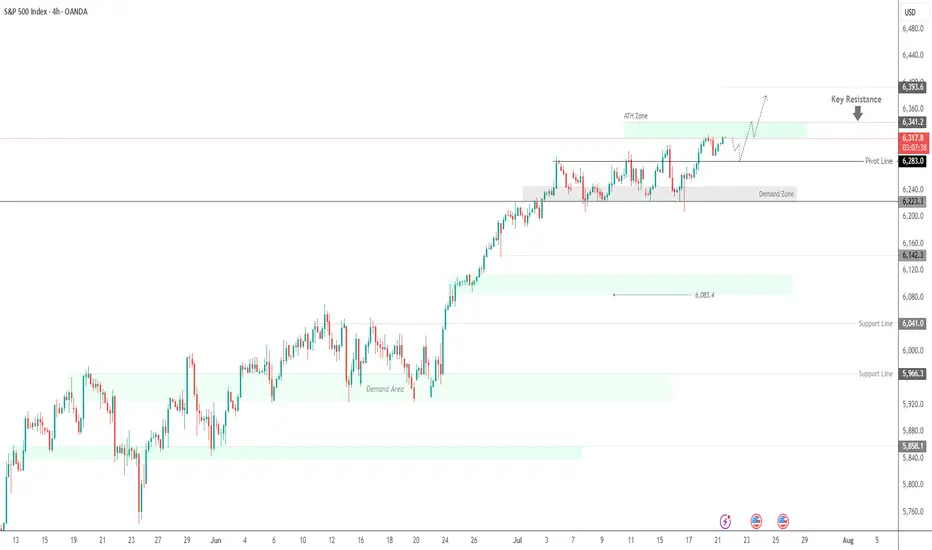
SPX500 Near ATH | Earnings Week Could Fuel Next MoveSPX500 | Weekly Outlook
The S&P 500 continues its bullish run, trading at record highs as investors await a critical week of tech earnings. Reports from Alphabet and Tesla could be key in justifying the lofty valuations driven by the AI boom.
Technical Outlook:
The price is expected to consolidate between 6341 and 6283 before any decisive move. A short-term bearish correction may occur initially, but if the price holds above the support zone, a push toward a new ATH at 6341 is likely. A breakout above this level could extend gains toward 6375 and 6393.
However, a break below 6283 would indicate weakness, potentially driving the price toward the demand zone near 6250 and 6224.
Support: 6283 · 6250 · 6224
Resistance: 6341 · 6375 · 6393
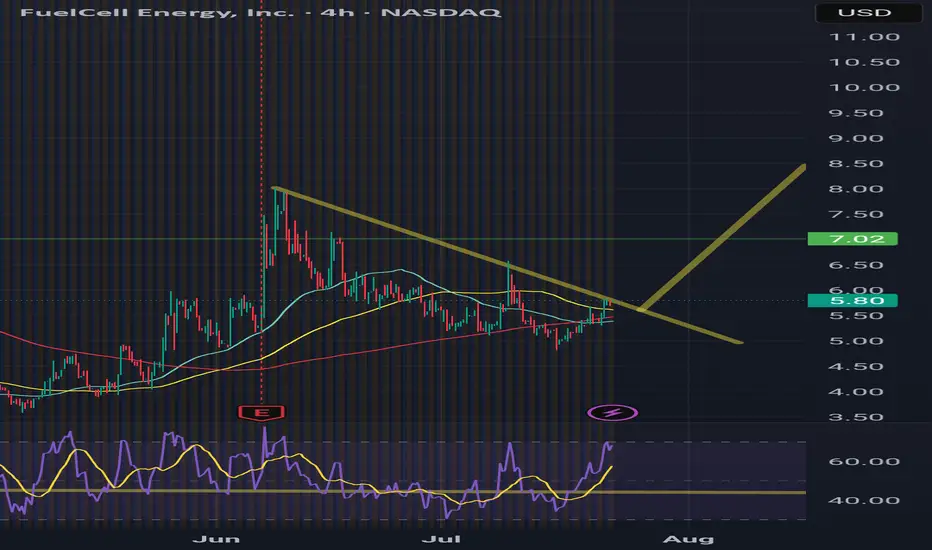
KOREAN AIDaily weekly both look great, need to break this trend and get 7$ maybe a break out and retest of trend line to cool off the 4hr rsi or a plan ol rejection but the way small names are getting sent right makes me believe this is a decent possibility. Holding shares and a few 5 and 10 calls.
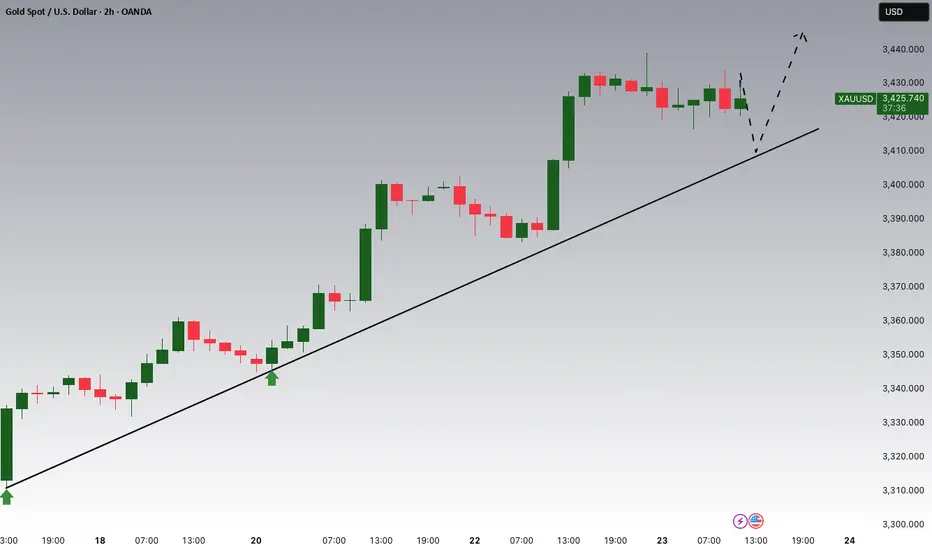
Gold is Targeting Fresh HighsHey Traders, in today's trading session we are monitoring Gold for a buying opportunity around 3,410 zone, Gold is trading in an uptrend and currently is in a correction phase in which it is approaching the trend at 3,410 support and resistance area.
Trade safe, Joe.
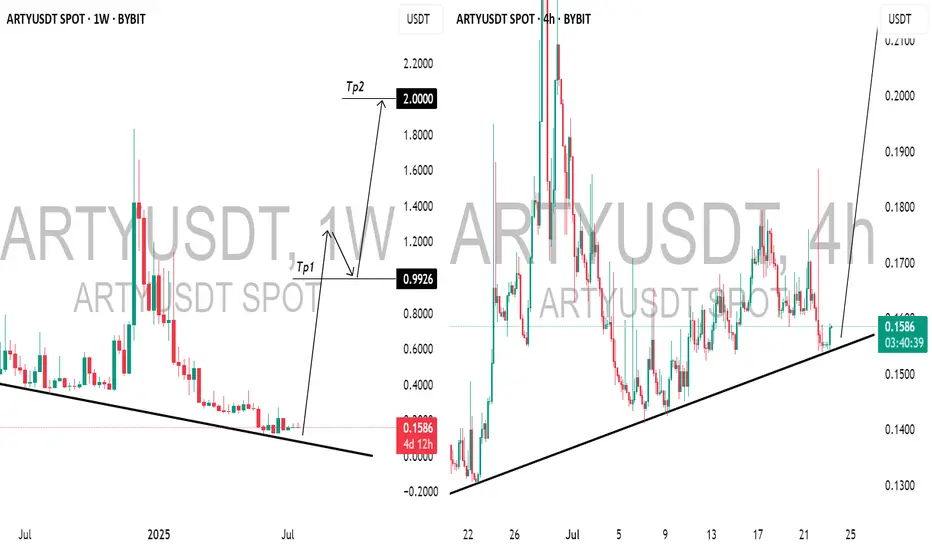
ARTFACT (ARTYUSDT): Bullish Outlook ExplainedThis morning, while analyzing 📈ARTY on a weekly chart, I noticed a promising bullish signal following a test of a falling trend line.
The price has been adhering well to a rising trend line on the 4-hour chart, and after a recent test, we observed a positive bullish reaction, prompting me to enter a long position.
Recently, early investors took profits from three years of staking, alleviating sell pressure. Additionally, Artyfact has introduced its first Play-and-Earn mode, which is expected to attract hundreds of thousands of new players.
This surge in interest will likely increase the demand for AMEX:ARTY and drive up its price, as players can only purchase gaming NFTs using $ARTY.
I believe the price has good potential to rise to 1.00 then to 2.00 soonest.
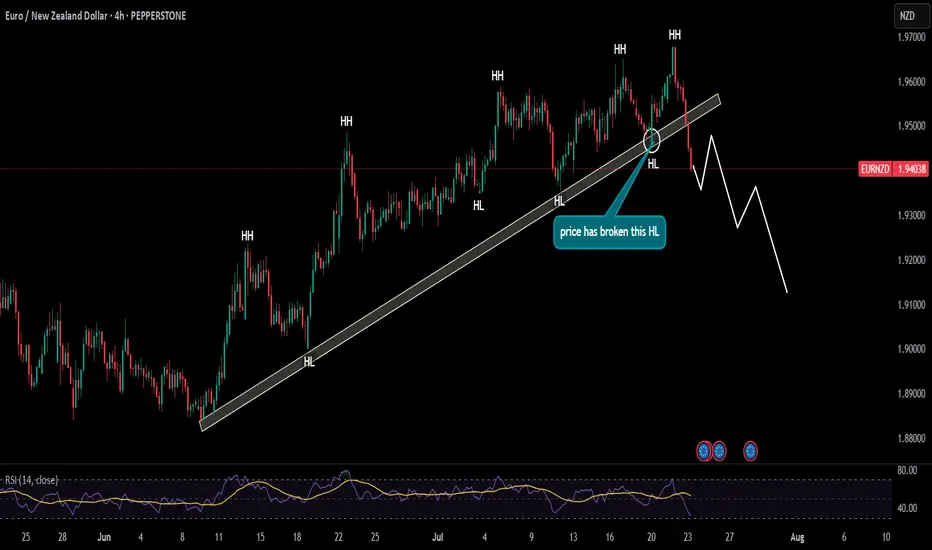
EURNZD giving early signs of reversal of trend!!!as it can be seen that price has broken the bullish trendline with strong momentum, and along with that, it has also broken its last HL these confluences indicate a trend reversal from bullish to reversal. For more confirmation of bearish trend let the price make pullback either to make its first LH and then look for sell setups
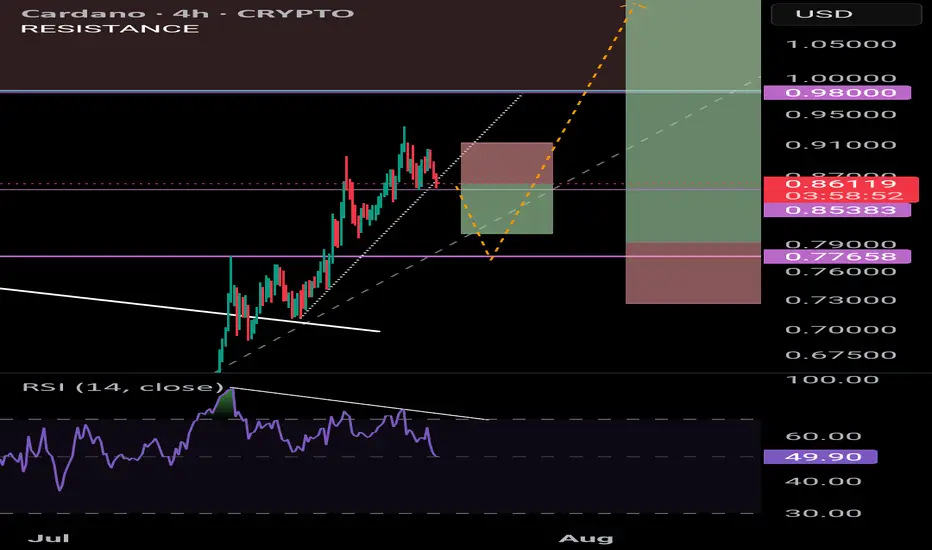
ADA - pull back then blast offIf ADA breaks below 0.85 I believe the next level of support will be @ 0.78 - this price level acted as resistance and was the Weekly high on 3 x occassions. Thus it is assumed that resistance will flip into support.
Bearish div. Suggests a move down as well as a break in the uptrend.
Entry @ 0.79
TP 1: 1.13
TP2: 1.43
TP3: 2.00
You could take a small short position now and profit in the event that price does start to retrace to 0.78 (ish)
Gold safe-haven retreat? It will continue to rise!
Why did gold return to 3,400? Reasons explained!
1 As investors continue to focus on US President Trump's August 1 tariff deadline, trade uncertainty and weaker US Treasury yields have pushed gold prices to a five-week high. At the same time, trade uncertainty is also triggering some safe-haven demand.
2 At the same time, investors are also preparing for the Federal Reserve meeting next week. Although the Fed is expected to keep interest rates unchanged, the market expects that the Fed may cut interest rates in October. Gold is traditionally seen as a hedge tool in uncertain times and tends to perform well in a low-interest rate environment.
Views on today's gold trend!
After two consecutive days of rising this week, the sentiment of gold bulls has basically been ignited. There has been basically no obvious retracement in the past few days. Either it is a slow rise in a row, or it is a direct acceleration of the rise after sideways fluctuations. After the first wave of highs at the opening today, the market is still at a rising node!
The watershed of the retracement on the hourly chart is still the break point of 3403, but it is too far from our current position to enter the market at this position. In addition, the current continuous rise of gold and the turning of the moving average have made the market bulls more aggressive, which means that the previous short-term downward trend has ended. The point of today's retracement layout can focus on the vicinity of 3412!
Gold: Long near 3411, defend below 3403, and target 3440-50!
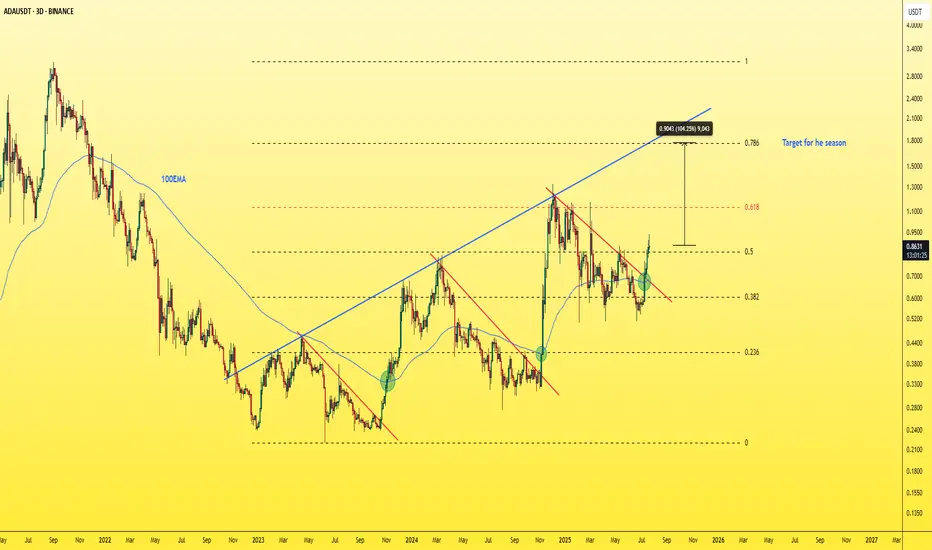
ADAUSDT - Buy or Regret!As clear and simple as the chart is… the target is just as clear and reliable.
ADA is showing strong bullish structure on the 3-day chart — breaking above the red trendline with a successful retest, and also breaking above the 100 EMA.
The blue trendline represents a strong hidden resistance level that many traders are overlooking.
The upside move is likely to end around the 0.786 Fibonacci level, which intersects with this blue trendline — in the $1.50–$1.70 range.
A strong project. A fundamentally sound coin that respects technical analysis.
A logical and high-probability target.
Best regards Ceciliones🎯
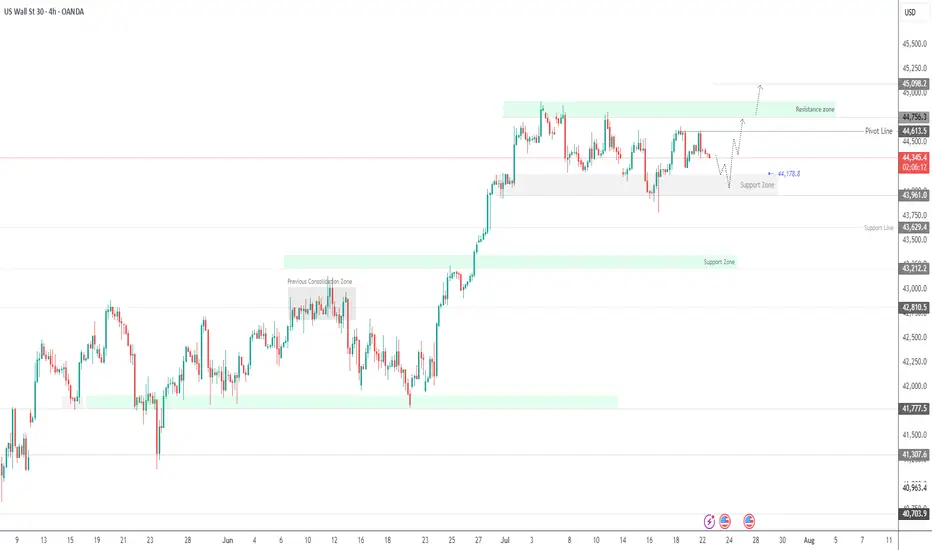
Dow Set for Volatile Move as Earnings, Tariff Risks CollideUS30 OVERVIEW
The price is currently consolidating between 44,180 and 44,620, awaiting a catalyst. Today’s earnings reports are expected to heavily influence Dow Jones price action.
If earnings come in strong, the index is likely to push toward 44,620 and 44,760. A confirmed stability above 44,620 would strengthen the bullish case, potentially opening the path toward a new all-time high near 45,100.
However, a break below 44,180 would signal bearish momentum, with potential downside toward 43,960. Additional pressure could come from escalating tariff tensions, further weakening sentiment.
Resistance: 44,620 · 44,760 · 45,100
Support: 44,180 · 43,960 · 43,630
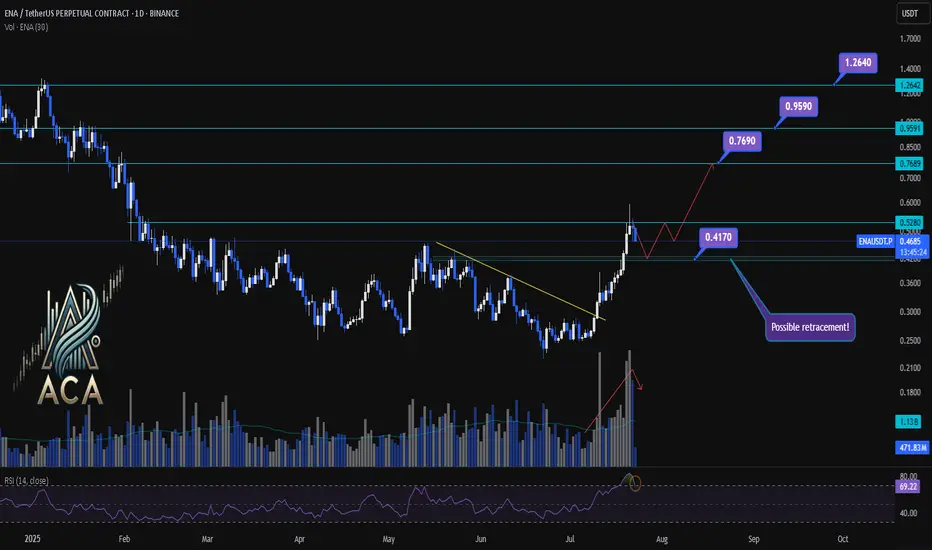
ENA/USDT Chart Analysis | Volatility Signals & Bullish TriggersENA/USDT Chart Analysis | Volatility Signals & Bullish Triggers
🔍 Let’s dive into the ENA/USDT perpetual contract and analyze recent price action, focusing on momentum shifts and key breakout scenarios.
⏳ Daily Overview
The daily chart shows that ENA recently reentered the overbought zone on the RSI, which can serve as a potential trigger for traders watching momentum shifts. Earlier, price action broke decisively above a long-standing descending trendline, resulting in a rapid, nearly 100% surge, a classic RR2 move off the trendline. This breakout coincided with a visible uptick in trading volume, confirming strong demand behind the move.
Now, during the ensuing rest or correction phase, trading volume is decreasing—often a constructive sign suggesting either profit-taking or a healthy pullback rather than panic selling.
🔺 Bullish Trigger & Setup:
- RSI Signal: Reentry into the RSI overbought zone is a potential long trigger, especially if confirmed by price action.
- Confirmation Level: A daily close with strong volume above $0.528 would add conviction to a bullish setup.
- Trendline Reference: The break above the recent trendline fueled the rapid advance, showing the importance of watching such key resistance levels.
📊 Key Targets (on further bullish confirmation):
- $0.769 — First upside resistance.
- $0.959 — Next bullish target.
- $1.264 — Extension target if momentum continues and broader market sentiment remains supportive.
🚨 Conclusion:
Eyes are on the $0.528 level—closing above it with volume, especially while RSI holds in the overbought zone, could provide the next strong entry signal. Current declining volume during pullbacks suggests this is likely a profit-taking phase or standard correction, not bearish capitulation. Keep monitoring RSI, volume profile, and price closes for the next actionable opportunity.
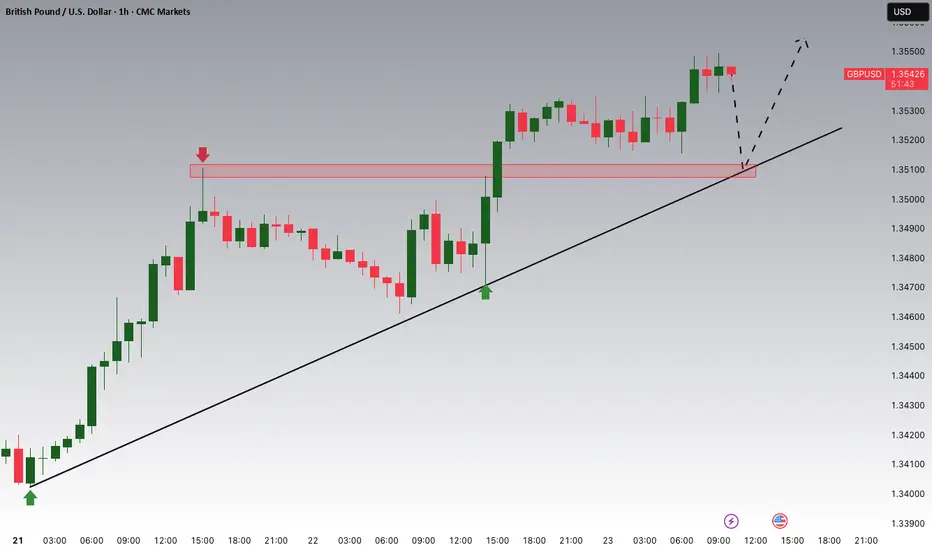
GBPUSD Potential UpsidesHey traders, in today's trading session we are monitoring GBPUSD for a buying opportunity around 1.35100 zone, GBPUSD is trading in an uptrend and currently is in a correction phase in which it is approaching the trend at 1.35100 support and resistance area.
Trade safe, Joe.
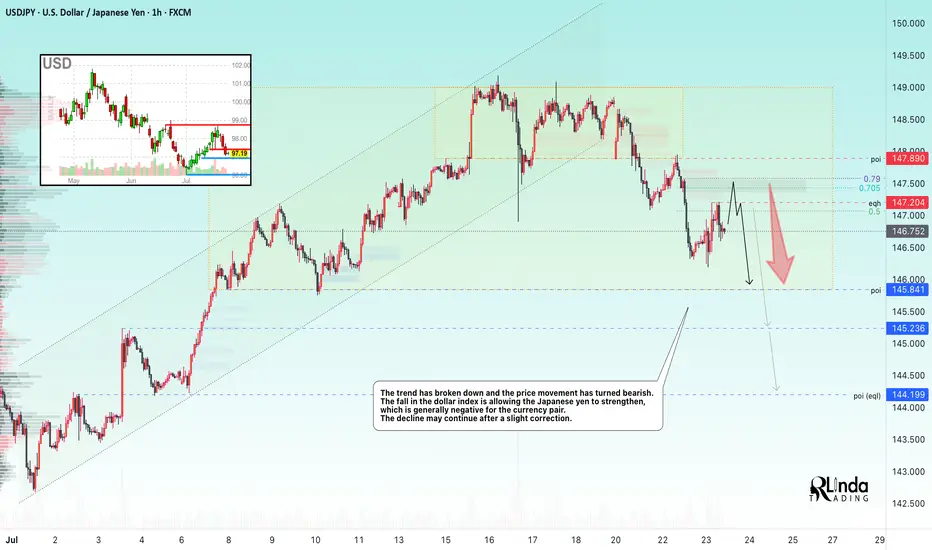
USDJPY → Hunting for liquidity before the fallFX:USDJPY is changing its local trend and succumbing to global pressure. The market is seeing a change in price movement following the decline in the dollar index...
The trend has broken and the price movement has turned bearish. The fall in the dollar index is allowing the Japanese yen to strengthen, which is generally negative for the currency pair. The decline may continue after a slight correction.
Fundamentally, the dollar is correcting amid uncertainty due to the tariff war, as well as expectations of interest rate cuts.
Resistance levels: 147.20, 147.89
Support levels: 145.85, 145.23
As part of the correction, the price may test the liquidity zone of 147.7 or 0.7f. A false breakout and consolidation of the price in the selling zone may trigger a further decline in both the short and medium term.
Best regards, R. Linda!