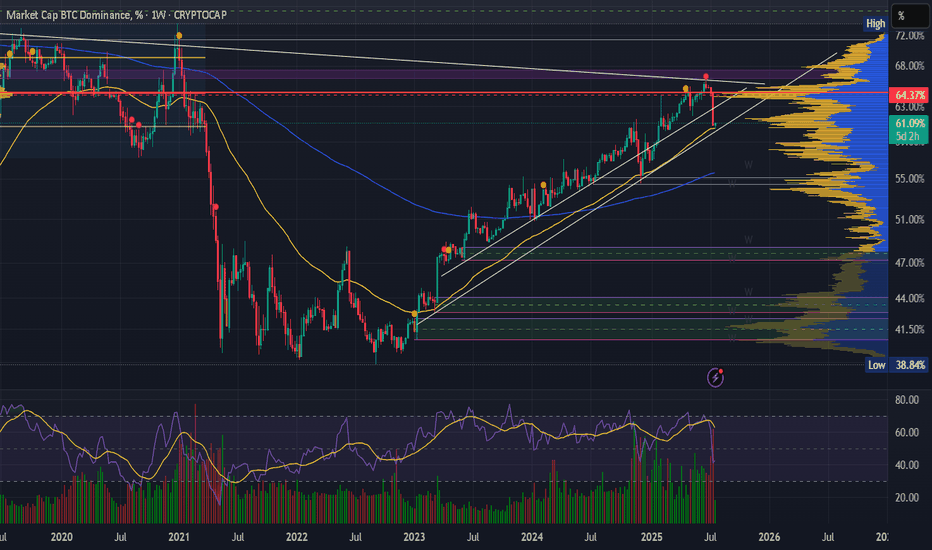
BTC.D Bitcoin Dominance on a bigger timeframe support?
This is my first time posting an idea, therefore not an expert, I hope the graphs show right.
Seeing a weekly chart, I see another support across the levels of March 6th, Dec 2nd and the current level. Could this have been only a warm up for the altseason? Do we have to wait for the week of August 25th?
CRYPTOCAP:BTC.D
If you check the Weekly chart for TOTAL3ESBTC, the week of August 25th could provide another support at 0.255.
The exact point we are hitting now is the POC for the beginning of 2019 up to today.
Trend Lines
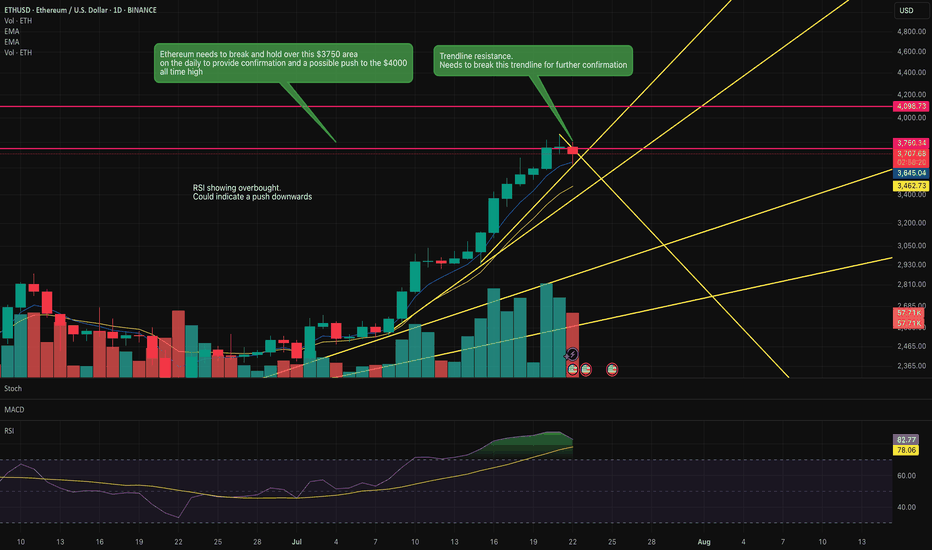
Is Ethereum going to push above this key resistance?Ethereum is knowcking against this key resistance area.
If it pushes above this $3750 area then it has a clear run to the previous all time highs of $4000.
RSI indicates overbought so it could indicate a reversal to the downside.
Key trendline is being honoured currently. However, a break of this trendline may indicate the move upwards to the previous all time high.
Watch this space over the next couple of days.
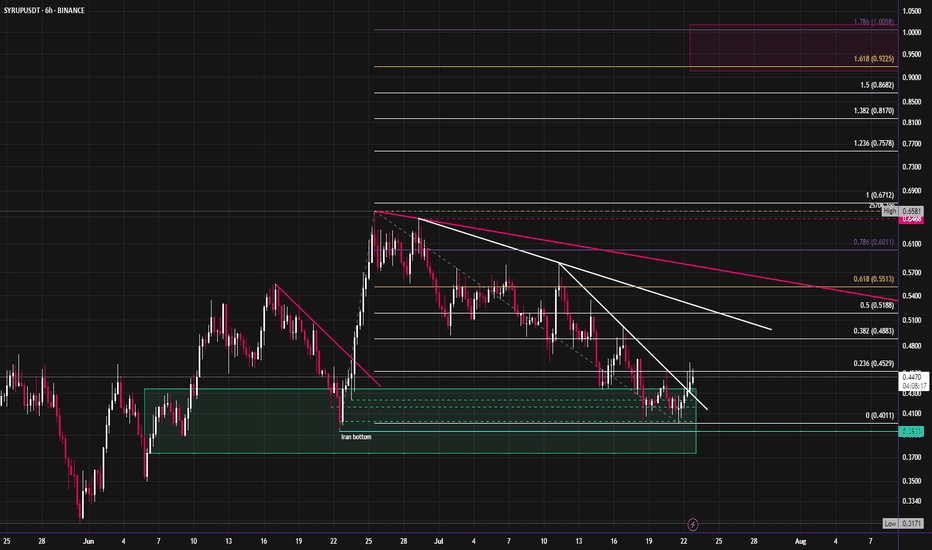
Syrup looks ready to start moving towards new ATH'sCRYPTOCAP:SYRUP has started to break out of its downtrend after revisiting the June lows. It has outperformed most of the market since April, with this month's pullback being an exception. I expect an aggressive move up into new highs. The fibs around $1 look like a good target for the short term, this would also be ~1b mc.
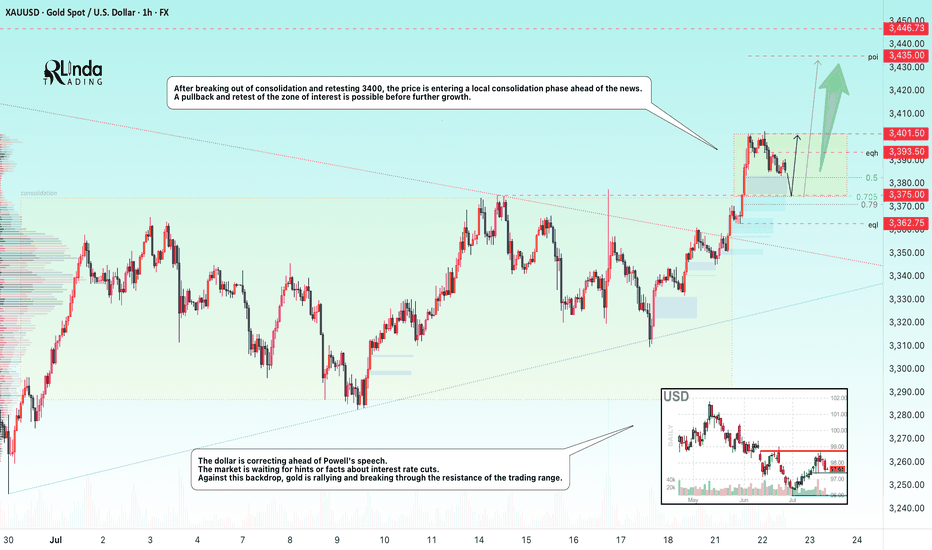
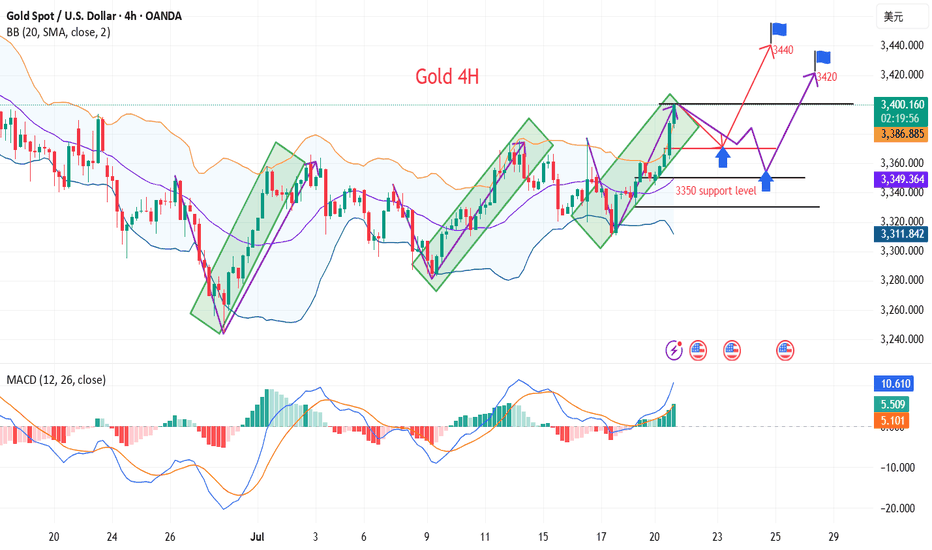
GOLD → Correction before continuing the rally to 3450FX:XAUUSD updates its local maximum to 3401.5 and enters a consolidation phase ahead of news. The dollar correction gives speculators a chance...
The price of gold is correcting from 3400. The reason is profit-taking ahead of Powell's speech at 12:30 GMT and waiting for clarity on US trade negotiations with the EU and Japan before August 1.
Gold remains sensitive to the progress of negotiations and the dynamics of the dollar, which is weakening amid political uncertainty, declining yields, and pressure on the Fed from Trump.
Technically, after exiting consolidation and retesting 3400, the price is entering a local consolidation phase.
Focus on key levels: 3401, 3382, 3375. A false breakdown of support could trigger a recovery phase.
Resistance levels: 3402, 3393
Support levels: 3382, 3375, 3362.75
The distribution phase has been halted by resistance, and the price has moved into a countertrend correction due to uncertainty. Markets are waiting for positive signals from the Fed. Local and global trends are bullish, which may support the price overall...
Best regards, R. Linda!
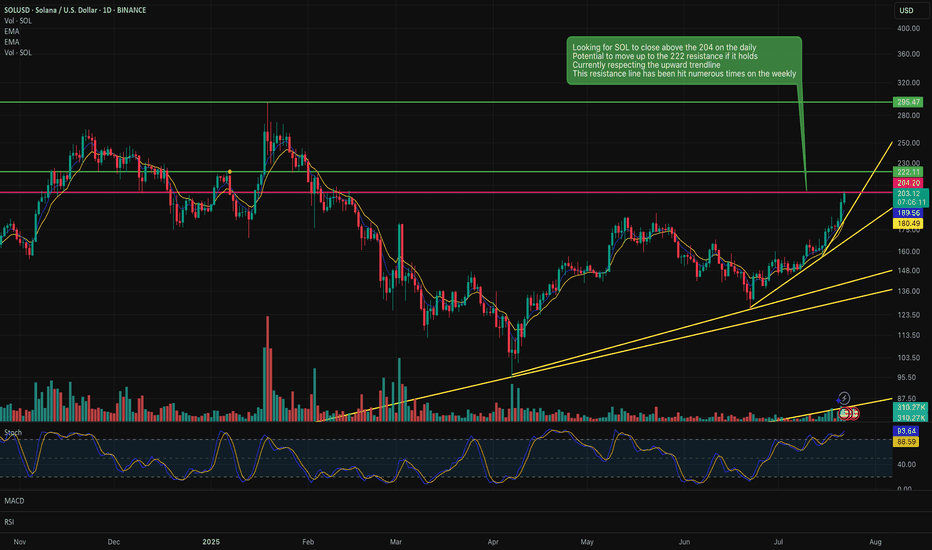
SOL holding above the 204 on the daily could be a long positionSOL is respecting the 204 on the daily and if it holds above it, we could have a long position buying opportunity.
Upside could be too the 222 resistance line if it holds above the 204.
Sentiment seems to be good for Sol and other strong alt coins at the moment. This also supports and upside trajectory.
Bulls are still the main theme, 3400 is not the high point📰 News information:
1. Fed Chairman Powell delivers a welcome speech at a regulatory conference
2. The tariff deadline is approaching
📈 Technical Analysis:
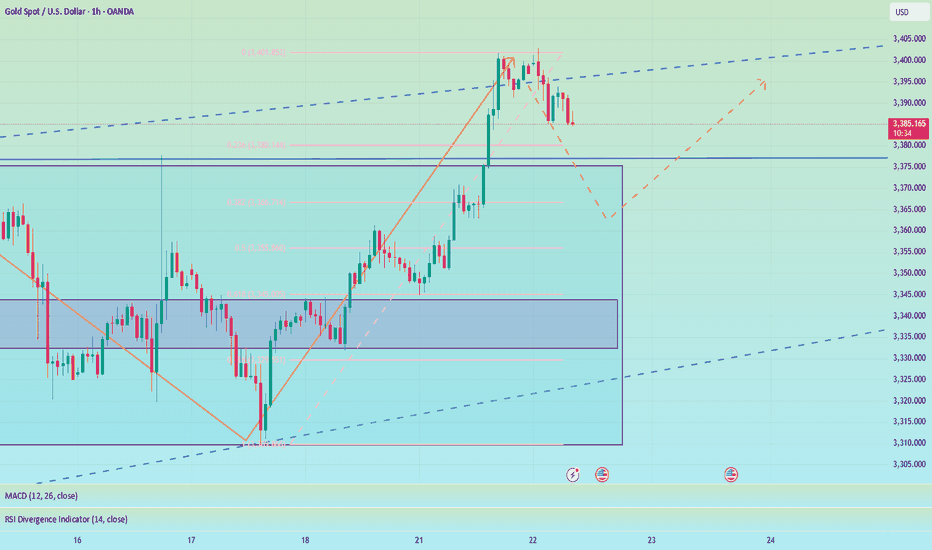
Today's opening high reached around 3402, and did not effectively break through the upper resistance of 3405-3415. As I said yesterday, a decline and return to the moving average is an inevitable result. The tariff issue is still there, with the deadline on August 1, and the daily MACD indicator still shows a golden cross. The general direction of short-term bullishness has not changed, but from a technical point of view, gold still has room to fall to correct the overbought part.
Below the day, we first focus on the top and bottom conversion position of 3377-3375. As time goes by, the 4H middle track will probably resonate with the 50% position of the Fibonacci line at 3355, which is also a good long position I expect. Therefore, if the price falls back to 3380-3375 for the first time during the day, you can consider going long. If the price continues to fall, pay attention to the second opportunity to go long at 3355, with the target at 3390-3410.
🎯 Trading Points:
BUY 3380-3375
TP 3390-3410
BUY 3360-3350
TP 3370-3380
In addition to investment, life also includes poetry, distant places, and Allen. Facing the market is actually facing yourself, correcting your shortcomings, facing your mistakes, and exercising strict self-discipline. I share free trading strategies and analysis ideas every day for reference by brothers. I hope my analysis can help you.
TVC:GOLD PEPPERSTONE:XAUUSD FOREXCOM:XAUUSD FX:XAUUSD OANDA:XAUUSD FXOPEN:XAUUSD
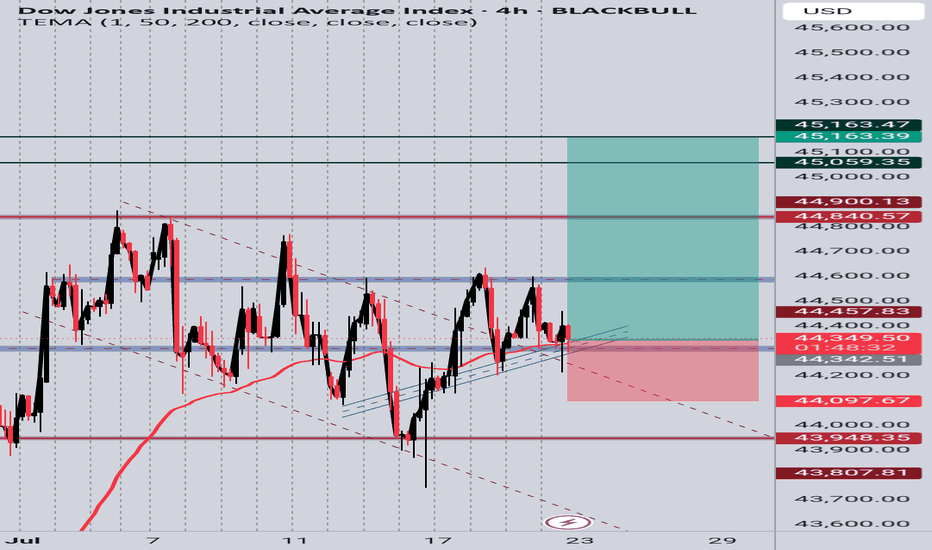
US30 4H Long SetupPrice is respecting a rising trendline and holding above a key support zone. After multiple rejections at the trendline and EMA bounce, current candle shows bullish intent. Targeting previous resistance zones around 45,059 and 45,163. SL placed below the trendline and recent structure low at 44,097. Setup based on structure support, EMA reaction, and potential bullish continuation.
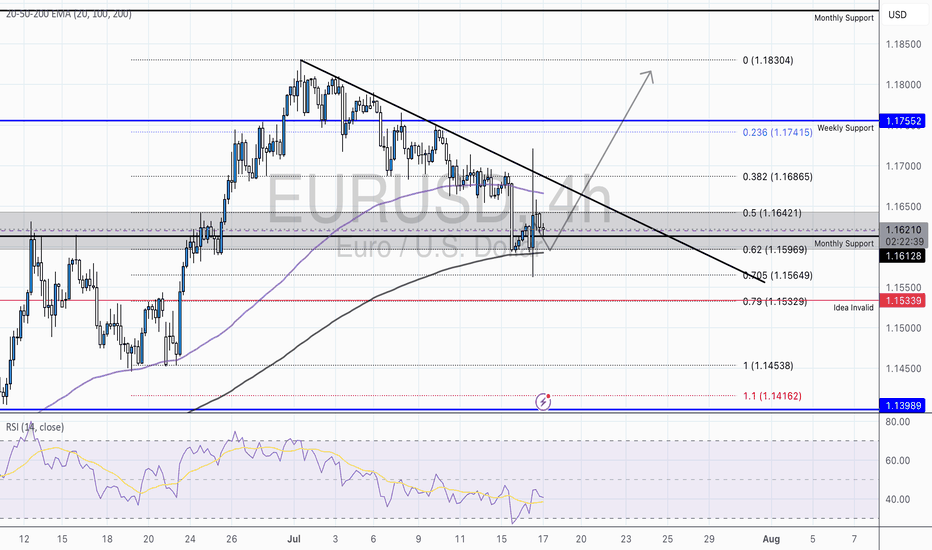
EUR/USD – Falling Wedge at Major Fibonacci Zone | Bullish ReversAfter a strong mid-June rally, EUR/USD has pulled back into a key fib cluster, showing early signs of reversal from a classic falling wedge pattern — often a precursor to bullish breakouts.
Technical Breakdown:
📉 Descending Trendline
🔍 Fibonacci Confluence:
Price is reacting from the 0.5-0.618 – 0.705 zone (1.16421-1.15969), aligning perfectly with historical demand and the golden zone of the fib retracement.
Just below sits the 0.79 fib (1.15339), which also marks our invalidity level for this idea — a deep but powerful retracement if tested.
💡 RSI:
While still below 50, it has created a hidden bullish divergence between July 12–17, hinting that momentum is flipping back to bulls.
🧠 Educational Insight:
This setup combines Trendlines, Fibonacci retracement theory, and EMA dynamics to build a multi-layered trade thesis — the type of confluence we look for at Wright Way Investments.
Price doesn’t just reverse because it hits a fib level. But when structure, EMAs, and RSI align — the odds increase significantly.
📈 Trade Setup (Idea-Based, Not Financial Advice):
Long Entry Zone: Current area (1.159–1.161), with confirmation above 1.1626
Invalidation: Clean break & close below 1.15339
Target Zones:
🎯 TP1 – 1.1642 (50 fib & retest zone)
🎯 TP2 – 1.1686 (38.2 fib)
🎯 TP3 – 1.1755 (Weekly Resistance)
📌 Summary:
EUR/USD is forming a textbook reversal setup, supported by fib precision and EMA alignment. Patience is key — but the ingredients are here for a strong bullish continuation.
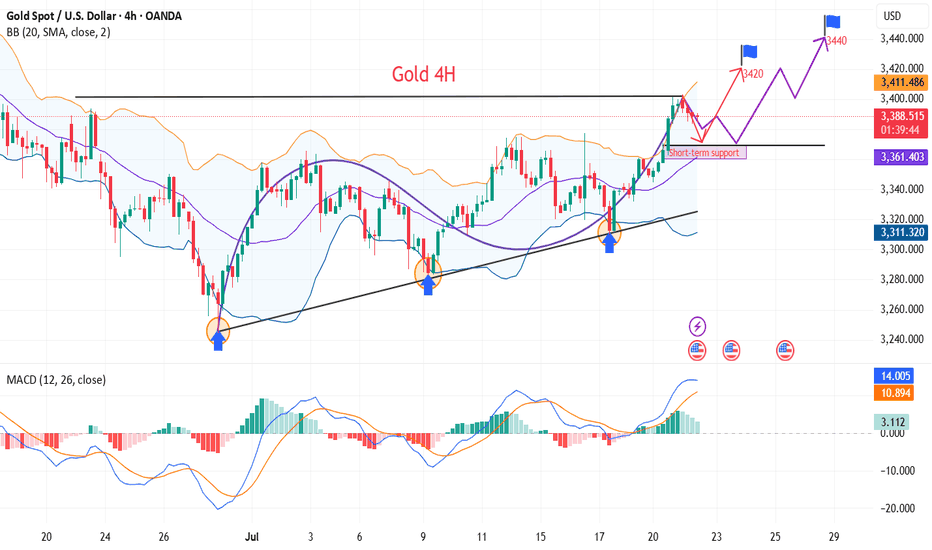
Gold breaks and turns upward! Will it break through 3403? Or wil
Gold fluctuated sideways for another day in this transaction, and only showed signs of further upward attack near the US market. The current gold price is around $3,400/ounce. The gold price is falling from the more than one-month high of $3,403/ounce hit in the early Asian session on Tuesday, and fell to the lowest level of 3,383 before turning around again. So how will the trend be today? Let me explain it to you below!
Why did gold rise across the board this week?
1 On Monday, the uncertainty surrounding the trade agreement between the United States, Japan and the European Union increased, raising concerns about the prospects for US economic growth and suppressing the US dollar. The fate of gold is still closely tied to the trend of the US dollar, which is currently under pressure from US President Trump's tariff negotiations.
2 In addition, Trump has repeatedly called on Federal Reserve Chairman Powell to resign, raising concerns about the independence of the Federal Reserve, causing US bond yields to continue to decline, and also putting pressure on the US dollar. The record rise in Wall Street stock indexes has weakened the safe-haven appeal of the US dollar and the attractiveness of yields, thereby helping gold prices to continue their gains since Friday.
What do you think of the future trend of gold!
From the current market situation, the trend is still in a very strong market, and the current high point of 3403 is in danger. It can only be said that if it breaks through again today, the upper pressure needs to see the 3420 line. This week's trend has not given any chance to step back. It is either a slow rise or a sudden strength in the sideways market. There is basically no chance to enter the market at a suitable position!
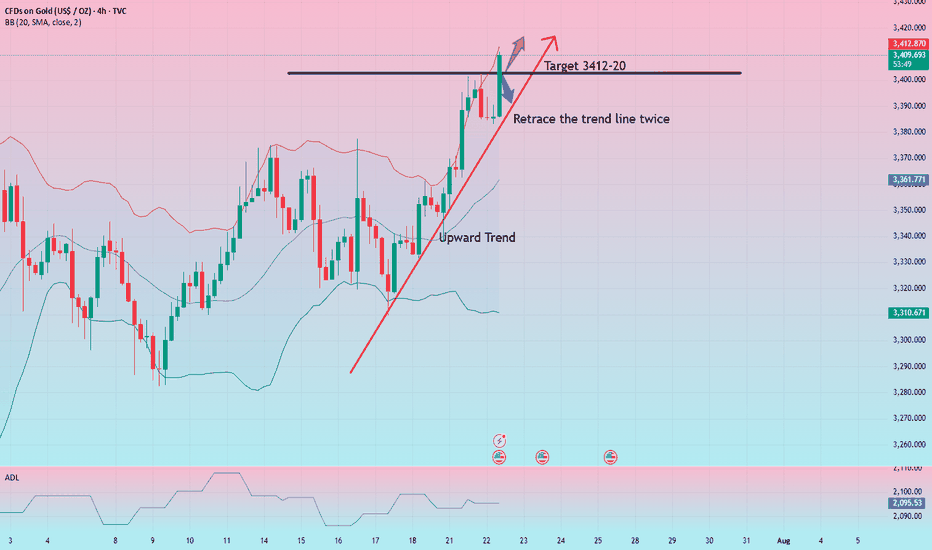
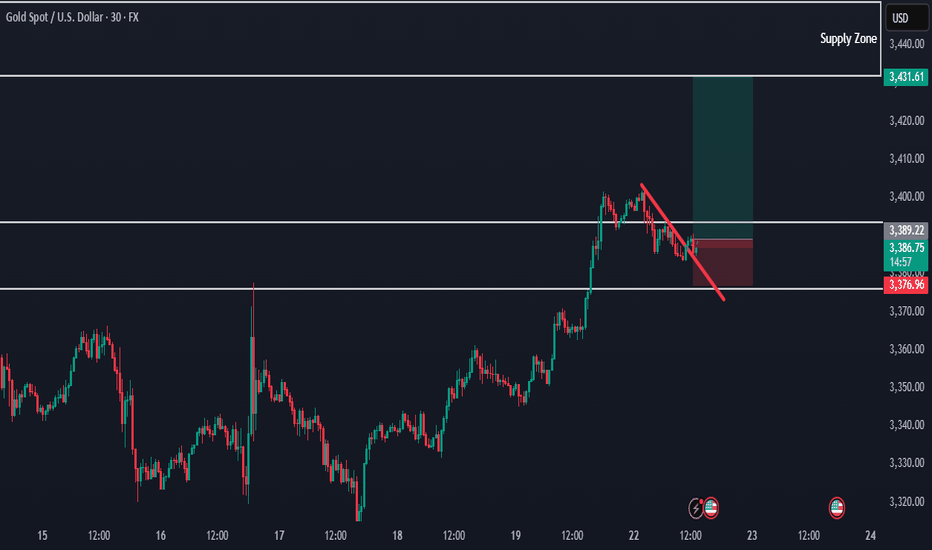
From the current 4-hour trend, there is basically no escape from today's strength, and the current problem is actually whether there is a suitable entry opportunity. Prepare for both hands. One is to look at the previous high of 3403. If it breaks through strongly, go long directly, and look at the 3412-20 line. If it retreats first, then look at the vicinity of 3385 and see the second rise in the US market!
Gold: Long near 3385-87, let go of 75, and the target is 3412-20! If it rises directly and breaks through 3403, you can try to break through long with a light position, and still look at the 3412-20 line above!
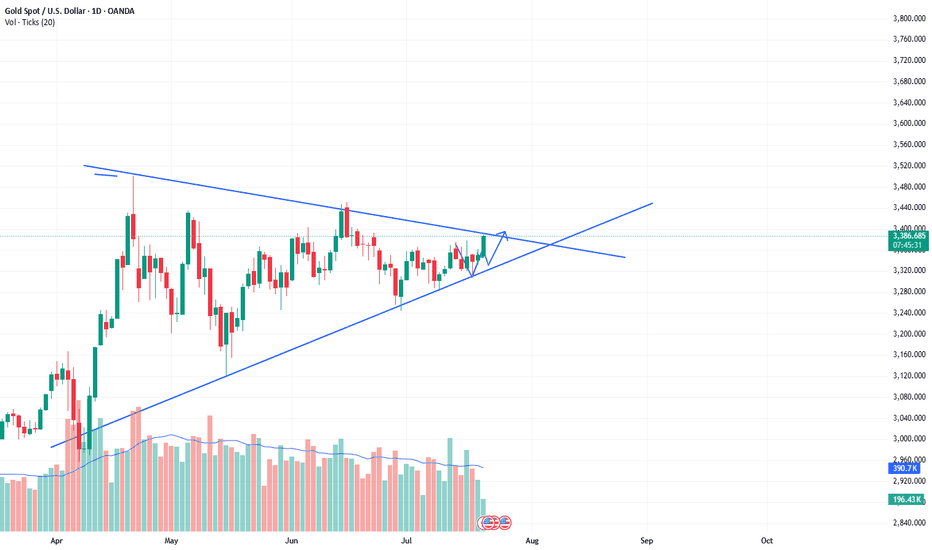
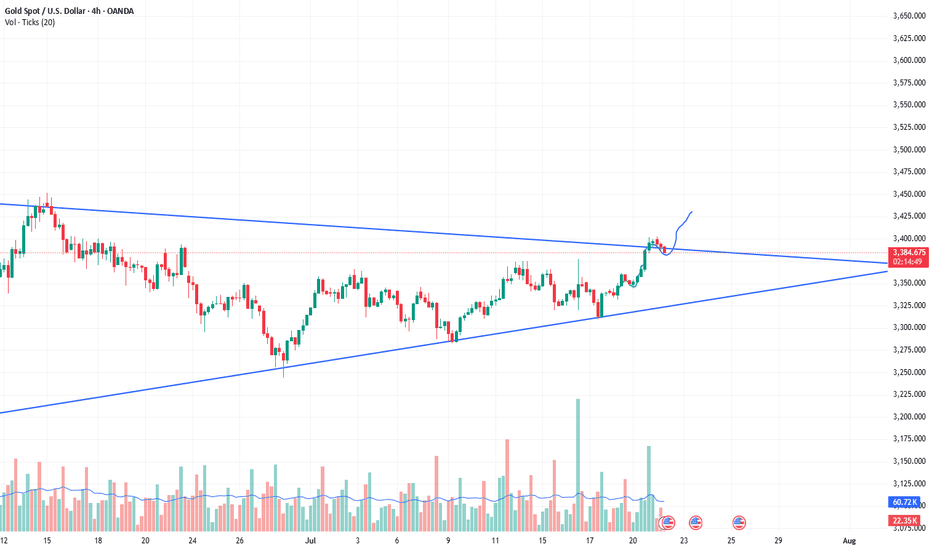
The bull market of xauusd continues, buy and wait for the rise.As predicted in the band trading center in advance over the weekend. The daily level trend is still very stable, and the breakthrough trend has been perfectly carried out. The current quotation is 3388. It is only a matter of time before it rises wildly to the position of 3430. The short-term will definitely break through. The current bull market is clear and has huge potential. The limit of the triangle consolidation phase is about to be broken. Then the bulls will continue to rise. Therefore, buying is the key operation plan.
XAUUSD:Retracement is a buying opportunityAfter the Asian market hit the highest position of 3403, there was some decline. The current gold price is 3386. From the short-term trend of the hourly level. It is still fluctuating at a high level. Combined with the trend of the daily level, there are signs of retracement and counterattack. There is no news dominance. It is purely a technical repair after hitting the high. This retracement can pay attention to the support near 3382-3378. The London and New York markets are still based on buying and profit.
Gold Breaking Previous Highs — Bullish Trend ContinuesHello everybody!
Price is continuing its bullish trend and has broken some significant resistance.
According to the market structure, we’re looking for it to go higher, up to the 3430 area.
The break of the downward trendline is a confirmation for a buy position.
Manage your risk and trade safe!
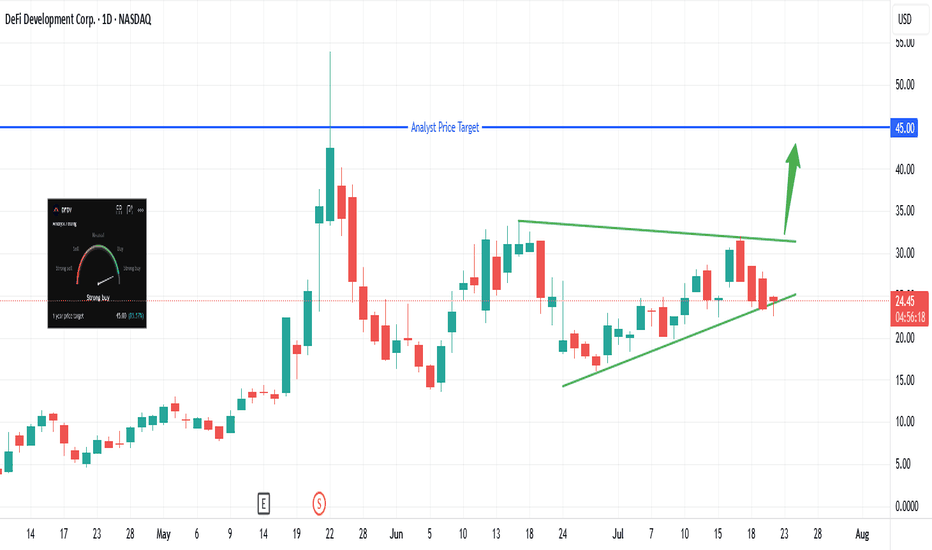
DFDV: Watch This Level for the Next Big Move!Trade Summary
Setup: Ascending triangle holding support; eyeing breakout above recent highs
Entry: Trigger on daily close above $25
Stop‑loss: Below $22.50 (today’s low)
Targets: $30–31 first; $45 (analyst price target) if momentum continues
Risk/Reward: ~2.0 to first target, >4.0 to analyst target
Technical Rationale
Strong horizontal support: $22–23 zone tested and held
Ascending triangle: Higher lows converging on flat resistance, classic bullish pattern
Daily timeframe: Clear structure, with volume picking up on green days
Catalysts & Context
Analyst target at $45, well above current price
Momentum meter: Strong buy reading showing on dashboard
Sector buzz: DeFi stocks showing relative strength; macro risk appetite returning
Trade Management Plan
Entry: On daily close above $25
Stop‑loss: Below $22.50; trail to breakeven if price hits $30
Scaling: Take partial profit at $31, leave runner for $45 if breakout accelerates
What’s your view? Are you watching DFDV? Comment below or vote:
🔼 Bullish
🔽 Bearish
🔄 Waiting for confirmation
*** Follow us now so to make sure you don't miss the next big setup ***
Disclaimer: Not financial advice. Trade at your own risk.
Don't chase the bullish trend,wait for the short position layout#XAUUSD
The tariff policy recently announced by the US government is undoubtedly the focus of the current gold market. Trump also tied the tariffs to the trial of former Brazilian President Jair Bolsonaro, adding to policy uncertainty. ⚖️
The implementation of the tariff policy may push up commodity prices, thereby exacerbating inflationary pressure, which is both an opportunity and a challenge for gold📊. On the one hand, rising inflation expectations may enhance the attractiveness of gold as an anti-inflation asset; on the other hand, the strengthening of the US dollar and US Treasury yields may offset this positive. 💡
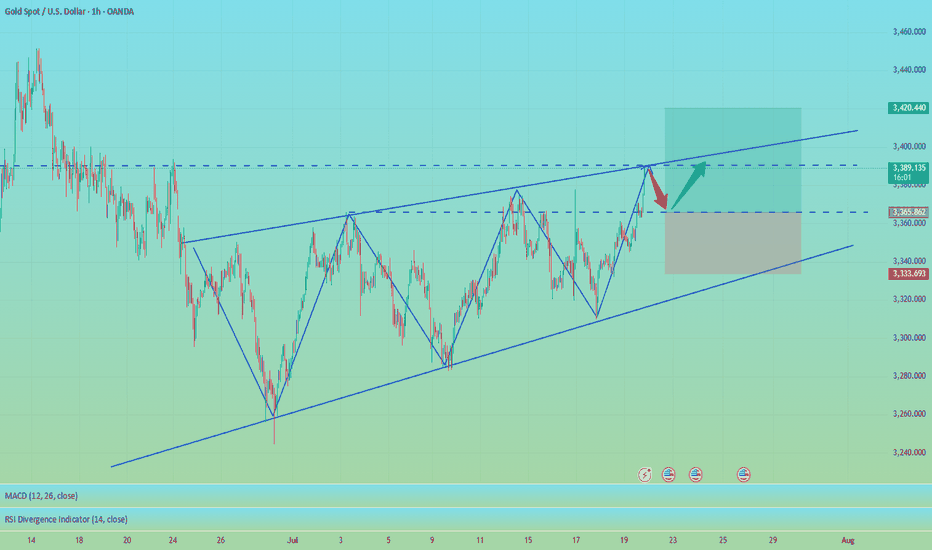
At present, the lower support has moved up to the 3375-3365 area, where a top-bottom conversion position will be formed. The upper short-term resistance level is 3387-3393, the previous high. If the market touches this for the first time, you can try to see a double top fall.
🚀SELL 3385-3390
🚀TP 3365-3355
Gold 3400, gold price returns strongly
💡Message Strategy
The Fed's monetary policy divergence has intensified. Fed Board member Waller advocates a 25 basis point rate cut in July, believing that tariff inflation is temporary; Board member Kugler insists on maintaining high interest rates to fight inflation; Chicago Fed member Goolsbee believes that the latest consumer price index data shows that tariffs have pushed up commodity inflation, and is "slightly concerned" about this, but then expounds on a different view, that is, interest rates are expected to fall sharply in the coming year. It implies that there may be a "substantial rate cut" in the next 12 months.
At present, the Fed has gradually begun to prepare for a rate cut. Whether this is the result of pressure from Trump or the Fed has gradually shown optimism about inflation and concerns about recession, a rate cut is imminent. At present, the market expects the probability of a rate cut in July to rise to 30%, and the probability of a rate cut in September to 54%.
In terms of tariffs, the countdown to August 1 tariffs: the United States plans to impose a 30% tariff on the EU/Mexico, and the EU has drawn up a retaliation list of $84.1 billion. The US Secretary of Commerce expressed confidence that an agreement can be reached with the EU, and small countries need to pay a 10% base tariff. Tariffs will be levied on August 1.
At present, Trump has a tough stance, requiring the minimum tariff of the European and American agreement to be set at 15%-20%, and the scope of exemptions is narrowed (only aviation, medical equipment, etc.). The deadline is approaching, and the market has also begun to start a risk-averse expectation mode.
📊Technical aspects
From the 1H cycle trend structure, gold is currently rebounding upward and breaking through the 4H level downward trend line. From the indicator point of view, the 1-hour level Ichimoku Kinko Hyo indicator breaking through the baseline on the turning line, the delay line stands firmly above the K line, the future cloud is an upward cloud, and the bullish signal is significant.
Gold is currently in the center of the rising channel cloud. Today, we can focus on the support brought by the lower boundary of the channel and try to go long.
Gold rose as expected, and the bulls began to remain strong. Once gold breaks through the upper pressure, it will continue to gain momentum, and gold bulls are expected to reach a higher level.
💰Strategy Package
Long Position:3370-3380,SL:3350,Target: 3420,3400
3400 is no longer the target for gold. The answer is: higher
After gold touched 3,400, most people expected gold to fall back. This kind of rigid thinking is often out of touch with reality. During the rise, do you think it is better to short at highs or to go long on pullbacks?
💡Message Strategy
This round of gold's upward movement is not accidental. Behind it are significant changes in macro fundamentals. First, the overall weakening of the US dollar. The recent decline of the US dollar index to below the 98 mark reflects the market's concerns about the outlook for the Fed's policy. At the same time, the 10-year US Treasury yield also fell below 2%, and the actual yield fell, strengthening the relative attractiveness of gold.
More worthy of vigilance are the political rumors surrounding the re-election of Fed Chairman Powell. According to the Wall Street Journal, US Treasury Secretary Bessent once advised the president to avoid removing Powell from office to maintain the reputation of the Fed. However, speculation about Powell's possible dismissal remains, although Trump himself publicly denied the relevant plan.
In addition, Europe's actions have also disturbed the market. According to Bloomberg, citing EU diplomatic sources, if no agreement is reached before August 1, the EU will impose retaliatory tariffs on US products worth US$72 billion, covering areas such as automobiles, aircraft, alcohol and digital services. These messages have formed a risk resonance environment of "political uncertainty + economic friction", providing a natural long hotbed for gold.
Although the US economic data is slightly mixed - consumer confidence has rebounded, but inflationary pressure continues, with CPI approaching 3% in June - this has made the market full of doubts about the Fed's monetary policy path. Especially in the case of sparse economic data this week (only new housing data, initial claims and durable goods orders), the market focus is on the impact of political and policy conflicts on market confidence.
📊Technical aspects
From the daily candlestick chart, gold has recently shown signs of breaking upward after five weeks of sideways fluctuations. In terms of MACD indicators, the MACD histogram has turned from green to red, and the fast and slow lines have formed a "golden cross", strengthening the expectation of a short-term technical rebound.
For gold's lower support, pay attention to last week's high of $3,380, which is also the current 4-hour MA10 moving average position. Secondly, pay attention to the multiple declines in gold prices in the European session on Monday to test the stabilization position of $3,370. For gold's upper pressure, pay attention to the intraday high of $3,402, which is also the high point of gold's rise on Monday. After the decline in June, gold prices rebounded several times to test resistance here and further strengthened. The upper space can pay attention to the high point of the past three months at $3,440.
The previous five weeks of consolidation showed that the market was waiting for directional signals, and this breakthrough of the 3,400 mark was achieved against the dual backdrop of a falling US dollar and rising political uncertainty in the United States, with the typical characteristics of "news trigger + technical confirmation".
If gold successfully stabilizes above 3400, the market will turn its attention to the two key resistance areas of 3451 and 3499, the year's high. Breaking through the former will open up space to test new historical highs upwards; combined with the current MACD golden cross pattern, if the capital side and fundamentals continue to cooperate, short-term accelerated rise cannot be ruled out.
💰Strategy Package
Long Position:3370-3380,SL:3350,Target: 3420,3440
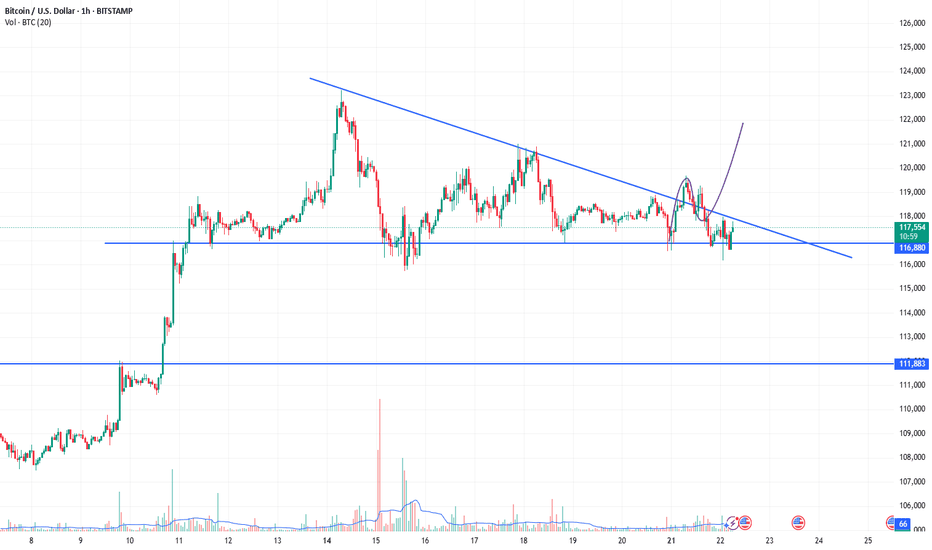
Btcusd:Huge trading opportunities and ideasBTCUSD's rebound after touching the position near 116180 this time is fast. From the trend observation. BTCUSD is still in a high consolidation stage. It has not broken the oscillation range for the time being. It can maintain selling near 120k. Buying near 11600 for range trading. It is expected that there will not be many trading opportunities in the London market. It will take until the New York market opens to see better trading opportunities.
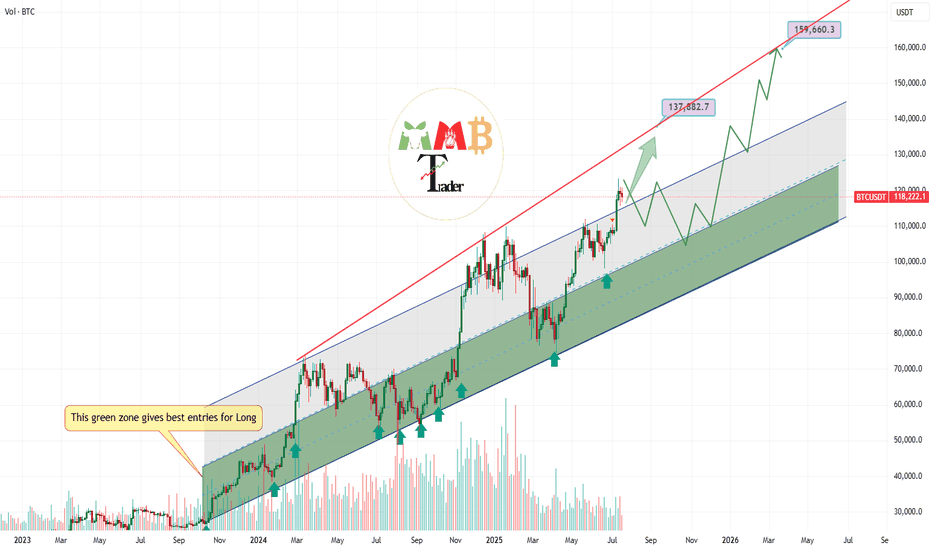
Bitcoin first target and short-term pump at least to 137K$ aheadAs we can see stop and next range zone for price can be near 135K$ to 137K$ and also major support zones now are 115K$ and 105K$ that can pump price once again if they touch.
Red trendline was strong resistance and it usually stop the pump and it is daily high detector now unless it breaks this time.
DISCLAIMER: ((trade based on your own decision))
<<press like👍 if you enjoy💚
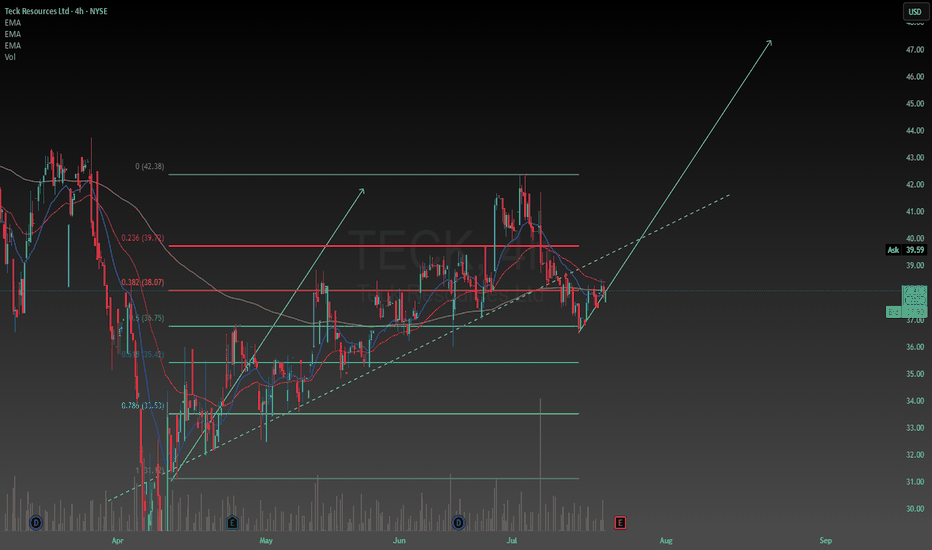
Long TeckThe fundamentals are good and macroeconomic factors contribute to the positive outlook. It seems to be trading above its intrinsic value but I'm going to take it anyways with the earnings report coming out soon the volatility should be interesting. Putting a couple percent of my portfolio to it and see how it goes. Probably hold it until the end of the year if it goes good.
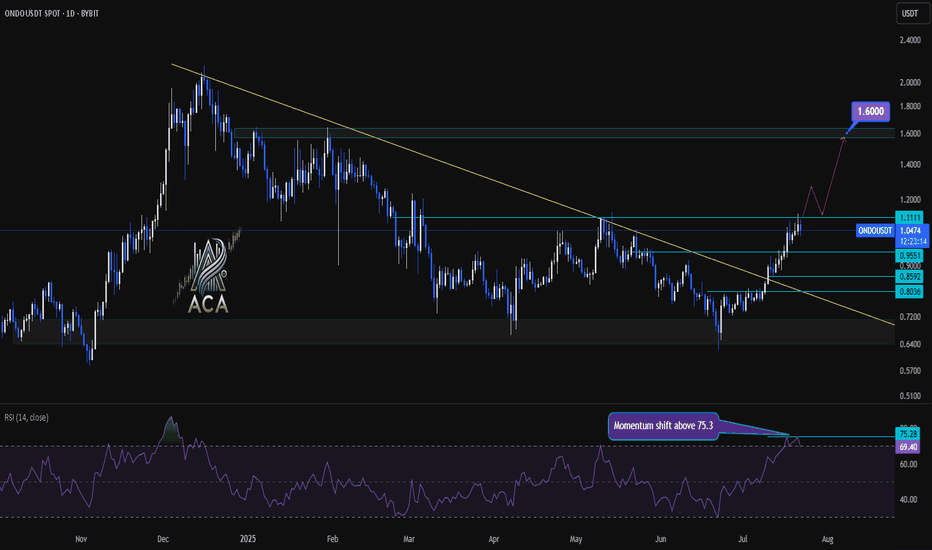
ONDOUSDT Daily Chart Analysis | Momentum Shift & Breakout LevelsONDOUSDT Daily Chart Analysis | Momentum Shift & Breakout Levels
🔍 Let’s dive into the ONDO/USDT daily chart and break down the latest momentum signals, key breakout areas, and targets for bulls.
⏳ Daily Chart Overview
The daily trend shows significant recovery after prolonged downward pressure, with price action now testing critical resistance levels. A key descending trend line has recently been challenged, highlighting a potential shift in market structure.
🔺 Bullish Setup
- Momentum Trigger: The RSI has closed above 75.3, signaling a strong momentum shift and upping the odds for continued upside.
- Breakout Confirmation: Watch for a daily candle close above the $1.1111 resistance level. This would confirm a bullish breakout and could serve as a solid trigger for further upside.
- Trend Line Dynamics: The price has decisively broken above the major descending trend line, which had capped rallies for months—removing a significant area of supply and emboldening bulls.
- Upside Target: Once confirmed, this setup opens the door for an advance towards the $1.60 area, where the next major resistance sits.
📊 Key Highlights
- Daily RSI closing above 75.3 reflects strong market momentum and buyer dominance.
- A daily candle close above $1.1111 can be used as a bullish trigger.
- The long-term descending trend line has been broken, indicating a major momentum shift.
- Immediate upside target stands at $1.60, representing a clear resistance level for profits or further evaluation.
🚨 Conclusion
Momentum is clearly shifting in favor of the bulls as technical barriers fall by the wayside. For traders looking to position long, confirmation above $1.1111 combined with the powerful RSI reading sets the stage for a move towards $1.60—keep these levels on your radar as the setup plays out!
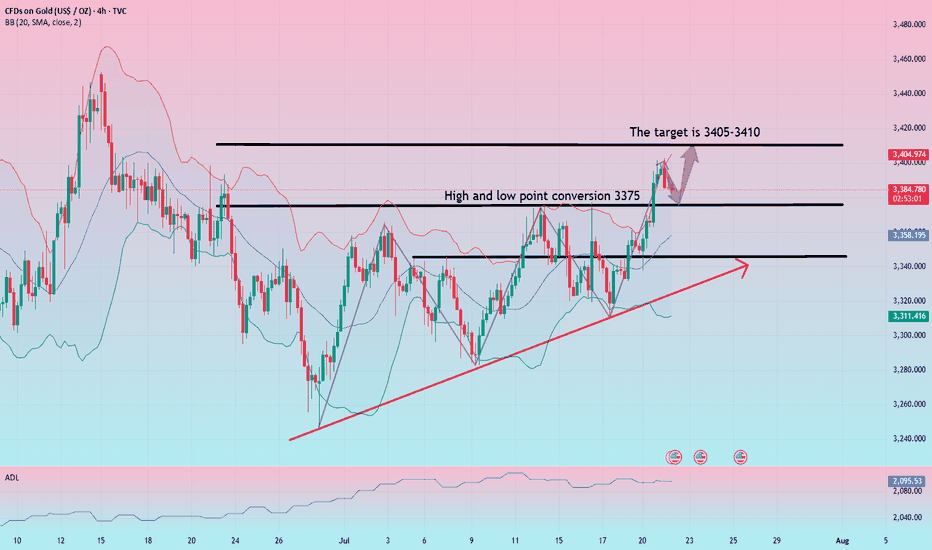
Can gold continue to fall slowly sideways? Focus on the 3375 wat
On Tuesday, spot gold fell back mildly after yesterday's surge. The current gold price is around $3,384/ounce. Spot gold prices surged more than 1% on Monday and hit a five-week high. The main reason was that the US dollar and US bond yields plummeted, and investors were uneasy about the approaching deadline for tariff negotiations on August 1. The market is facing various uncertainties, which does provide support for gold.
Views on today's gold trend!
After more than a month of volatile trends, gold once again broke through the integer mark of 3,400 on the first trading day of this week. Under the current bullish sentiment of creating a new high, the previous short-term downward trend ended. From the daily chart, gold is still in an upward trend in the long term. The previous market rebounded effectively after touching the downward trend line, and the rebound force was considerable. With the restart of the bullish force, the main idea can carry the trend and buy on dips.
From the 4-hour chart, the continuous rise of gold and the turning of the moving average have made the market bulls more aggressive, which means that the previous short-term downward trend has ended. At present, a new trend is opening up in the 4-hour chart. The rise of gold has also established an upward trend line. You can consider buying on dips against the 3375 watershed.
Gold: Buy near 3375, defend 65, and target 3405-3410!
