Trend Lines
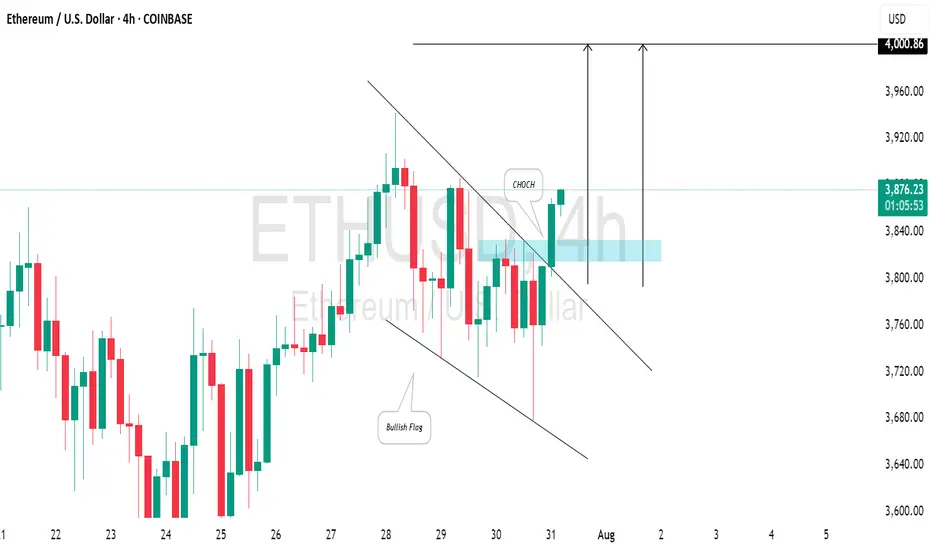
ETHEREUM (ETHUSD): Strong Bullish SignalsI spotted 2 important price action confirmations on 📈ETHEREUM:
The price has surpassed a resistance line of a bullish flag and established a confirmed change of character (CHoCH) on the 4-hour chart.
I believe the market will maintain a bullish trend, with the next resistance at the 4000 level.
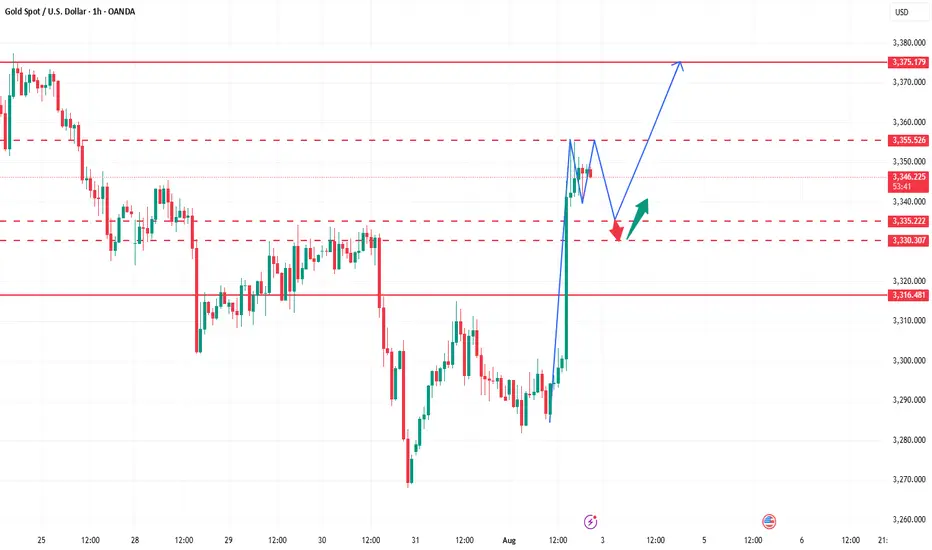
How to accurately grasp the gold trading opportunitiesGold was greatly affected by the positive non-farm payroll data, and it rose strongly, with the increase completely covering all the losses this week. The current gold trend has completely reversed the previous bull-short balance. After breaking through the 3300 level and rising to around 3355, it maintains strong upward momentum, and the possibility of further testing the 3360-3375 area cannot be ruled out. Due to the strong positive data, if everyone fails to chase the long position or set a breakout long position in time in the first wave of the market, the subsequent pullback opportunities may be relatively limited, so it is necessary to maintain an active strategy in operation. It is recommended to continue to be bullish when it retreats to the 3335-3320 area, and the upper target is the 3360-3375 pressure range.

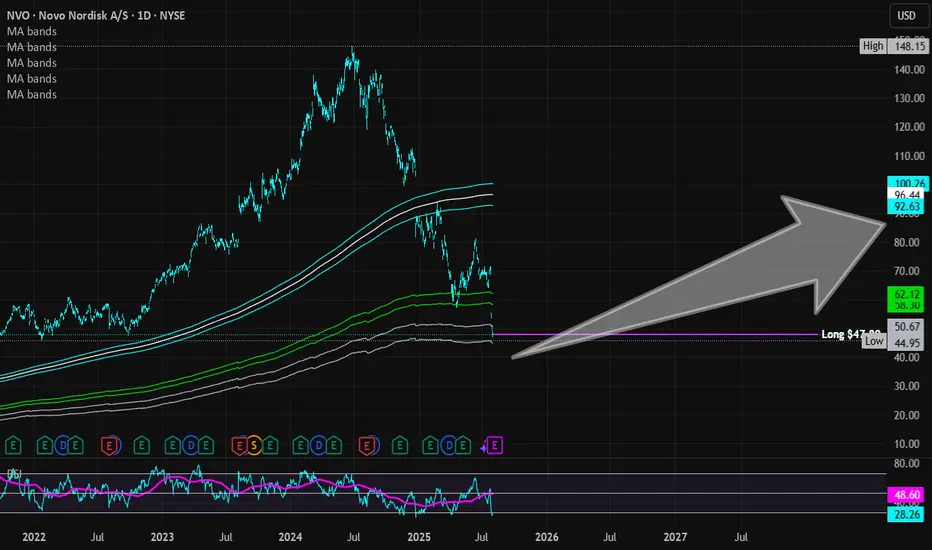
Novo Nordisk (Revised) | NVO | Long at $47.78**This is a revised analysis from February 5, 2025: I am still in that position, but added significantly more below $50**
Novo Nordisk NYSE:NVO is now trading at valuations before its release of Wegovy and Ozempic... From a technical analysis perspective, it's within my "major crash" simple moving average zone (gray lines). When a company's stock price enters this region (especially large and healthy companies) I always grab shares - either for a temporary future bounce or a long-term hold. While currently trading near $47 a share, I think worst case scenario here in 2025 is near $38-$39. Tariffs may cause a recession in the second half of 2025, so no company would be immune.
As mentioned above, I am still a holder at $86.74. However, I went in much heavier within my "major crash" simple moving average band and have a final entry planned near $38-$38 (if it drops there). My current cost average is near $55.00.
Why do I still have faith in NYSE:NVO ? Because no one else does right now, yet it generated $42 billion in revenue, $14 billion in profits, and has significant cash flow YoY. The company has a massive pipeline, despite Wegovy and Ozempic competition, and I think the market is undervaluing its position in the pharmaceutical industry.
Revised Targets in 2028:
$60.00 (+25.6%)
$70.00 (+46.5%)
$80.00 (+67.4%)
ETHUSDT.PIf you look at the chart, you will notice an uptrend that has somewhat lost its strength and we may not be able to hit higher highs like the next strength in the next move.
Support: 3.660 - 3.590 - 3.160
Resistance: 3.900 - 4.260
Entry: 3.700
SL: 3.500
TP: 4.240
Please control risk management.⚠️

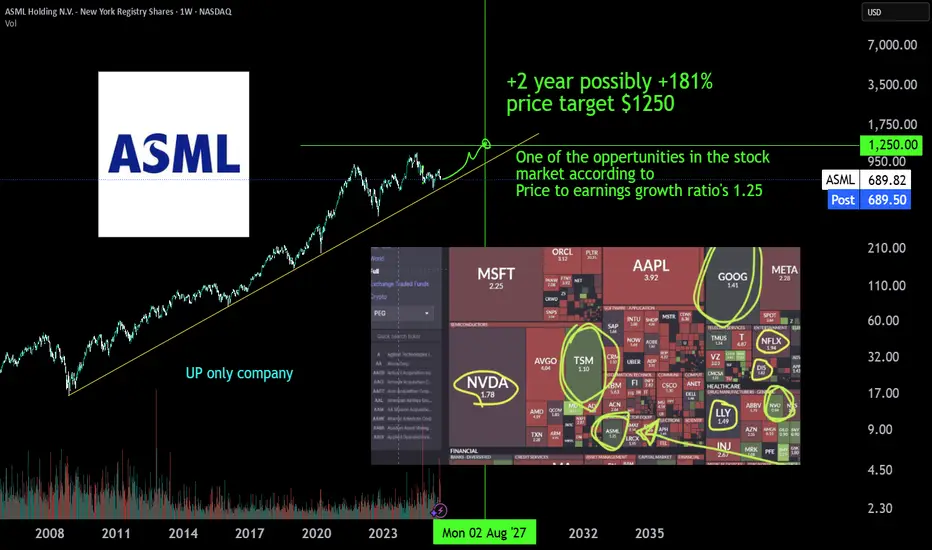
ASML monopolist, a +181% | 2Y oppertunityASML is the monopoly Extreme ultra violet machinery company. There is no one close to it's technology or there is no one investing enough to R&D a thing like it. The whole AI datacenter and cloud chip growth depends on EUV machinery of ASML developed in 2013 (>10y of PhD level R&D deveopment). The first new High-NA EUV systems have been deployed at Intel in July 2025 for research purposes and will scale just like the EUV already does to keep pace with moore's law. TSMC has stated it will not yet buy & depoly the newest machines jet, but has to expand with the 10 year older tech EUV machines just to get the AI chip demand going. AI chip demand at NVIDIA is growing harder than expected comfirmed by latest earnigns of alphabet, microsoft, meta and amazon. The whole AI data center growh depends on 2013 asml tech machines, and they already have a new tech High-NA EUV machine, just figure.
Also don't sleep on BESI a packing machinery wonder, due to hybrid bonding which makes stacking 3D chip structures possible.
#GoHighTechNetherlands
How to seize the key turning points in the gold market?The market is ever-changing, and following the trend is the best strategy. When the trend emerges, jump in; don't buy against it, or you'll suffer. Remember not to act on impulse when trading. The market is a haven for all kinds of resistance, so don't hold onto positions. I'm sure many people have experienced this: the more you hold onto positions, the more panic you become, leading to ever-increasing losses, poor sleep, and missed opportunities. If you share these concerns, why not try following Tian Haoyang's lead and see if it can open your eyes? I'm always here for you if you need help, but how can I help you if you don't even offer a hand?
Gold did not fall below 3280 during the day on Friday and started to fluctuate in the range of 3280-3300. The non-farm payroll data was bullish, and it directly broke through the pressure of 3315, and then broke through the important pressure of 3335 again. As of now, it has reached a high near 3355. The non-farm payroll data market has almost been exhausted. Next, we will focus on the technical form adjustment. At present, you can consider light shorting in the area near 3355-3370. After all, chasing long is risky, and the technical side needs to be adjusted. If your current operation is not ideal, I hope I can help you avoid detours in your investment. Welcome to communicate with me.
Based on the 4-hour chart, short-term resistance is near 3355-3365, with a focus on the key resistance level of 3370-3375. Short-term buy orders should be taken if a rebound continues. I'll provide detailed trading strategies at the bottom of the page, so stay tuned.
Gold operation strategy: Short gold in batches when gold rebounds to 3355-3370, with the target being the area around 3340-3335. Continue to hold if it breaks through.
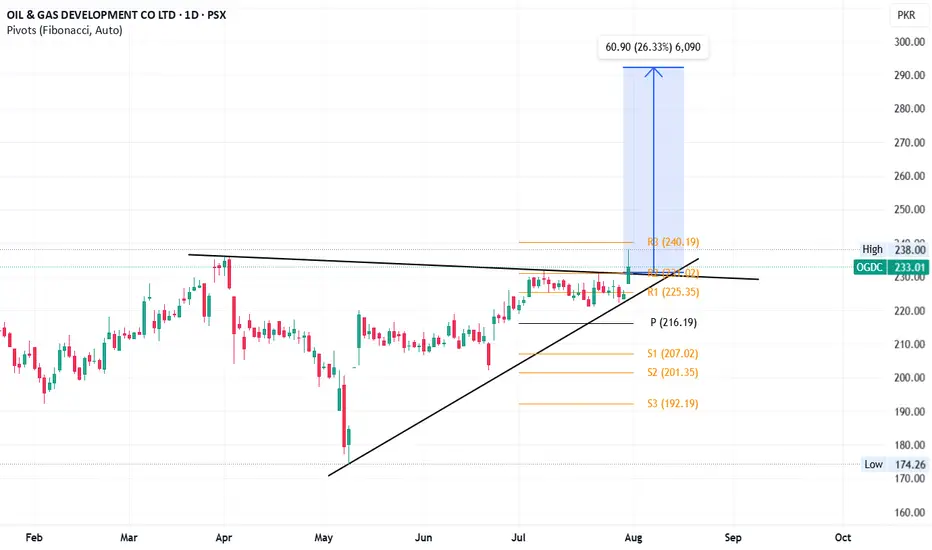
OGDC Breakout?On a daily timeframe, OGDC has given breakout of a triangle pattern. This will open up doors for it to move towards its all-time high i.e. ~290 region.
This is my personal opinion, not a buy / sell call.
All other indicators e.g. RSI, Stoch and MACD are bullish as well.
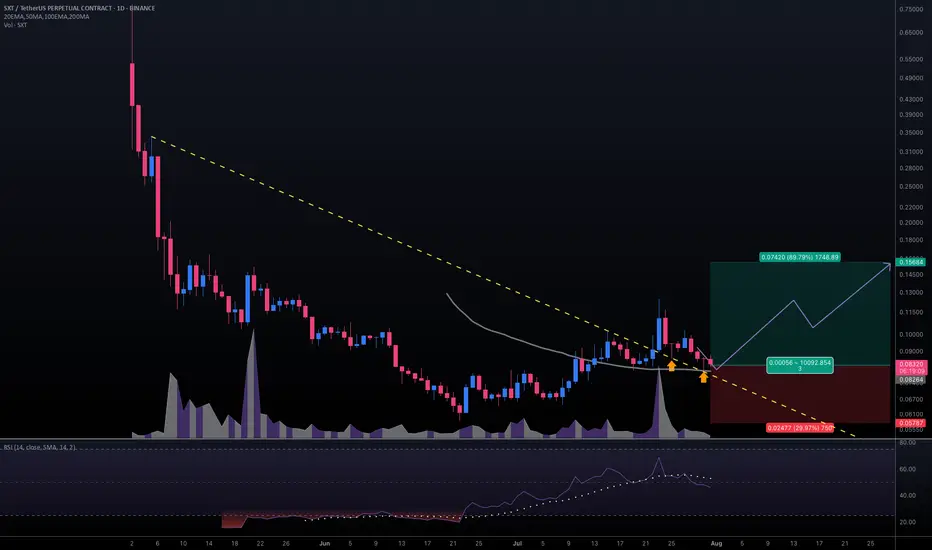
#SXTUSDT #1D (Binance Futures) Descending trendline break retestSpace and Time (SXT) pulled back to 50MA daily support, looks ready for mid-term recovery after those two dragonfly dojis in a row.
⚡️⚡️ #SXT/USDT ⚡️⚡️
Exchanges: Binance Futures
Signal Type: Regular (Long)
Leverage: Isolated (2.0X)
Amount: 5.0%
Entry Targets:
1) 0.08264
Take-Profit Targets:
1) 0.15684
Stop Targets:
1) 0.05787
Published By: @Zblaba
NYSE:SXT BINANCE:SXTUSDT.P #1D #SpaceAndTime #ZK #AI #DPoS spaceandtime.io
Risk/Reward= 1:3.0
Expected Profit= +179.6%
Possible Loss= -59.9%
Estimated Gaintime= 1 month
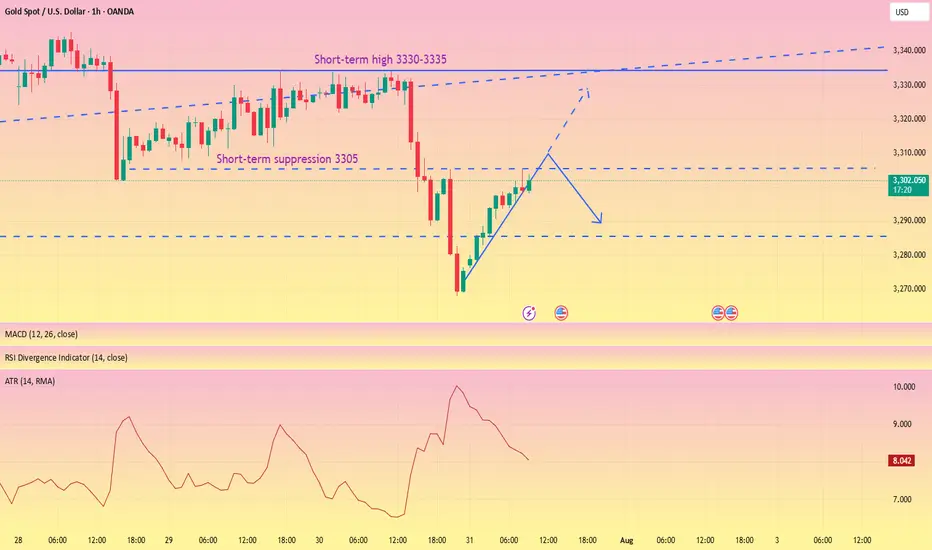
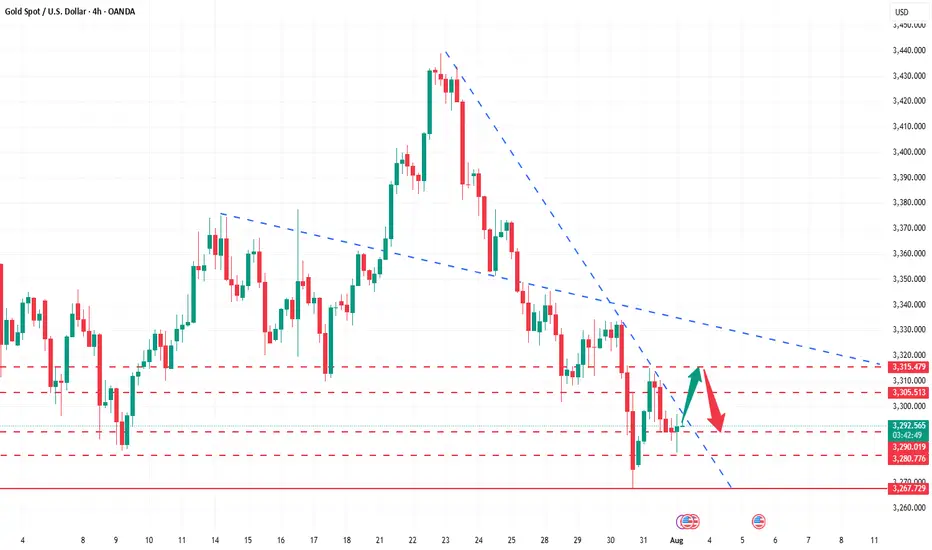
The rebound is weak, short orders intervene#XAUUSD
After two consecutive trading days of volatility, gold finally began to fall under pressure near 3335. After breaking through the 3300 mark, the price of gold accelerated its decline, reaching a low of around 3268, and yesterday's daily line closed with a large negative line. 📊
Today's rebound is more likely to be based on the buffering performance of the impact of news. The ATR data also shows that the bullish momentum is slowly weakening in the short term. 🐻After digesting the impact of yesterday's news through rebound during the day, it may fall again in the future.📉
📎The primary focus today is 3305 above, which was also the high point of yesterday's pullback correction. If the gold price rebounds to 3305-3320 and encounters resistance and pressure,📉 you can consider shorting and look towards 3290-3270.🎯
If the short-term gold rebound momentum is strong and breaks through the 3305-3320 resistance area, it will be necessary to stop loss in time. Gold may be expected to touch yesterday's high resistance of 3330-3335, which is the second point to consider shorting during the day.💡
🚀 SELL 3305-3320
🚀 TP 3290-3270
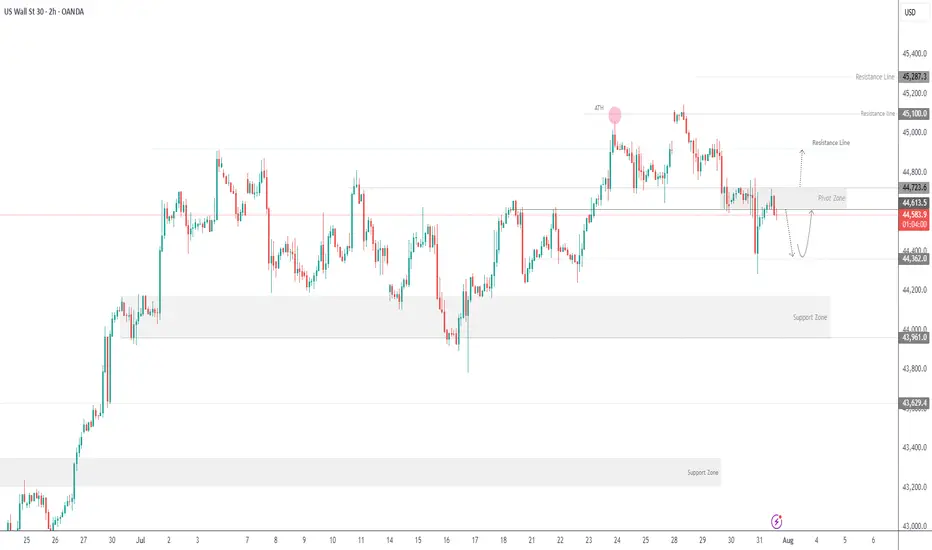
US30 Faces Pressure Below 44610US30 Overview
Technical Outlook:
US30 is showing bearish momentum while trading below the pivot zone at 44610. As long as the price remains under this level, downside pressure may continue toward 44360, with further support at 44180.
However, a confirmed breakout above 44720 would shift the bias to bullish, opening the path toward 44910 and potentially 45100.
Support Levels: 44480 • 44360 • 44180
Resistance Levels: 44720 • 44910 • 45100
Bias: Bearish below 44610, Bullish above 44720
How to maintain stable operations before NFP dataYesterday, gold closed the month with a long upper shadow doji candlestick, indicating strong upward pressure, with monthly resistance at 3439-3451. Today marks the beginning of the month, and with the release of numerous data indicators such as NFP, unemployment benefits, and PMI, there is considerable uncertainty, so intraday trading should proceed with caution.
Judging from the daily chart, the current MACD indicator is dead cross with large volume, and the smart indicator is running oversold, indicating a low-level fluctuation trend during the day. At present, we need to pay attention to the SMA60 moving average and the daily middle track corresponding to 3327-3337 on the upper side, and pay attention to the intraday low around 3280 on the lower side. The lows of the previous two days at 3275-3268 cannot be ignored. There is a possibility that the low-level oscillation will touch the previous low again.
From the 4H chart, technical indicators are currently flat, with no significant short-term fluctuations expected. Low-level volatility is expected to persist within the day. Then just focus on the support near 3275 below and the middle track pressure near 3307 above. Looking at the hourly chart, gold is currently oscillating below the mid-range band, with resistance at 3295-3307 to watch in the short term.
Overall, the market is expected to remain volatile before the release of today's data. Based on Wednesday's ADP data, this round of data is also expected to be around $100,000. The contrast between ADP and NFP last time deserves our caution. The current market is basically optimistic about the short-selling situation, which is exactly what I am most worried about. If the gold price can stabilize above 3,300 before the NY data, the possibility of NFP data being bullish cannot be ruled out.
Intraday European trading suggestion: if the current gold price falls back to 3285-3280 and stabilizes, you can consider short-term long positions, with the target at 3295-3305. If the gold price tests the low of 3275-3268 again and does not break through, you can consider a second chance to go long. After making a profit of $10-20, you can consider exiting the market with profits. The market is volatile and unstable, so be sure to bring SL with you and pay close attention to the impact of the NFP data. Conservative investors can enter the market after the data is released.
EURUSD – Smart Money Short Setup During NFP Friday | ICT Concept
EURUSD is trading inside a well-defined bearish structure after multiple internal liquidity sweeps during the London and Asia sessions.
As we enter the New York Killzone, price has returned to a bearish OB near the NY Midnight Open, with clear signs of exhaustion.
The pair failed to break above the Thursday OB zone, and the 15M chart shows consecutive MSS and BOS patterns, indicating supply is in control.
🧠 Trade Idea (Execution Plan):
Sell Limit: 1.14183
SL: 1.14422
TP1: 1.13877
TP2: 1.13608
TP3: 1.13351
📌 Confluence:
Bearish OB
NY Midnight Open rejection
MSS on LTF
RSI/Williams %R Overbought
📉 Structure: Bearish
🕒 Session: New York (NFP Volatility Expected)
💡 Context: USD is likely to strengthen after deep retracement into DXY OB, targeting 100.5–100.7
If price invalidates 1.14422 with bullish displacement, setup becomes void.
Patience is key during high-impact news – let Smart Money show their hand.

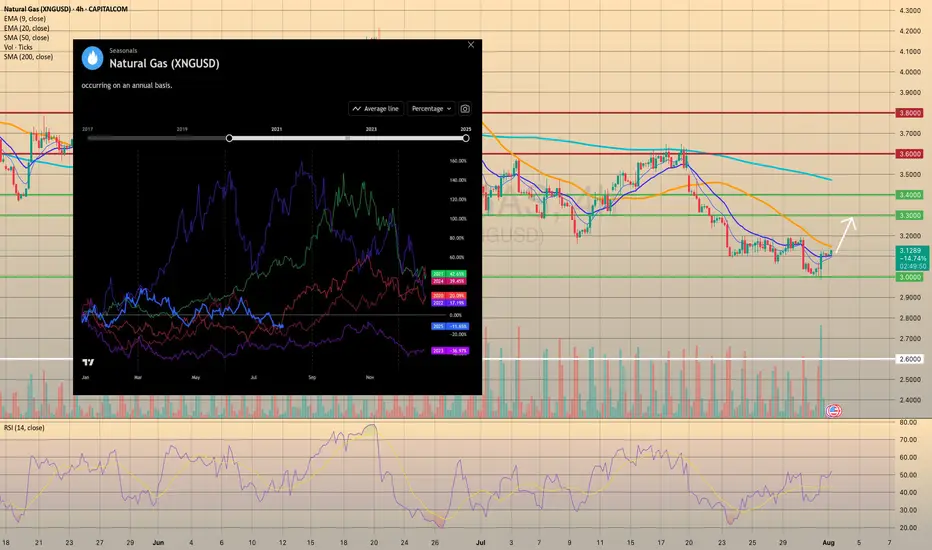
U.S. NATURAL GAS SUCCESSFULLY REBOUNDED FROM FIRM SUPPORT.U.S. NATURAL GAS SUCCESSFULLY REBOUNDED FROM FIRM SUPPORT.
Yesterday the natural gas storage report came out higher than expected. U.S. natural gas inventories increased by 48 billion cubic feet last week to 3,123 Bcf, increasing the surplus over the five-year average to 195 Bcf from 171 Bcf the week before, the EIA reports. The storage increase was bigger than the 24 Bcf average for the week, and above the 36 Bcf estimate. However, the price rised on 2.35% afterwards, supported by increased volume, which indicates the strength of the level. The upward movement towards the 3.3000 level is highly expected.
Additionally, seasonals suggest us that current prices may become the lowest till the end of the year. Historically, since August the natural gas prices increase in anticipation of a new heating season and higher energy demand (pic2).
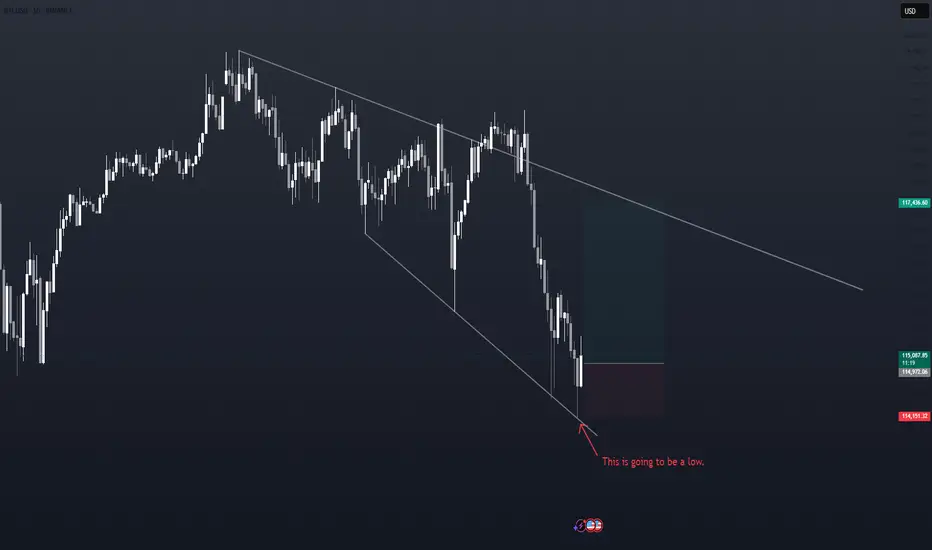
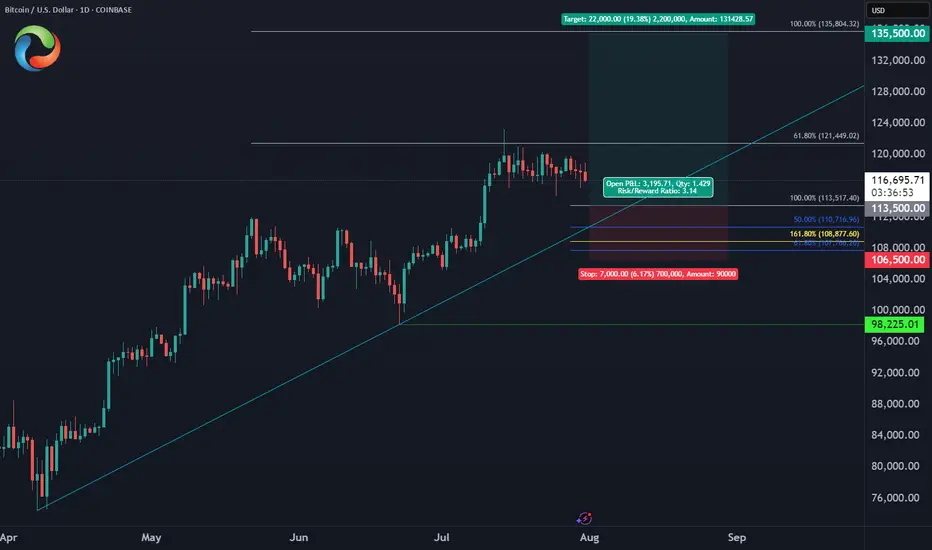
Bitcoin August Trade PlanBINANCE:BTCUSD
✅Entry Zone: $113,500 - $110,700
⛔️Stop: $106,500 (below June low)
🎯Target: $135,500 (ATH liquidity)
🔖Risk/Reward: 1:3
How to correctly grasp the gold trading opportunities?Yesterday, gold prices saw a technical rally amidst volatile trading, followed by a downward trend under pressure. Bulls strongly supported a rebound at 3280 in the Asian session. The European session saw an accelerated upward move, breaking through 3314 before retreating under pressure. We also precisely positioned short positions below 3315, achieving a perfect target of 3290-3295. During the US session, the market again faced pressure at 3311, weakening in a volatile trend before breaking through 3300. The daily chart ultimately closed with a medium-sized bullish candlestick pattern, followed by a pullback and then a decline.
Overall, after yesterday's rebound, gold prices remain under pressure at the key resistance level of 3314. The short-term bearish weakness line has moved down to this level. If pressure continues in this area in the short term, gold will maintain a weak and volatile structure, with intraday trading remaining focused on rebounds and upward moves. If you are currently experiencing confusion or unsatisfactory trading strategies, please feel free to discuss your options and help avoid investment pitfalls.
From a 4-hour analysis perspective, focus on resistance at 3305-3315 on the upside. A rebound to this level is a good opportunity to short against resistance. Focus on support at 3280-3270 on the downside. Unless the price stabilizes strongly, consider not entering long positions below this level. The overall strategy remains to short on rebounds, with the same rhythm. I will provide timely notifications of specific levels from the bottom, so keep an eye on them.
Gold Trading Strategy: Short on rebounds near 3305-3315, with targets at 3290-3280-3270.
Gold rebound is weak, short below 3315
Gold remains weak, with multiple intraday rebounds failing to maintain momentum. The upper moving average continues to suppress the market, and the short-term market remains dominated by bears. Today, we are following the trend and taking a bearish stance. The key upside level is around 3315. If it reaches this level before the US market opens or if it peaks in the short term, we will short sell. The non-farm payroll data will be released today, and we will consider reversing our direction based on the situation after the data.
Gold prices have once again encountered resistance to their upward trend, and the volatile pattern continues. The gold price trend is trending lower highs, and today's low is expected to be lower than yesterday's. Therefore, our intraday short target could be 3268 or even lower, so it's crucial to seize the right entry point.
If you're new to the market, come to me. I'll teach you how to trade while you learn. If you're already in the market and struggling, come to me. I'll help you avoid repeating the same mistakes. If you've already experienced this market and are battered, come to me. I'm confident I can help you regain confidence. If you're stuck in a position, I'll develop a strategy tailored to your entry point. Because everyone's trapped positions are different, the solutions will vary, some suitable for conservative traders and others for aggressive ones. However, I can't offer a perfect answer to every situation. I suggest you bring your order with you. Once you contact me, I'll use the most appropriate method to resolve your situation and help you exit the market.
Specific Strategy
Short gold at 3315, stop loss at 3325, target at 3280
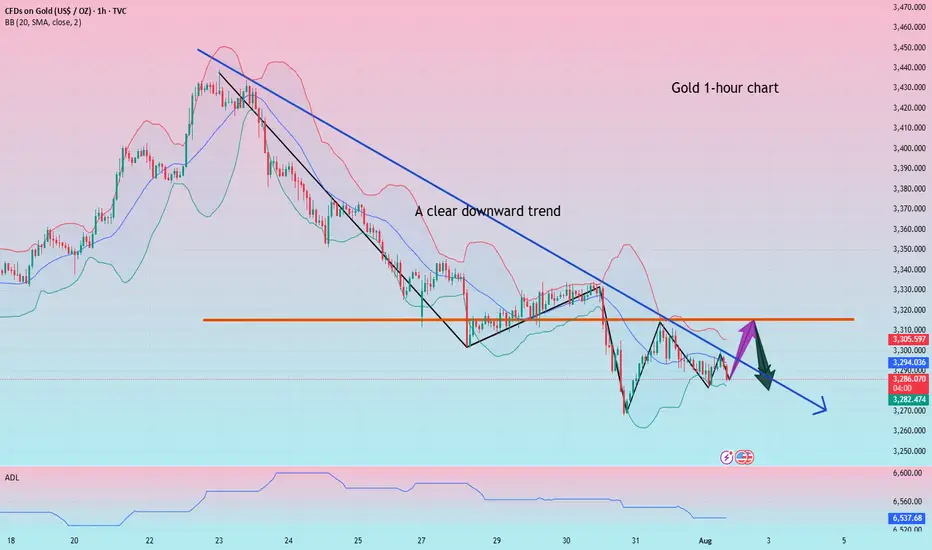
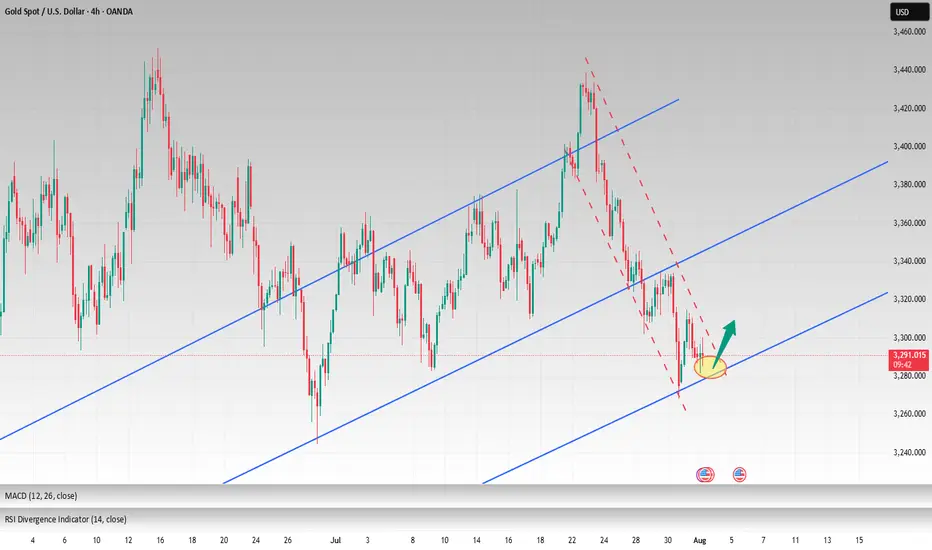
A comeback trendI think the downward trend will continue.
As you can see on the chart, if there is no news, the trend continues in a channel.
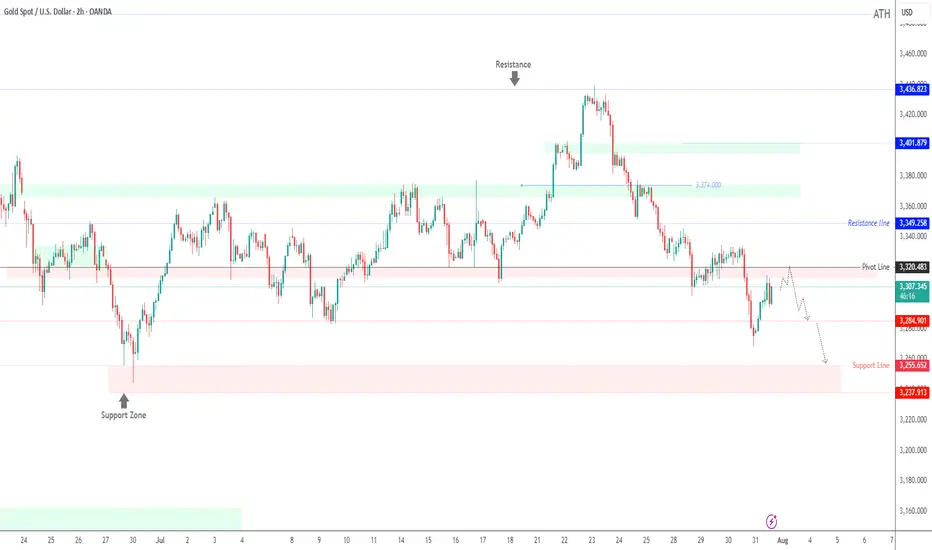
Gold Slips After Powell Speech Below 3320 Bearish Pressure BuildGOLD Overview
Market Context:
Gold declined from the 3333 level, as anticipated in yesterday’s analysis, ahead of Fed Chair Powell’s speech. Powell reiterated that it is still too early for rate cuts, citing persistently high inflation, which supported the U.S. dollar and pressured gold.
Technical Outlook:
As long as gold trades below the 3320–3310 zone, the bearish momentum is expected to continue, with the next target at 3285. A confirmed break and stability below 3285 could open the way toward 3255.
To regain bullish traction, the price must stabilize above 3320.
Support Levels: 3285 • 3255
Resistance Levels: 3333 • 3349
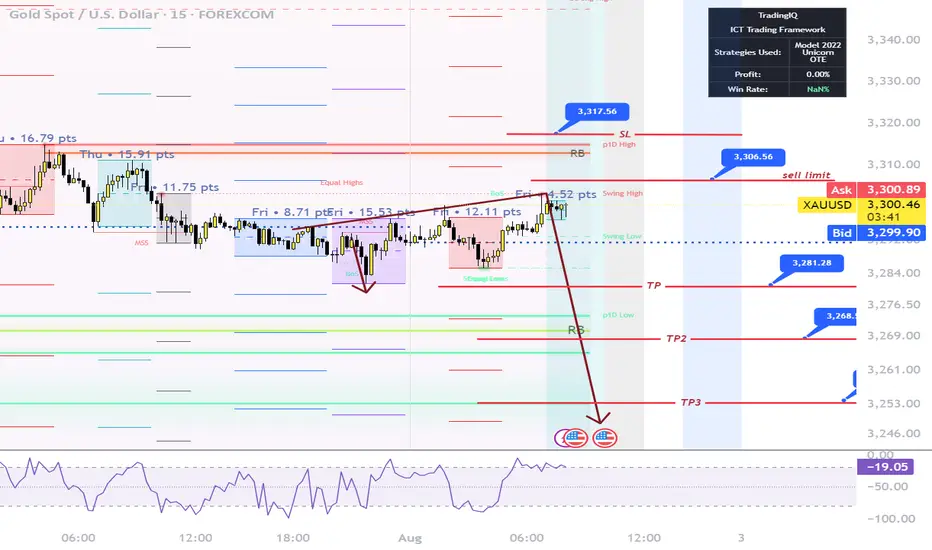
XAUUSD – Smart Money Sell Setup during New York Session | ICT St
Gold (XAUUSD) has just completed a classic liquidity grab above the London session highs, forming a potential Judas Swing as New York begins.
On the 4H timeframe, we clearly have a bearish BOS (Break of Structure), and price has returned to a Premium zone within a bearish FVG and OB (Order Block).
Today is NFP Friday, and after the Fed kept rates steady mid-week, we’re expecting high volatility.
Current price action has swept the overnight liquidity and is now reacting inside a Repricing Block, aligning perfectly with the NY Midnight Open level.
🎯 My Sell Plan (Live Execution):
Sell Limit: 3306.50
SL: 3317.50 (Above OB high)
TP1: 3281.20
TP2: 3268.50
TP3: 3253.90
🧠 Bias: Bearish
🕒 Session: New York
🧮 ADR: 43 pts
📉 Market Structure: Bearish
This setup follows the ICT methodology using time, liquidity, structure, and displacement.
If we break above 3317.50 with strong displacement, the idea becomes invalid.
Let's see if Smart Money takes it down into Friday’s close.
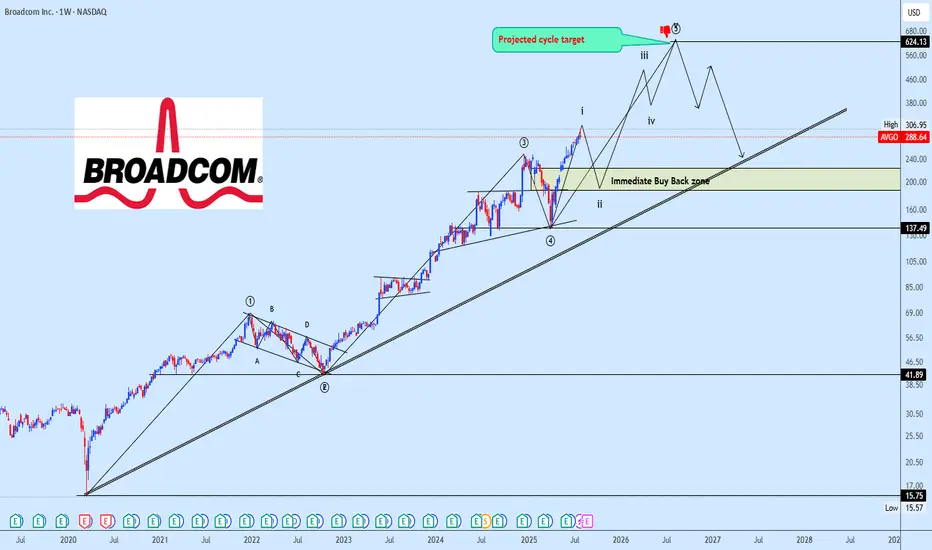
AVGO Bullish Impulse Wave Structure in ProgressAVGO continues its macro advance with a clear 5-wave impulse structure unfolding. The current price action marks the completion of subwave (i) of wave ⑤, setting the stage for a corrective pullback into subwave (ii).
We expect this corrective leg to reach into the 38.2%–50% Fibonacci retracement zone of subwave (i), which will serve as a potential re-accumulation area before the next bullish expansion.
The strategy remains to monitor the development of wave (ii) closely, waiting for key price reaction around the identified retracement zone to build positions in anticipation of subwave (iii) of ⑤ typically the strongest and most impulsive move in Elliott Wave structure.
Targets are shared on the chart for clarity. Patience here is key as we await the right entry zone aligned with technical confluence.
📌 Drop your stock requests in the comment section for quick chart updates — only equity-based assets will be accepted under this post.
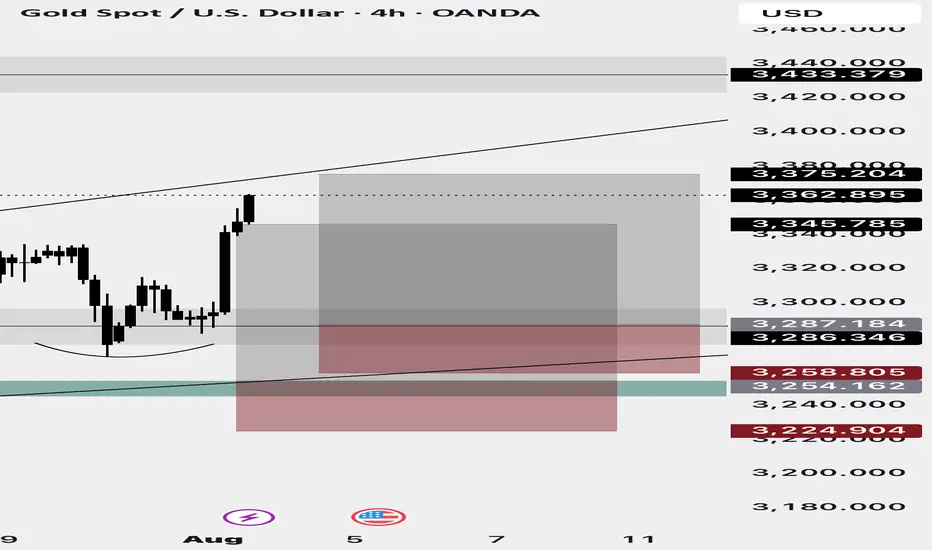
XAUUSD TRADE UPDATE MISSED TRADE Hey everyone here’s a trade recap of the week at first we were interested to take buys at 3254 zone as first entry and scale in at 3287 zone but price pulled down slightly missed the first entry and I didn’t execute & the second entry didn’t execute that too and market skyrocket if price activated the first entry we would’ve caught a huge trade today,the first one didn’t activated so I didn’t execute the second entry which is the 3287 zone that buyers came in so we move on and I will keep on sharing potential good setups and have a beautiful weekend guys….
New targets for Reddit RDDT In this video I recap the previous reddit analysis where we looked for the long which is playing out really well .
I also look at the current price action and simulate what I think could be a target for the stock moving forward using Fib expansion tools as well as levels below for price to draw back too.
Welcome any questions below the chart . Thanks for viewing
