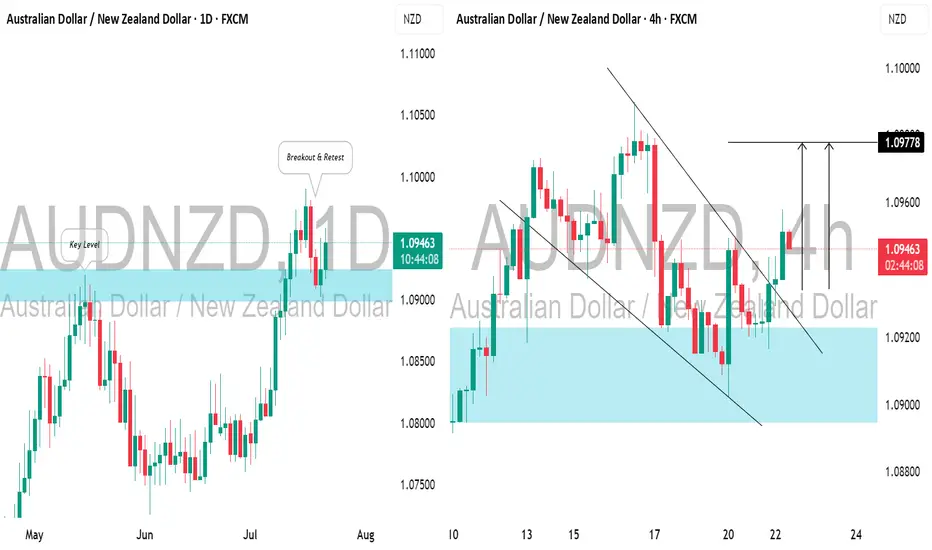
AUDNZD: Bullish Move After Breakout📈AUDNZD has surpassed and closed above a key horizontal daily resistance level.
After retesting this broken structure, the price rebounded and broke above a resistance line of a falling wedge pattern, suggesting a strong likelihood of a bullish trend resumption.
The price is expected to reach the 1.0977 level soon.
Trend Lines
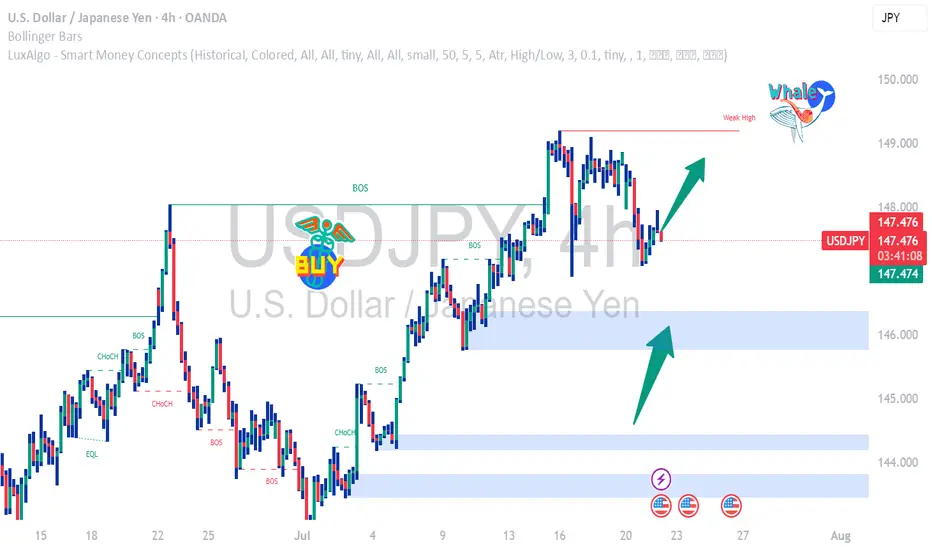
USDJPY Falling Fast Bearish Momentum or Reversal Zone?USDJPY has dropped significantly and is now trading around 147.730, nearing a key historical support zone near 147.20 – 147.00.
This area previously acted as a strong demand zone and may trigger a bounce or a breakdown depending on market sentiment.
🔹 Technical Overview (4H Chart):
• Current Price: 147.73
• Support Zone: 147.20 – 147.00
• Resistance: 149.00
• Breakdown Target: 145.80
• Possible Bounce Target: 148.80 – 149.30
📊 Bias:
I'm watching this zone closely.
• If price holds above 147.00 with bullish candle – Long Setup toward 149.00
• If price breaks below 147.00 and closes on 4H – Short Setup toward 145.80
⚠️ Use tight SL below support zone if buying.
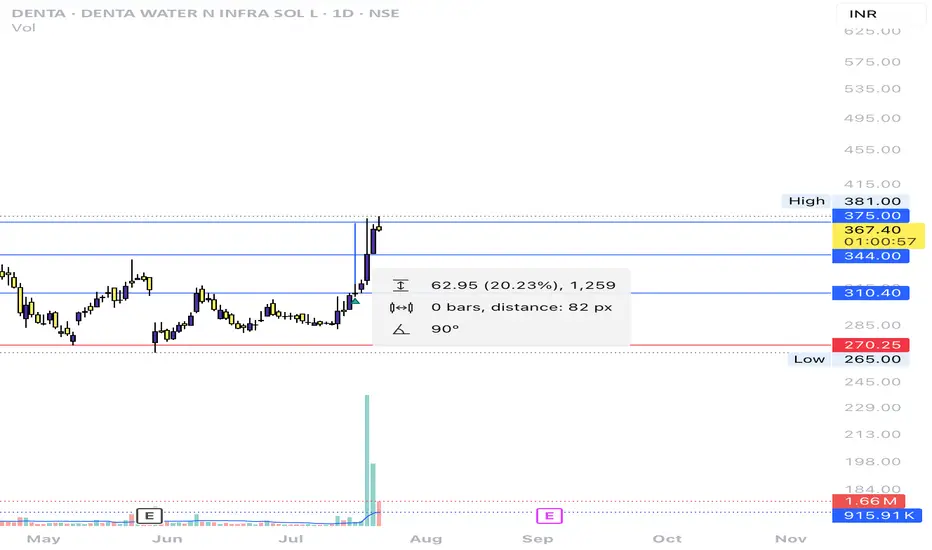
Denta Water & Infra Solutions Ltd <>Returns Chart shared on July 16th has already yielded a 20%+ return. Analysis suggests the stock should consolidate at its current high level after the recent steep rise, followed by a potential breakout.
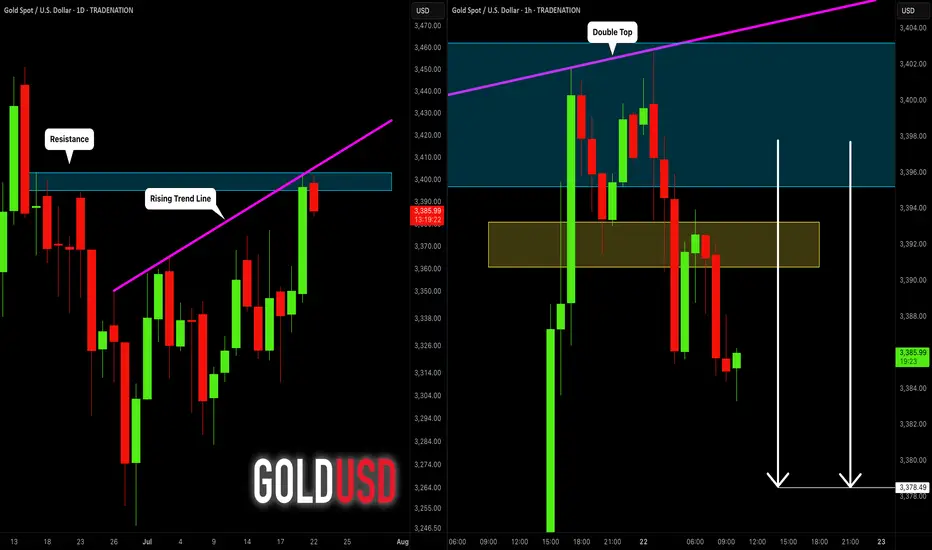
GOLD (XAUUSD): Bearish Move From Resistance Confirmed
Gold tested a significant confluence cluster on a daily time frame
that is based on a rising trend line and a horizontal resistance.
A double top formation on that on an hourly time frame indicates
a highly probable retracement from that.
Goal - 3378.5
❤️Please, support my work with like, thank you!❤️
I am part of Trade Nation's Influencer program and receive a monthly fee for using their TradingView charts in my analysis.
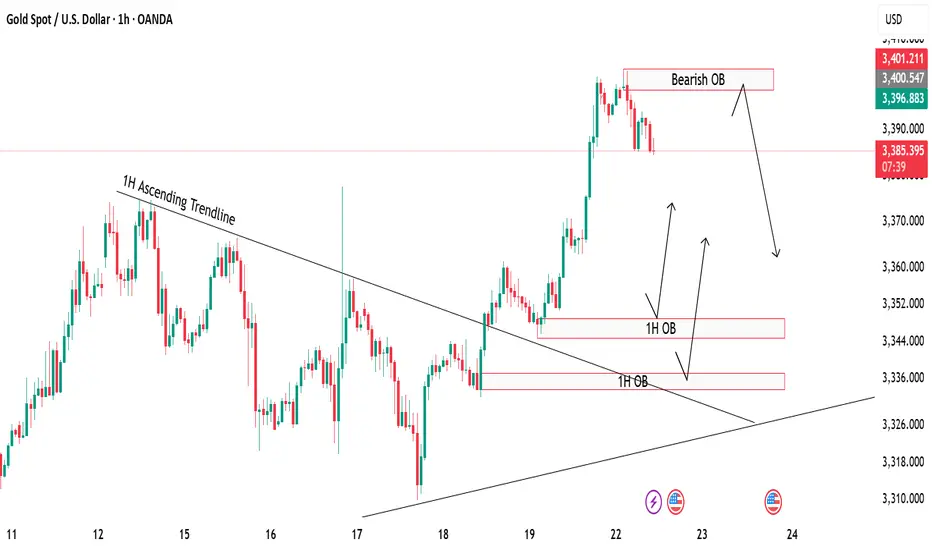
Gold Rejection & Retest Zones AnalysisGold has recently broken out of the 1H ascending trendline with a strong bullish push 🚀. After this breakout, we are now watching key supply and demand zones for the next move.
🔴 Bearish OB (3398-3404):
Price is currently hovering around the bearish order block, which could trigger some short-term rejection or pullback from this zone.
🟢 Bullish OB Zones (3350 & 3330):
If gold decides to correct lower, we have two important bullish OBs below, perfectly lining up with the previous trendline retest ✅. These zones can offer high-probability buy setups if price respects them.
🎯 Focus is on watching for possible rejections from the top OB, or waiting for a deeper retracement towards the bullish zones for buy confirmations
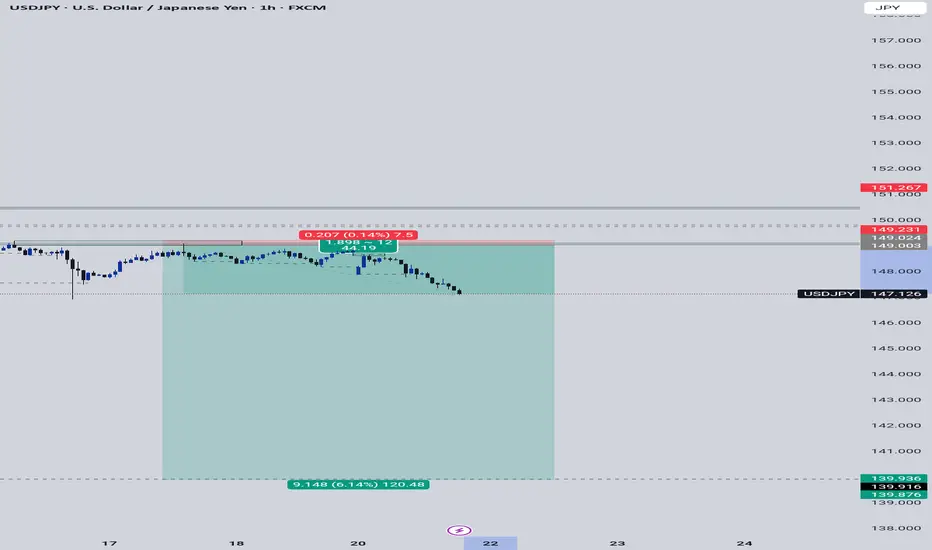
USDJPY InsightHello to all our subscribers!
Please feel free to share your personal opinions in the comments. Don’t forget to hit the boost and subscribe buttons!
Key Points
- There were speculations that the Liberal Democratic Party’s election defeat in Japan could lead to Prime Minister Ishiba’s resignation. However, Ishiba announced that he will remain in office, easing concerns and reducing political risk.
- U.S. Treasury Secretary Scott Bessent stated that negotiations are progressing swiftly but emphasized there is no rush to reach a deal. Meanwhile, U.S. Commerce Secretary Howard Lutnick commented that reciprocal tariffs will proceed as scheduled, although negotiations can still continue.
- With the FOMC meeting scheduled for July 31, attention is focused on Fed Chair Powell’s speech on July 22, which is expected to provide clues about the future path of monetary policy.
Key Economic Events This Week
+ July 22: Fed Chair Powell’s speech
+ July 24: ECB interest rate decision
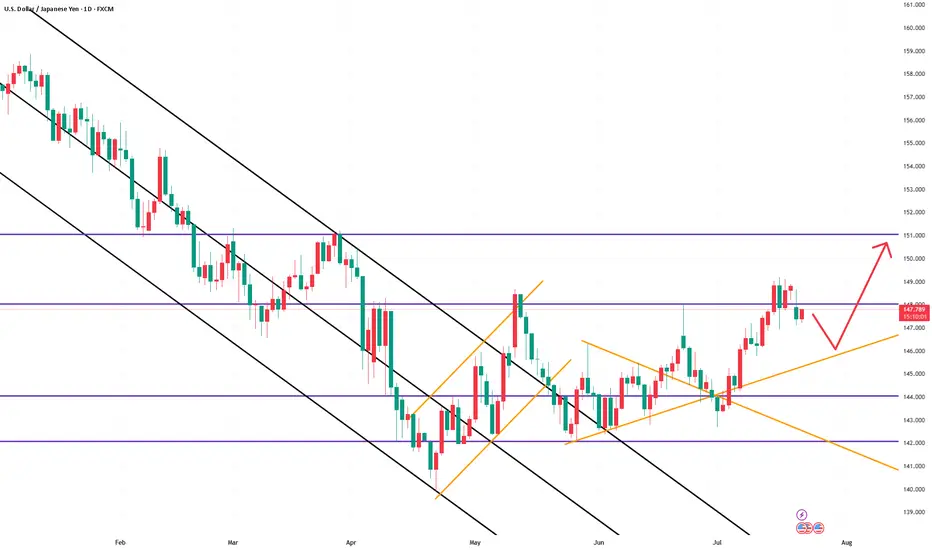
USDJPY Chart Analysis
After breaking above the 148 level and extending gains to the 149 level, the pair quickly reversed and pulled back to the 147 level. Currently, a further decline toward the 146 level appears likely, with strong support expected there. If confirmed, a rebound toward the 151 level is highly probable. However, if price action deviates from expectations, we will promptly revise our strategy.
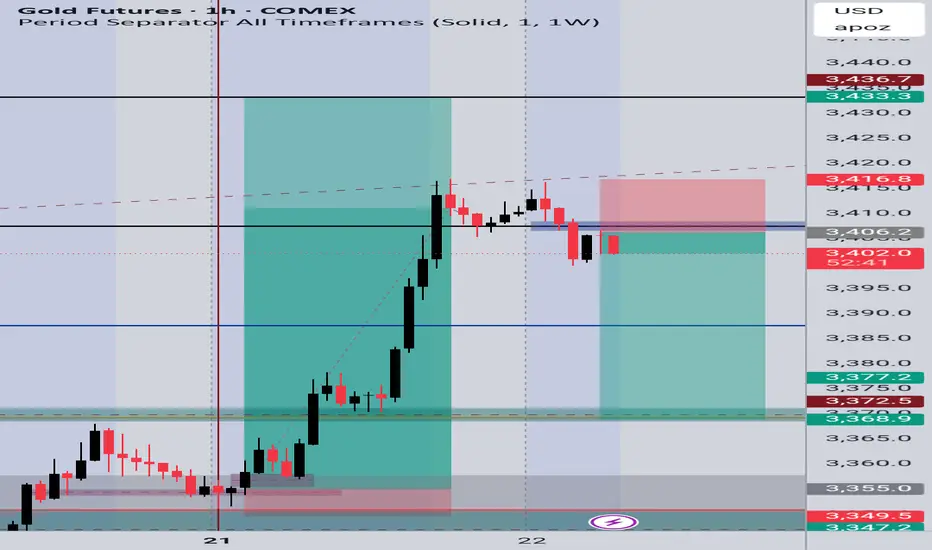
Gold Futures (GC1!)Gold Futures (GC1!) 1H – Bearish Rejection Setup
Price showed a strong bullish impulse followed by a rejection near the 3,416 resistance zone, forming a lower high and signaling potential exhaustion of buyers. After grabbing liquidity above the previous high, it failed to hold above the zone and retraced back below a key structure level around 3,406.
This setup aligns with a classic breakout and retest, now acting as resistance. I entered a short position after confirmation of bearish price action, targeting the demand zone around 3,372–3,368. Stop loss is placed just above the high at 3,416.8.
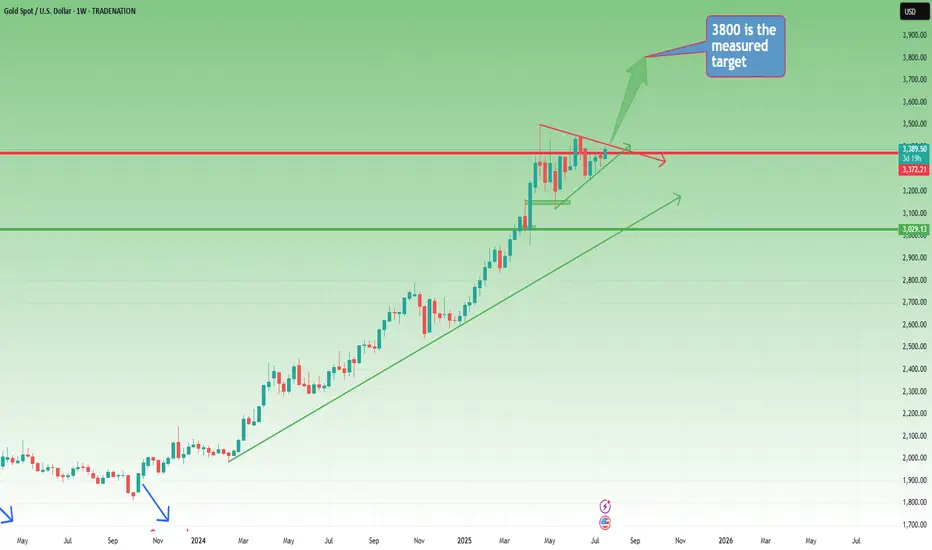
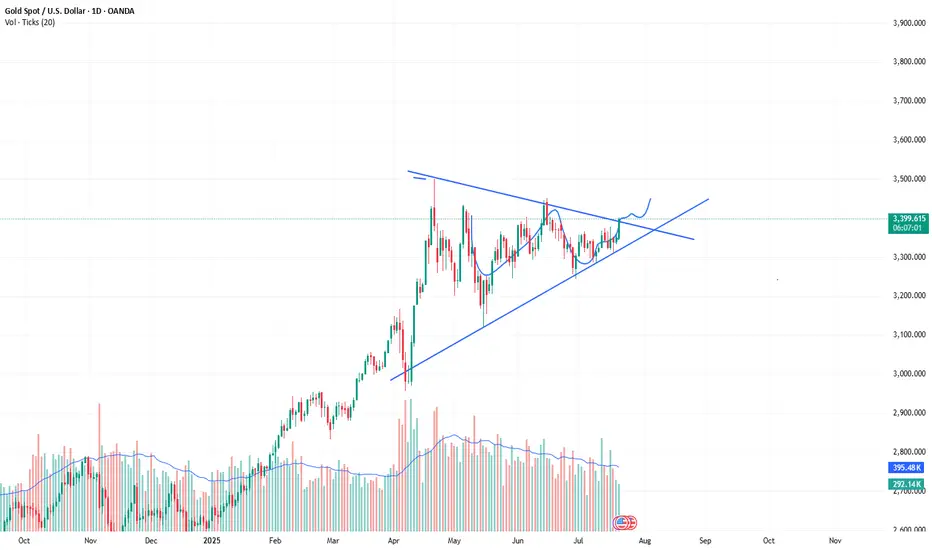
Weekly Outlook: Gold Builds Pressure – Is the Big Move Coming?📆 Big Picture View
Since the start of 2024, Gold has been moving in a well-defined long-term bullish trend.
Yes, there were meaningful pullbacks along the way — but the direction was never in doubt. Step by step, Gold climbed over 15,000 pips in just over a year, reaching a new all-time high in late April.
📉 Post-ATH: A Period of Stabilization
After peaking, Gold shifted into consolidation mode, with price gravitating around the 3300 zone.
This sideways movement has been ongoing for the past three months, but it’s not a sign of weakness — it’s the market catching its breath.
On the weekly chart, this consolidation is now forming a symmetrical triangle, a classic continuation pattern that often appears mid-trend.
📐 The Technical Setup
- The symmetrical triangle shows compression of volatility
- Buyers and sellers are slowly converging toward a decision point
- A breakout is approaching, and when it comes, it could be explosive
🎯 What’s the Trigger?
- A confirmed break above 3450 would validate the triangle breakout
- That opens the door to quickly test the 3500 round figure
- The measured target for the triangle sits at 3800
Given the time Gold has spent consolidating (3+ months), this target could realistically be reached by year’s end
🧭 Strategic Takeaway
- As long as Gold holds above 3300, the bullish structure remains valid
- Breakout above 3450 is the green light for the next leg up
- Until then, the consolidation continues, and smart money prepares
📌 Conclusion:
Gold is building pressure. The weekly triangle is maturing.
This isn’t the end — it’s the pause before the next move.
Stay patient. Stay focused.
Because if 3450 breaks… 3800 is not a dream — it’s a destination. 🚀
Disclosure: I am part of TradeNation's Influencer program and receive a monthly fee for using their TradingView charts in my analyses and educational articles.
P.S: Here you have a short term analysis on Gold
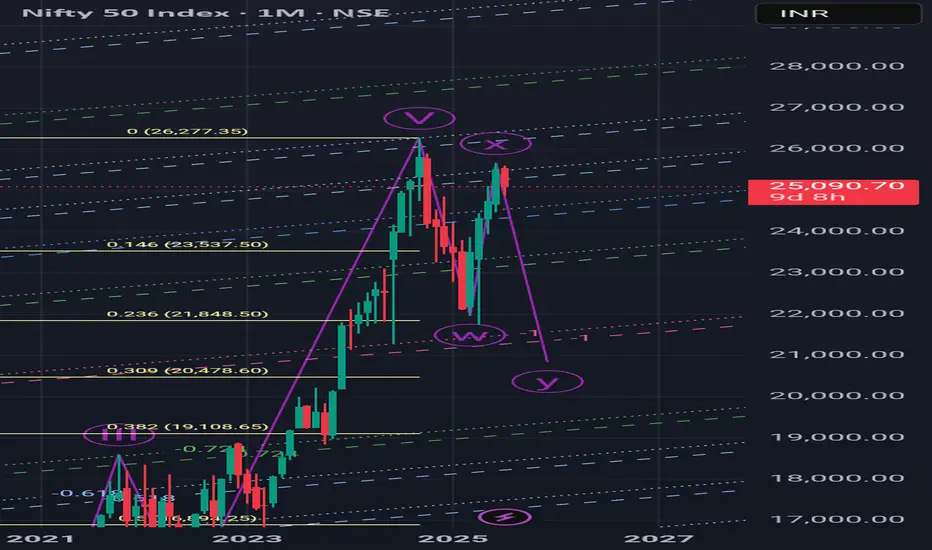
Nifty 20500 or 19200?Last time, I was correct when I foresaw and gave an update on the Nifty's latest peak of 25650 the day before it happened, along with the beginning of a potential downward trend. Now, if the Nifty can break below 24500, there's a good chance we'll drop below the previous low of 21700 and reach at least 20500 or even lower, at 19200, by February 2026.
Gold Bullishgold has made a good 500 pip climb yesterday.
and we will expect a good retracement and also a good opportunity for us to continue its trend in certain position.
my bias is bullish however this retracement can be huge as well. so careful entries is advisable.

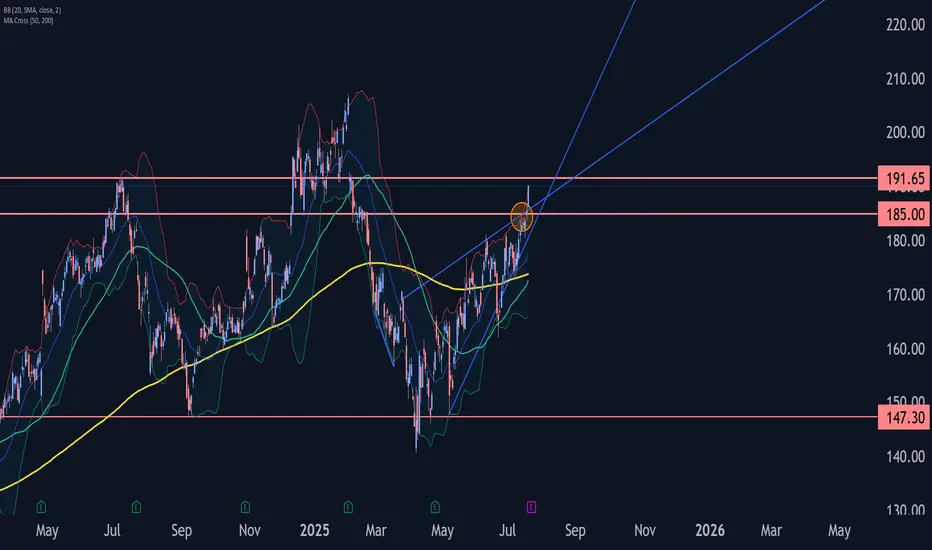
Google Wave Analysis – 21 July 2025
- Google broke resistance zone
- Likely to rise to resistance 191.65
Google recently broke the resistance zone between the resistance level 185.00 and the upper trendline of the daily Rising Wedge from the start of May.
The breakout of this resistance zone accelerated the active impulse wave C of the intermediate ABC correction (2) from the start of April.
Given the clear daily uptrend, Google can be expected to rise further to the next resistance 191.65 (target price for the completion of the active impulse wave C).
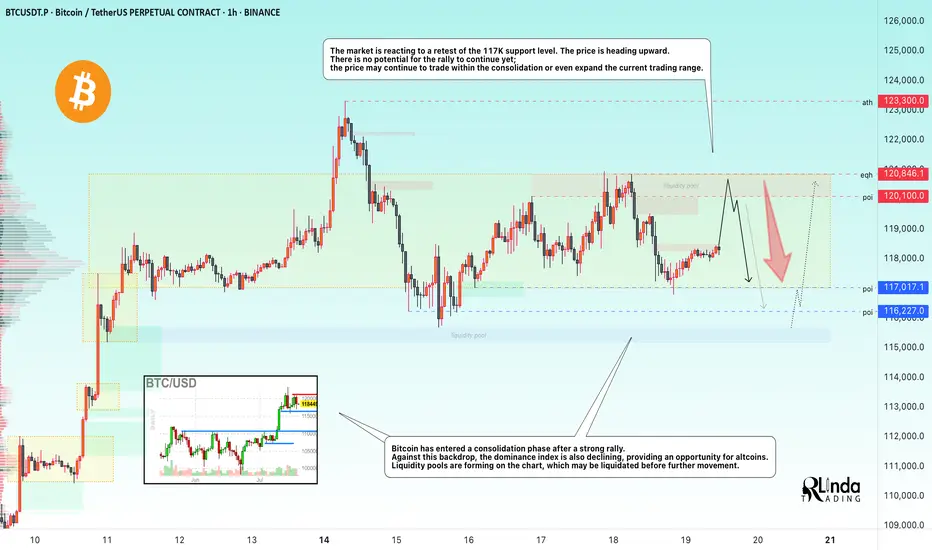
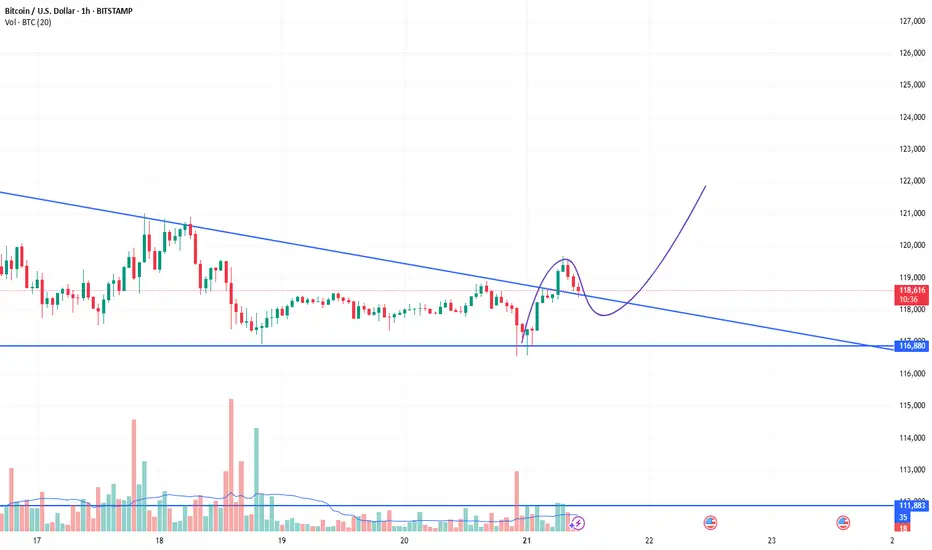
BITCOIN → Consolidation, retest of 120K. Correction of dominanceBINANCE:BTCUSDT , after a rapid rally and touching 123K, rolled back and entered consolidation, giving altcoins a chance. At the same time, Trump signed new crypto laws, but will these laws open new doors?
On June 18, the GENIUS Act was signed. Information can be found in the sources, but there is no direct reference to BINANCE:BTCUSDT.P , except perhaps indirectly: increased confidence in the crypto market, increased liquidity, possible new rules, and pressure on decentralized assets. Bitcoin has not always grown on positive news; more often it has been a deep pullback and liquidation before the momentum.
Technically, Bitcoin is currently consolidating, and I would highlight several key areas: the upper range is 120K-120.9K. The zone between these levels is particularly important, as this is where buyers were previously liquidated and sellers gathered (liquidation is possible).
The bottom is 117K (confirmed) - 116.2K. There is a liquidity pool on the support side.
additional scenario if the market does not reach resistance and decides to form a long squeeze before growth
Theoretically, I am not yet expecting a breakout and growth of Bitcoin. I think that consolidation may continue for some time, especially against the backdrop of a pullback in altcoins and a deep correction in the dominance index.
Resistance levels: 120100, 120850
Support levels: 117000, 116230
Since the opening of the session, the price has been working off the liquidity capture from 117K. There is a reaction - growth, which could bring the price to the zone of interest at 120K. But the question is: will the price hold in the 120K zone? A false breakout of resistance could trigger a correction to 117-116K. Thus, I expect the market to remain in consolidation for some time or even expand the current trading range...
Best regards, R. Linda!
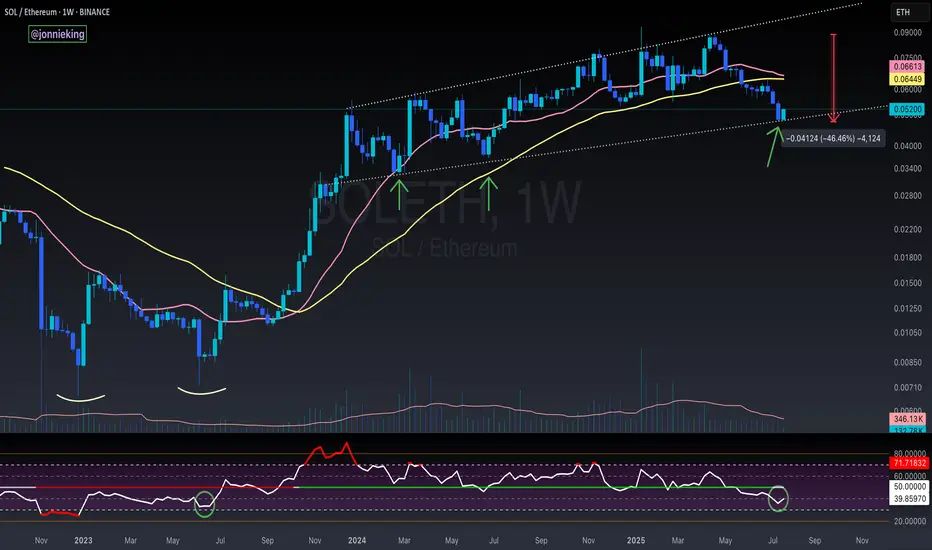
SOL / ETH - Reversal Signs FormingI suspect CRYPTOCAP:ETH has a bit more gas in the tank, but the early signs for the real Alt Season are nearing.
RSI on the weekly is nearing the June 2023 bottom which kicked off the massive bull flag formed on SOL / ETH for the next 2 years.
Still too early to call at this point tho.
Need volume to really burst through in the next week or two.
I’d also like to see BOATS:SOL close the week with a massive bullish engulfing candle.
The bearish cross on the 20 / 50WMA should mark the bottom when it occurs soon.
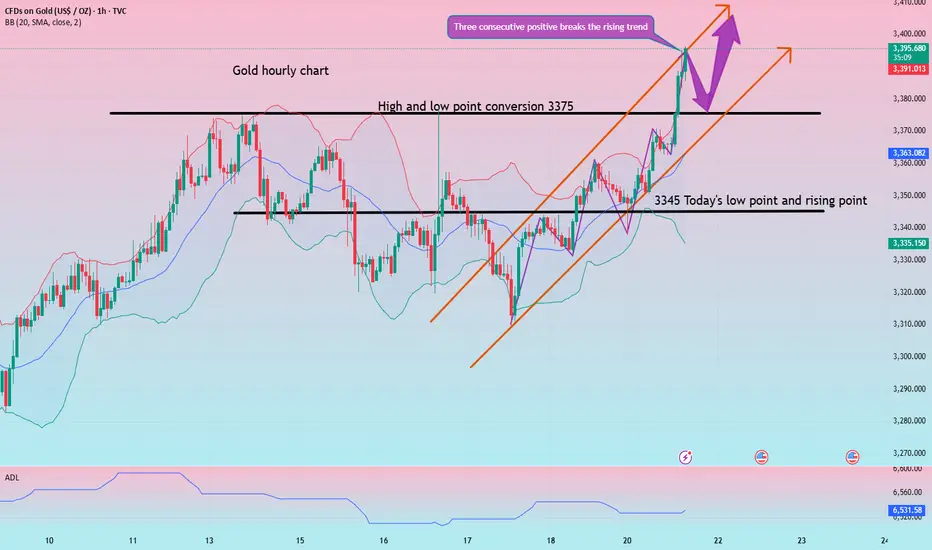
Gold rises continuously and then moves unilaterally? 3375 is the
At the beginning of this week, international gold prices rose, benefiting from the weaker dollar, while investors paid attention to news on trade progress before the US tariff deadline on August 1. As US inflation data was lower than expected and the market may have some defensive bets against tariffs, gold finally rebounded from the main upward trend line again. The lower-than-expected US inflation data did not trigger the market to re-price more hawkish rate hike expectations.
From a larger perspective, as the Fed's easing policy progresses, real yields may continue to fall, and gold should maintain an upward trend.
Views on today's trend!
Today, gold is rising slowly, and basically there is no chance of a correction, so it also led to our opening directly chasing a wave of gains, and the market has actually had some risks after the rebound to above 3370. After all, the 3373-75 line was a dense pressure area before.
From the current hourly chart, gold has been moving along the upper track of the moving average and has accelerated since breaking through the 3375 line. It is possible that it will test the 3410 line today. After all, it is already at the 3395 line, and today's strength and weakness watershed has actually shifted from 3340 to 3375. After all, the top and bottom conversions are raised synchronously!
Gold: Long around 3375, defend 3365, and target 3395-3405!
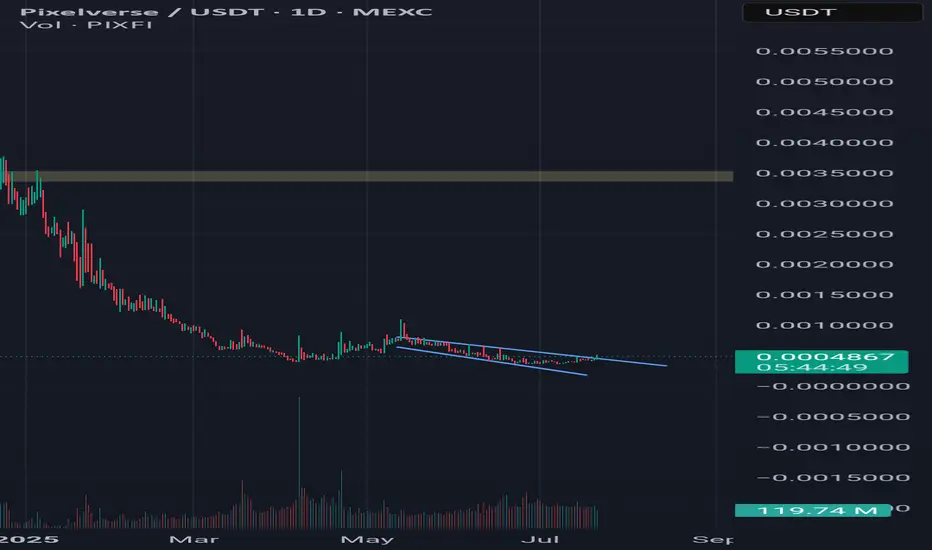
Pixel is longHello, today I will update you with the pixel analysis. I hope you enjoy it. This is a branch analysis. Be careful. If a daily candle closes above 0.0004848, we will go for a target close to 10x. Don't miss the opportunity. 0.0035 is just a few steps away.😉Be profitable.Please give me energy with your comments and likes and express your opinion.🇮🇷
Accurate prediction, continue to buy after retracement to 3353📰 News information:
1. The Trump administration puts pressure on the Federal Reserve to cut interest rates
2. The continued impact of tariffs and the responses of various countries
📈 Technical Analysis:
Gold is currently rising rapidly, reaching a high near 3368, and the overall bullish trend has not changed yet. It is not recommended to continue chasing the highs at present. Those who are long at 3345 can consider exiting the market with profits. The technical indicators are close to the overbought area and there is a certain risk of a correction. Be patient and wait for the pullback to provide an opportunity. At the same time, 3353 has become the position with relatively large trading volume at present, and the top and bottom conversion in the short term provides certain support for gold longs. If it retreats to 3355-3345, you can consider going long again, with the target at 3375-3385. If it falls below 3345, look to 3333, a second trading opportunity within the day. If it falls below again, it means that the market has changed, and you can no longer easily chase long positions.
🎯 Trading Points:
BUY 3355-3345
TP 3375-3385
In addition to investment, life also includes poetry, distant places, and Allen. Facing the market is actually facing yourself, correcting your shortcomings, facing your mistakes, and exercising strict self-discipline. I share free trading strategies and analysis ideas every day for reference by brothers. I hope my analysis can help you.
FXOPEN:XAUUSD OANDA:XAUUSD FX:XAUUSD FOREXCOM:XAUUSD PEPPERSTONE:XAUUSD TVC:GOLD

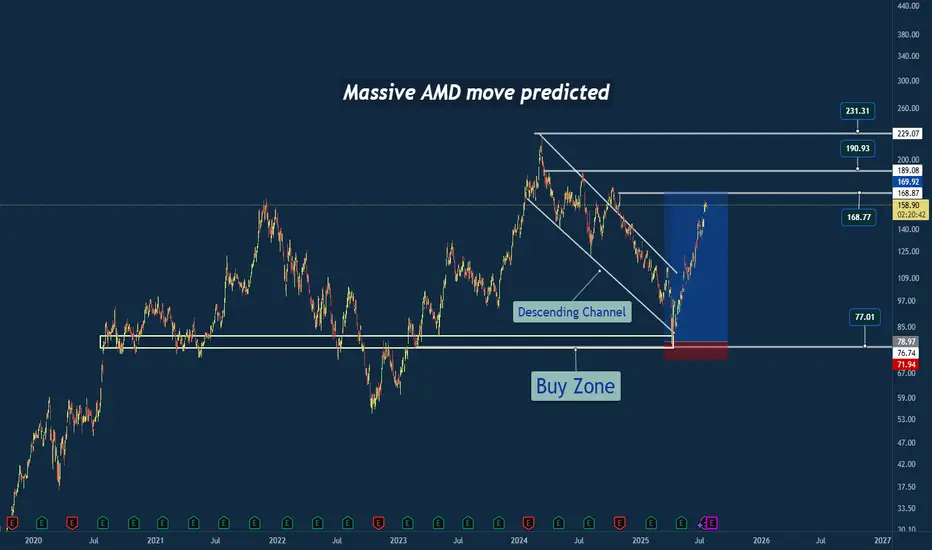
Why I Went Long on AMD Near the 2025 Lows🔍 Reason for the Trade
This wasn’t just a “buy the dip” setup — this was a calculated trade based on strong confluence:
✅ Multi-Year Demand Zone
Price returned to a massive support level that’s held since 2020. This zone had previously triggered multiple large bullish reversals.
✅ Falling Wedge Breakout
A textbook falling wedge pattern formed during the pullback. Once price broke out, the momentum confirmed a structural reversal.
✅ Risk/Reward Optimization
I positioned my stop just under key support, with targets set at prior structure highs. The setup offered a clean 2.5:1+ R/R ratio, perfect for swing conviction.
✅ Institutional Accumulation Area
The volume and wick rejections in this zone screamed smart money stepping in. It was a classic sign of fear-based selling into patient buyers.
🧠 Lessons Reinforced
- Wait for the Zone, Then Act: Patience paid off — the best trades come from the best levels.
- Structure Over Emotion: I trusted the technical, not the bearish headlines.
- R/R Always Wins: You don’t need to be right every time, but when you’re right — let it run.
#AMD #SwingTrade #TechnicalAnalysis #SupportAndResistance #WedgeBreakout #RiskReward #PriceAction #StockMarket #TradingView #TradeRecap
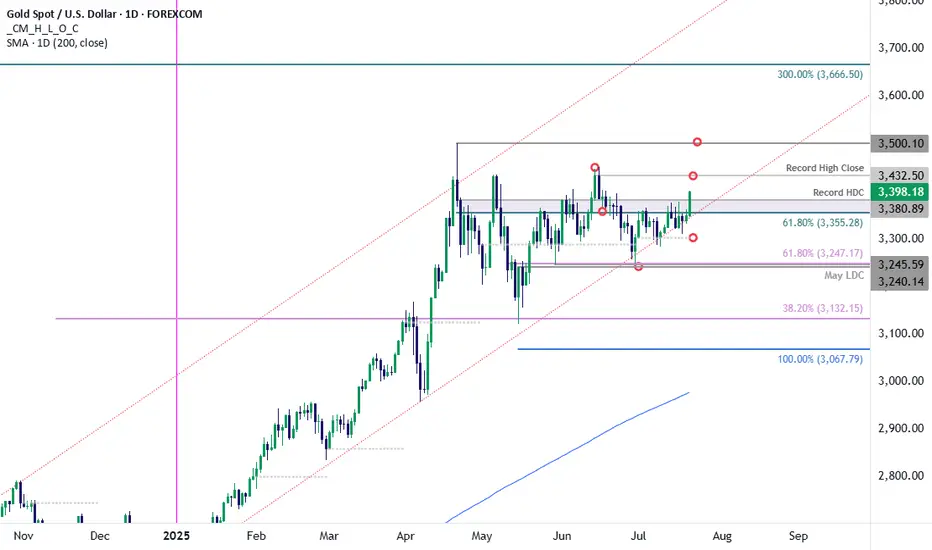
Gold Bull Charge- XAU/USD Clears July Opening-RangeGold is attempting to breach resistance today at the 61.8% retracement of the April decline / record high-day close (HDC) at 3355/80- watch the close.
The advance marks a breakout of the July opening-range and a topside breach here exposes the record high-close at 3432 and the record highs at 3500.
Initial support now back at 3355 with bullish invalidation steady at the objective monthly open at 3303.
-MB
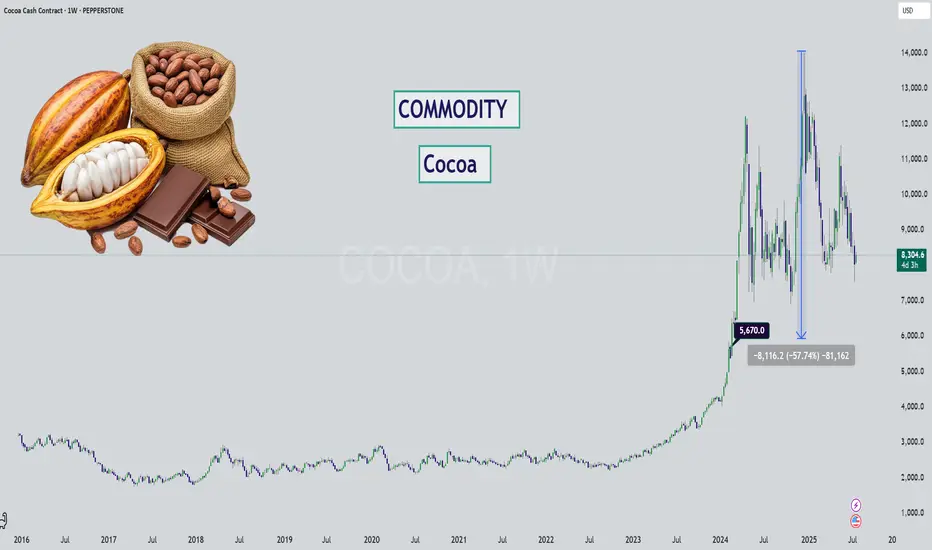
Cocoa - Chocolate is DIPPING (literally)Hello Market Watchers 👀
I bring today an update on your favorite commodity (mine actually)... 🍫
The weekly timeframe from a multi-year perspective is what's on the cover and one thing is clear - cocoa has never increased so much as it during May23' to Dec24'.
Sure inflation brought on by covid has a role to play. But even so, factoring in the amount of +509%? That is way out.
We could likely see this kind of stair step down movement on cocoa, since it has been following the logic of: " previous support = new resistance ".
Either way what this tells me is that cocoa has been running overly hot for too long... and it's time for a cooldown. Prices will likely never return to pre-covid levels, unless there is unfortunate weather or other supply chain issues.
Ultimately, a return back to the $5,600 zone would be a reasonable market correction for such a large increase.
BTCUSDBTCUSD also fell from a high level, reaching a high of around 119700, only 300 points away from the target of 120k. The price after the decline is now around 118600. Buying at a low level is the main focus. The reference buying point is 118500-118000. The target is above 120k. Stop loss 117300
XAUUSD:The next target is 3430.The market is developing completely in accordance with the expectations of the band trading center. Today is a day of sharp rise. As Monday, this increase is quite considerable.
The three reminders to buy are all at a lower position. The post clearly points out that the market has reached 3400. 3400 is a controversial position. It needs to fluctuate in the New York market, and then there will be some breakthroughs. If it is stronger, it will directly break through the New York market. In the short term, you can pay a little attention to the retracement position of 3390-3395. Then continue to buy. The next target is 3430.
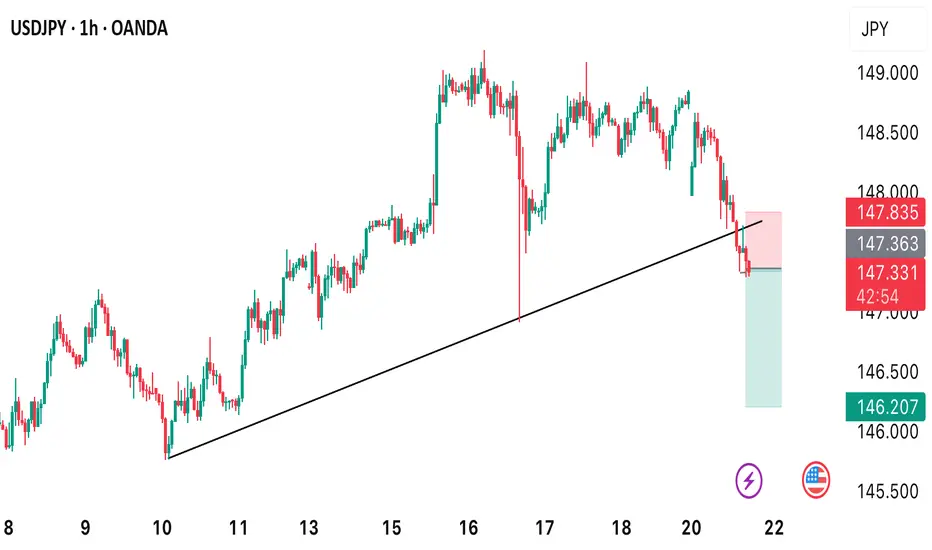
USDJPY BREAKOUT IN H1 Price just broke out of the trendline that was formerly serving as support. A sell opportunity is envisaged from the current market price. Target profit is at 146.207