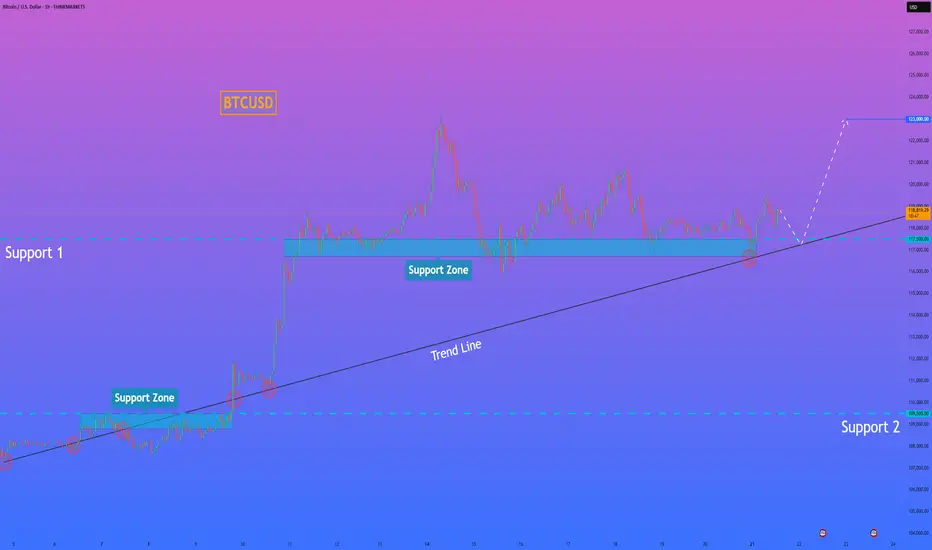
HelenP. I Bitcoin will rebound from trend line and rise to $123KHi folks today I'm prepared for you Bitcoin analytics. If we look at the chart, we can see a very clear and long-term bullish structure. The entire uptrend is supported by a major ascending trend line that has acted as a reliable foundation for the price for a significant amount of time. Currently, the price is consolidating above this crucial trend line and is interacting with the key support zone between 117500 and 116700 points. I believe that the most probable scenario here is a brief corrective move downwards for the price to properly retest the main ascending trend line. This type of retest is often a healthy sign in a strong trend, as it allows for the confirmation of support and gathers momentum for the next leg up. A strong rebound from this trend line would serve as a powerful signal that the buyers are still in control. Therefore, once the price confirms its bounce from this dynamic support, the path should be clear for a continuation of the uptrend. For this reason, my primary goal for this trade idea is set at the 123000 points. If you like my analytics you may support me with your like/comment ❤️
Disclaimer: As part of ThinkMarkets’ Influencer Program, I am sponsored to share and publish their charts in my analysis.
Trend Lines
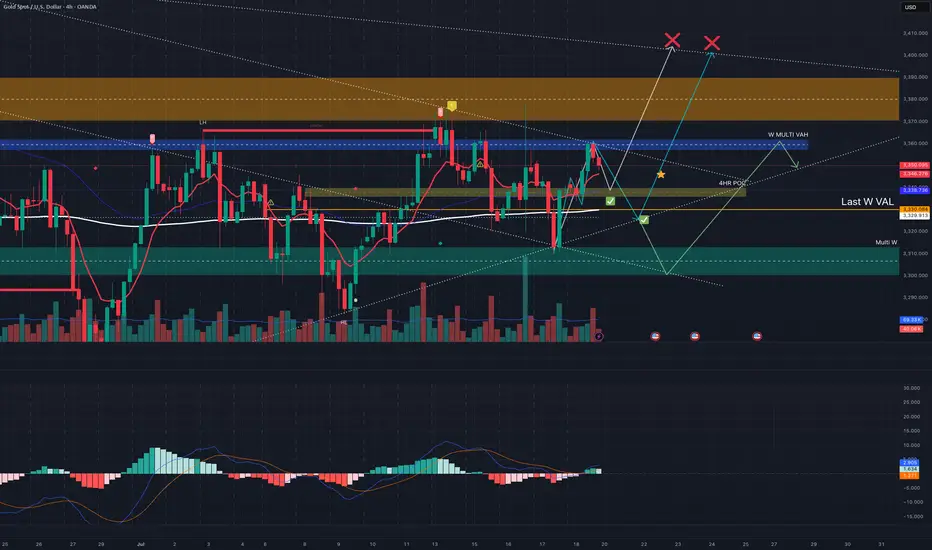
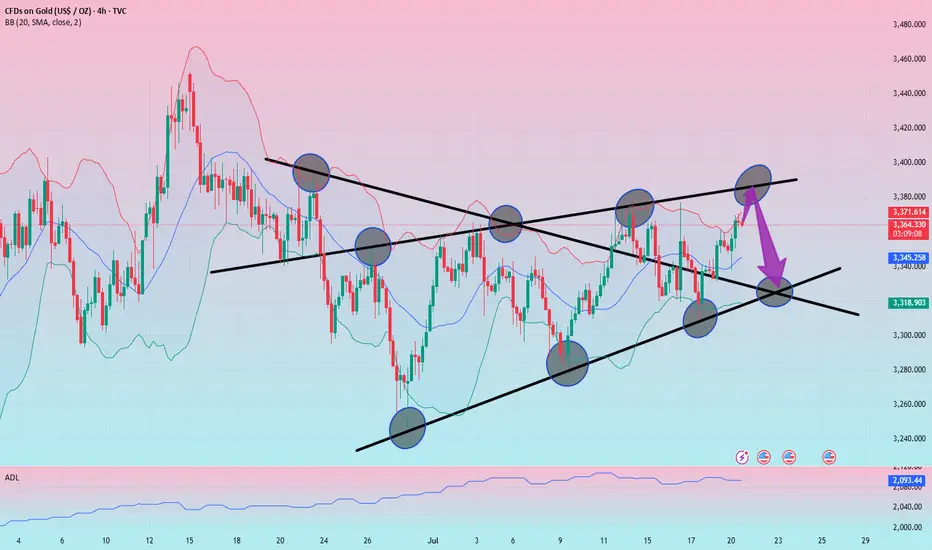
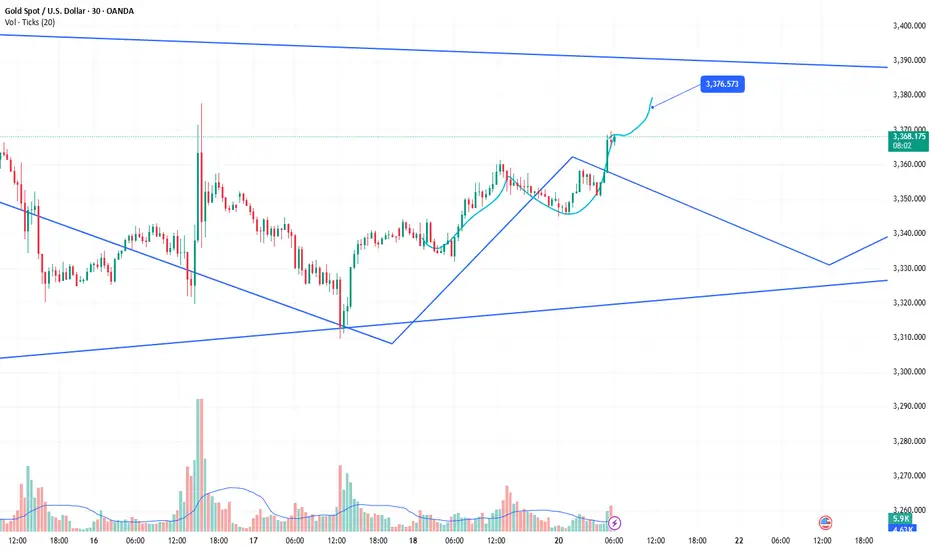
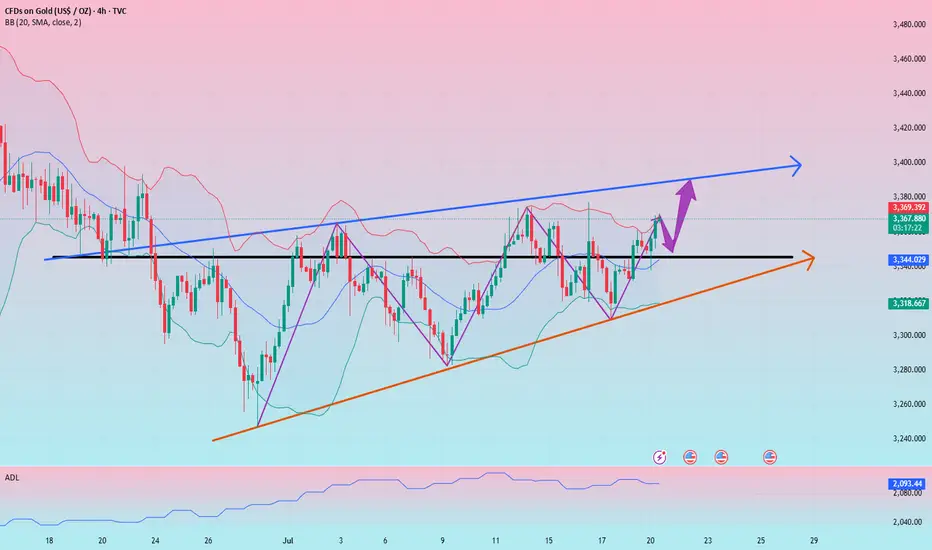
Trend breakout towards master(ATH) trend line Purely from a trend line POV and HTF (M, W,D) POCs, which have been tested multiple times confirming their validity, best case scenario is a retest of the upper trend line that originates from the all time high.
The lower trend line has been tested and defended @ 3311. The continuation of this leg has faced initial resistance from a level @3360 where price closed below decisively after news event.
Favourite scenario is a pull back to last weeks VAL where the weekly candle closed above signalling buyers were keen on such level @3300, clear support formed to confirm validity of the level and upside target to 3400
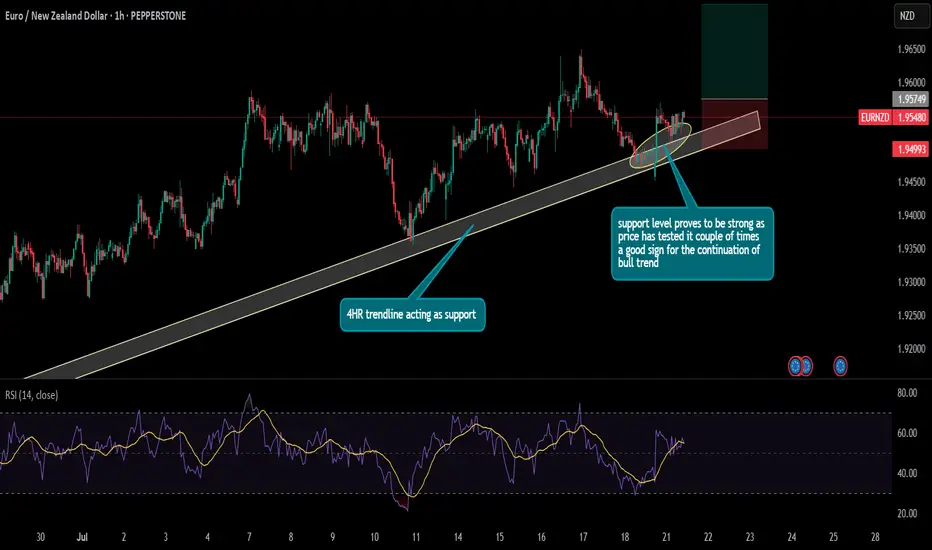
EURNZD continues to be in bullish trend as shown in the chart, the 4-hour tf trendline is acting as a strong support level since the price has tested it multiple times to continue the bullish trend therefore a buy trade idea has been given on the chart according to the price action
Gold is about to approach the top suppression position, so be ca
Today, Monday, gold continued its upward trend from last Friday, and the highest so far is around 3370.
Last Thursday, it once reached a low of 3309, and then rebounded sharply, entering the upper suppression area again.
First of all, from the current perspective of the US dollar:
The US dollar is currently in a retracement, and the rise of gold is understandable.
The US dollar has not yet stepped back to the right level, at least it has to step back to around 98.0.
And it has to stabilize at the support near 98.0, so the US dollar may stretch again in the future.
Once it stretches from 98.0 again, the highest can reach above 99.0.
If the US dollar can stabilize above 98.0, then gold should also reach its peak by then.
To be honest, gold is still a little short of the mark at the moment.
3370 is not the top position. It would be best if it could reach a new high, break through around 3380, and then come down again, then the top can be determined.
From the current 4-hour gold chart, we can also see that the top suppression position has not been touched.
Therefore, we still cannot act rashly and cannot chase too much.
It is best to wait for the US market to reach around 3380 to form a top structure.
Combined with the situation of the US dollar, short gold, if gold falls again, at least go back to test 3330-40.
If the US dollar is stronger and can stand above 99.0, it is also possible for gold to directly fall below the 4-hour chart trend line support.
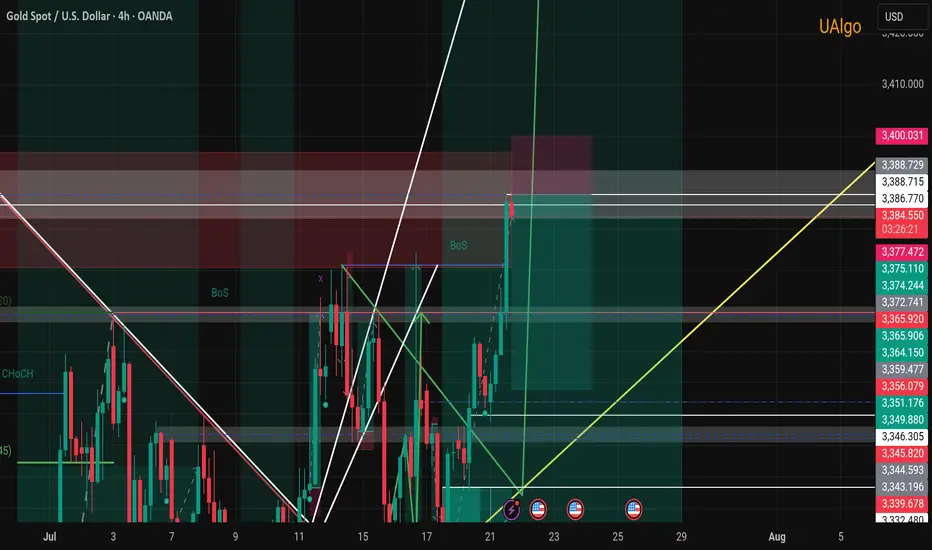
XAUUSD Trade Idea - 30m Structure with 4H ConfluenceCurrently, price is trading below the 4H descending trendline, respecting bearish structure on lower timeframe (30m).
✅ 1H Order Block (OB) marked between 3335-3340 remains a strong demand zone where price can bounce break the trendline to sweep liquidity above around 3377 to form bullish continuation.
📌 Scenarios I'm Watching:
Short-term rejection from the 4H trendline.
Potential reversal towards 1H OB.
Bullish reaction from OB could trigger a breakout above the 4H trendline.
Final upside target remains at the liquidity pool around 3377 zone ($$$).
🟣 Overall Bias: Bullish after liquidity sweep. Watching for bullish confirmation at OB before executing buys.

Bear Despite major trend being bulls we have a n opportunity to sell at this region (1Day resistance line and target previous 4hr resistance line that has been broken
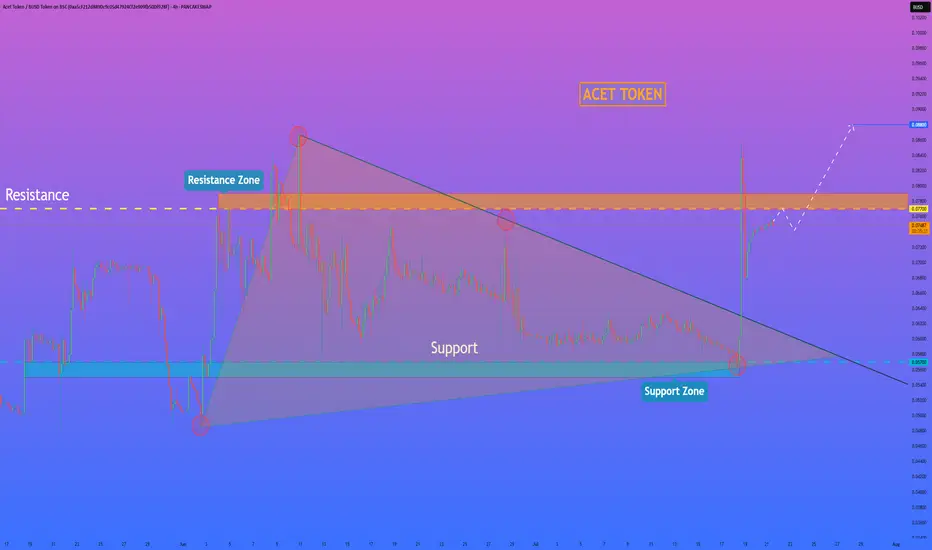
HelenP. I Acet Token may make correction and then continue growHi folks today I'm prepared for you Act Token analytics. If we look at the chart, we can observe a clear technical picture. For a considerable amount of time, the price was tightly compressed inside a large downward wedge, defined by a robust support zone at 0.0570 - 0.0550 and a descending trend line that put consistent pressure on the price. Such long consolidation periods often precede a powerful expansion. Recently, we have witnessed a decisive breakout from this wedge, confirmed by a strong impulse candle. This move signals a clear shift in market sentiment from neutral to bullish and invalidates the prior constraining structure. I believe that the momentum from this breakout will be sufficient to challenge the next major obstacle: the horizontal resistance zone at 0.0770 - 0.0790. This is a critical level to watch, as it has previously rejected price advances. My scenario implies that after potentially a small, healthy correction or retest, the price will continue its upward movement. A successful break above this critical area would confirm the newfound strength of the buyers and open up a clear path for further appreciation. For this reason, my primary goal, the logical target for this move, is set at the 0.0880 level. If you like my analytics you may support me with your like/comment ❤️
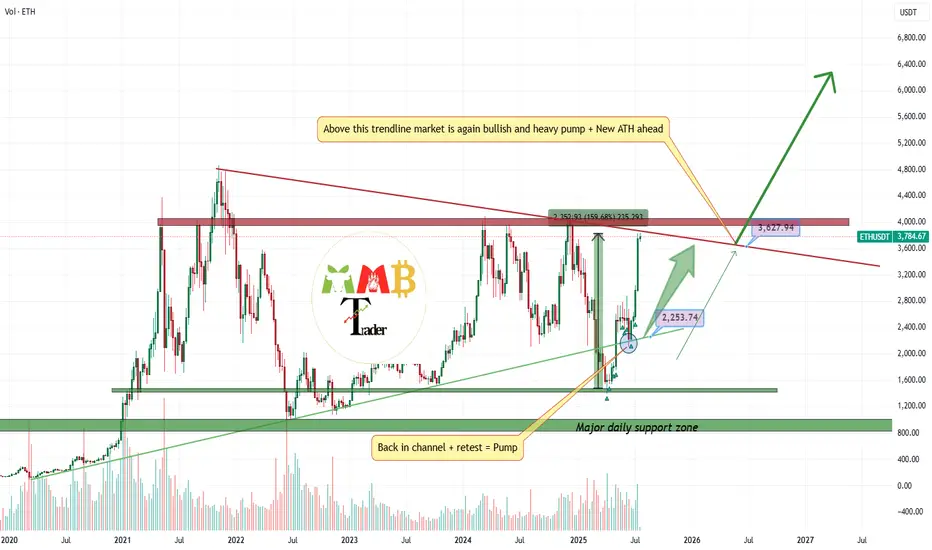
The best Buy call doesn't exists?(+160% profit on ETH)After i open long at weekly low and it almost play well until now:
\https://tradingview.sweetlogin.com/chart/ETHUSDT/BrdJLvgY-ETHUSDT-near-two-major-weekly-support-and-soon-2200/
Now i am looking for range here or without that range ASAP red trendline will break to the upside and more pump and gain also is expected and this is just the beginning.
DISCLAIMER: ((trade based on your own decision))
<<press like👍 if you enjoy💚
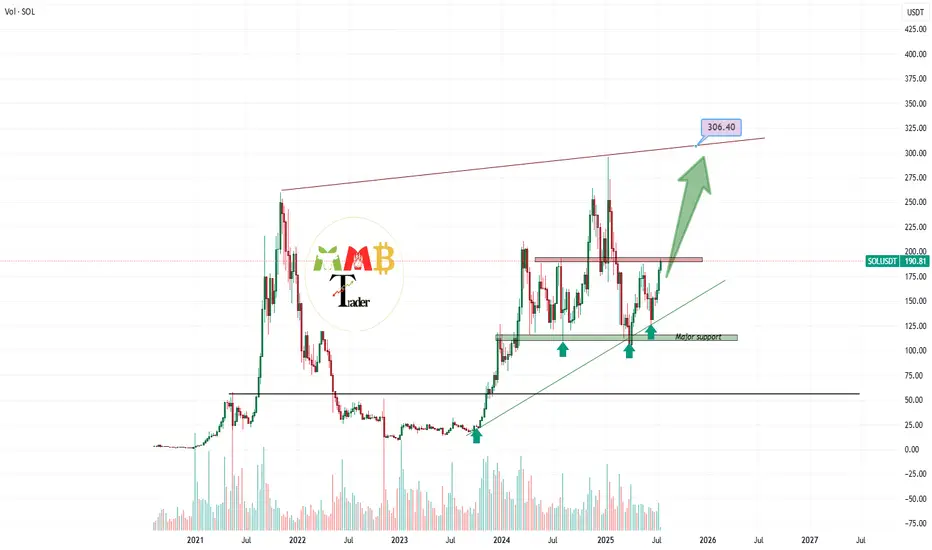
SOLUSDT at least is targeting 300$ this time We are looking for more pump for BINANCE:SOLUSDT on this market and at least after breaking and hitting first targets which are 200$ and 250$ then it is time for new ATH above the 300$.
Major supports and resistances are all mentioned on the chart too.
DISCLAIMER: ((trade based on your own decision))
<<press like👍 if you enjoy💚
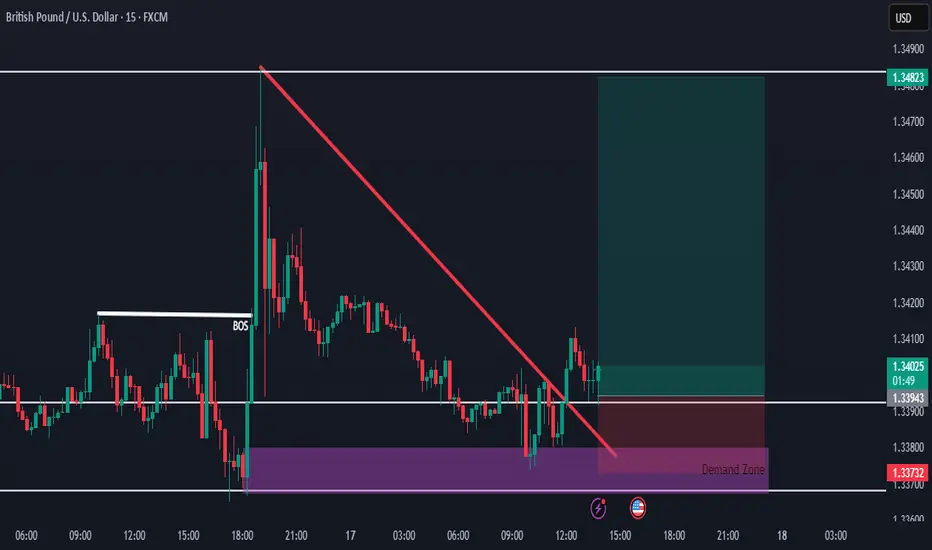
GBPUSD Buy Setup from Strong Demand ZoneHello everybody!
Price is in a higher timeframe demand zone, which is very strong and a good place to buy.
We were waiting patiently for confirmation, and now we have two key signals:
1- After a break of structure in the market, a small demand zone has formed.
2- The break of the downward trendline is where we entered the buy position.
Ultra-short-term trading. Profit of $10/ounceThe order to buy XAUUSD successfully made a profit. The current gold price is 3367. Stimulated by the weekend news, the expected trend was achieved smoothly, and the short-term bulls were strong. Buying can continue to be the main focus. Relying on the half-hour and one-hour trends, trading can be carried out in the London market for the purpose of buying and profit. The increase is about $10/ounce.
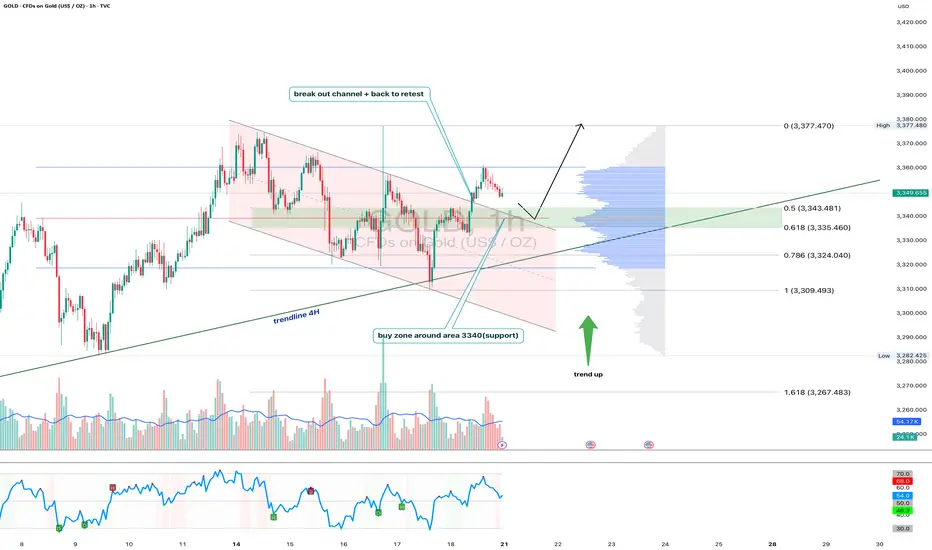
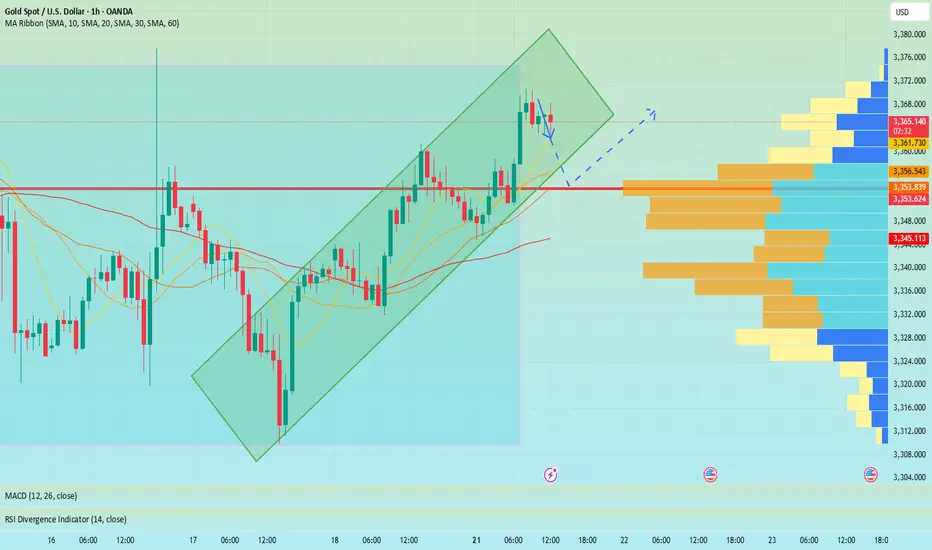
Gold 1H - Retest of channel & support zone at 3340After breaking out of the falling channel, gold is currently retesting its upper boundary — now acting as support. The 3340 zone is particularly important as it aligns with the 0.618 Fibonacci level and high volume node on the visible range volume profile. The price action suggests a potential bullish rejection from this area. With both the 50 and 200 EMA below price on the 1H, the short-term trend remains bullish. The 4H trendline further supports this setup. RSI is cooling off near the neutral zone, leaving room for another leg higher toward the 3377 resistance zone. If 3340 fails, 3324 (0.786 Fibo) becomes the next line of defense. Until then, the structure remains bullish following the successful breakout and retest of the channel.
Gold momentum is about to explode, is 3400 still far away?
💡Message Strategy
Gold prices rose as expected on Friday as a weaker dollar and continued geopolitical and economic uncertainty boosted demand for safe-haven gold. Spot gold rose 0.4% to $3,353.25 an ounce, down 1.1% in the previous session. U.S. gold futures also rose 0.4% to $3,359.70. Gold prices remained largely stable around $3,350 an ounce this week.
The trend of gold prices is currently mainly affected by the following three factors:
1. US economic data supports the US dollar
The latest US real estate data is generally positive, and building permits and new housing starts data are both above expectations. The recovery of the real estate market has reduced market concerns about economic recession, which has provided some support to the US dollar, thereby constituting a certain suppression on gold.
2. Fed policy differences trigger market games
Fed officials have obvious differences in their statements on monetary policy. Christopher Waller, a Fed governor, prefers to directly cut interest rates by 25 basis points in July, worried about economic slowdown and weak job market. San Francisco Fed President Daly believes that two interest rate cuts in 2025 are "reasonable", but is wary of the impact of excessive tightening policies on the job market.
On the contrary, Fed Governor Kugler is more hawkish, believing that recent tariffs have been transmitted to consumer prices, and high interest rates should continue to be maintained, and it is not appropriate to cut interest rates for the time being. The existence of differences has caused market expectations to waver, and gold has fallen into consolidation.
3. Inflation expectations determine the medium-term direction of gold prices
The June CPI data from the United States showed signs of rising inflation, which may cause the Federal Reserve to postpone the pace of interest rate cuts.
📊Technical aspects
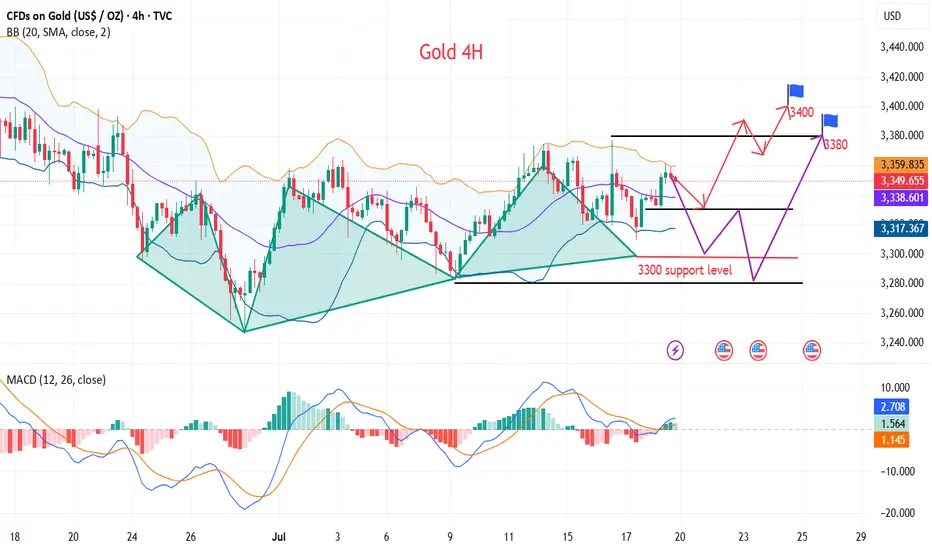
From the 4H chart, gold is currently oscillating in an obvious symmetrical triangle, forming a consolidation pattern in the short term.
Bollinger Band indicator: The middle track of the Bollinger Band is at $3345, the upper track is at $3405, and the lower track is at $3280. The current price is running near the middle track, indicating that volatility is converging and there is an expectation that a direction will be chosen soon.
Support and resistance: The current key support level is $3,280; short-term support is 3,300, and the upper resistance is $3,380. After breaking through, it is expected to test the previous highs of $3,451 and $3,499.
MACD indicator: The MACD histogram is gradually converging, and the DIFF line (3.19) and the DEA line (1.91) are in a sticky state, indicating that the momentum is exhausted and the probability of short-term shocks is high, but once the volume breaks through, the trend may form quickly.
RSI indicator: The RSI indicator is currently at 53.64, which is in the neutral area and has not entered the overbought or oversold area, indicating that the market is still waiting for new direction signals.
Overall, the analysis believes that gold is at the end of a symmetrical triangle, and the technical side shows that it is about to face a breakthrough. The direction choice may appear tonight or early next week, and the idea is still mainly low-level bulls.
💰Strategy Package
Long Position:3320-3330,SL:3300,Target: 3370-80,3400
Gold is rising steadily, finding the right buying point is the k
There are no eternal friends, only eternal interests. Value exchange is the "code" of interpersonal relationships. From the president to individuals, the game of interests is everywhere.
Half a year ago, Musk strongly supported Trump to take office. The two joined forces to win the swing states. One gained power and the other gained fame. After Musk became the head of the efficiency department, he made drastic reforms and fought corruption from the outside to the inside.
Now, the two have parted ways. According to US media reports on July 20, Trump began to review the order contract between Musk's Space X and the federal government. In just 6 months, the two went from close friends to opponents. The "big and beautiful" bill was also strongly resisted by Musk.
If the big guys are like this, let alone ordinary people, their butts determine their heads, sitting in different positions to think about different interests, emotions and friendship are just outer garments, Musk spent $270 million and got fame, and Trump also got the power he pursued, there is no right or wrong.
This struggle is far from over. It is estimated that the game will continue during Trump's four years in office. Musk stands on the high-dimensional pursuit of interests for the exploration of human progress, while Trump's slogan is to make America great again. The two people have taken different routes.
What we care about is not the right and wrong of the two, but whether this right and wrong will bring turmoil to the financial market. Will Tesla be the "prince in distress"? Is there a possibility of bargain hunting after the stock price plummets in the short term? Will the gold market trigger risk aversion because of Trump's unpredictable approach? This is what we need to ponder and study.
Okay, let's talk about the gold market today:
During this period, the volatility of the gold market has become smaller and smaller, and the range of fluctuations has also been compressed. The sentiment of investors in the market is relatively low. When the fluctuations just started in April, some people who were trapped were concerned about when to get out of the trap every day. After 3 months, everyone is tired, and the fight between bulls and bears has cooled down.
However, as the shock is coming to an end, the gold price may explode into a new round of unilateral market at any time due to fundamentals, especially on August 1, Trump will implement equal tariffs on global trading partners. This king bomb has been delayed. Once it starts to land, it will inevitably cause turmoil in the financial market.
Since last week, affected by Trump's threat to fire Fed Chairman Powell, the gold price quickly hit the high of $3,370 and then fell back to $3,310. After that, the price lows continued to rise and rebounded. The top and bottom conversion of $3,345 in the morning and the support of the low point in the early morning of last Friday were the starting points for the rise. Today, the focus is on the long-short dividing point of $3,345, that is, the price is temporarily not empty above $3,345. Today is not a sharp rise at the opening. The prerequisite for a sharp rise must be that $3,345 breaks.
Today, I think that 3345 USD should be used as the dividing point between long and short positions, that is, your stop loss should be placed below 3345, and then find a position to go long, such as within the range of 3360-55, first look at 3370-75 above, and then look at 3392-95 USD after breaking through. Some people say that they dare not do such a large stop loss? In fact, just reduce the position. The stop loss space is dynamically adjusted according to the support level. Fixed stop loss space is a false proposition.
Gold is waiting for a pullback to break through 3400In the short term, gold is stuck in a sideways trend near 3365. It is not recommended to enter this point regardless of long or short positions. It is expected that there will be certain variables in the NY period. If gold retreats and falls in the short term as we expect, it may first touch around 3361. If it falls below 3361, it is expected to touch around 3353, which is also the point I gave this morning to see support.
Judging from the market, our focus on the upper side is still the 3375-3385 resistance area. If it can be effectively broken through, it is expected to hit the 3400-3420 mark. Although the daily MACD is oscillating near the zero axis, the 4H market shows that the oscillation is strong. Our trading strategy remains unchanged in the short term. The pullback in the NY period provides an opportunity, and we can consider going long. If there is new news during the day that requires adjustment, I will notify you immediately. Bros, please be patient and wait for trading opportunities.
OANDA:XAUUSD
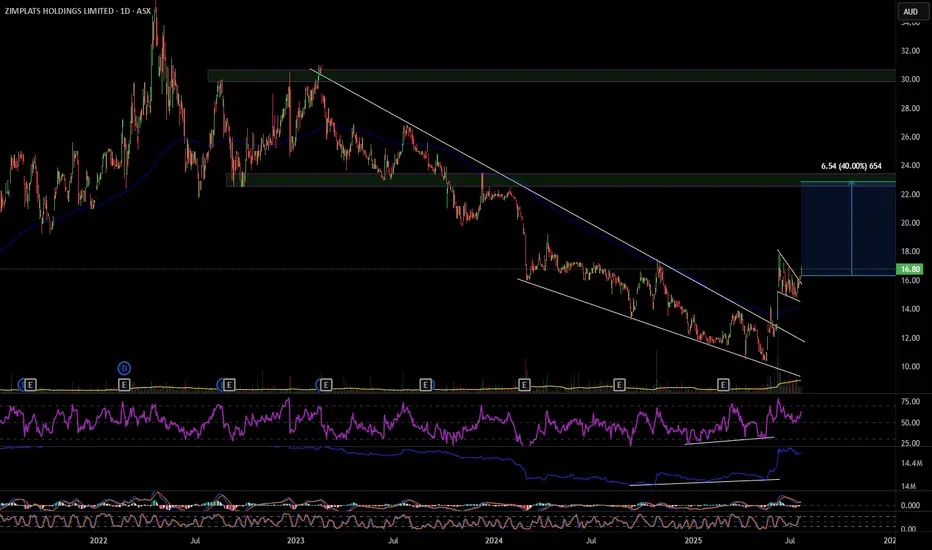
ZIM 40% move up
ZIM has broken out of a descending wedge with bullish RSI and OBV divergence, also multiple divergences on smaller time frames. On the hourly it's had a pull back and formed a bull flag that it has also broken out of. ZIM looks to have formed a change of structure forming higher highs and higher lows, my first target will be $22.90 a move of 40%. Definitely one to consider. Good luck and happy trading 🍀
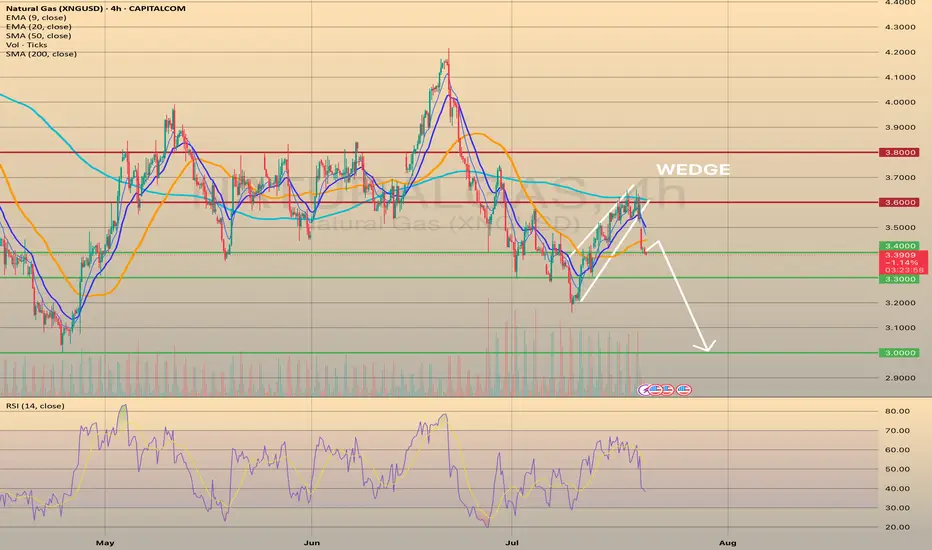
U.S. NATURAL GAS - BEARISH WEDGE WORKED OUT. WHAT'S NEXT?U.S. NATURAL GAS - BEARISH WEDGE WORKED OUT. WHAT'S NEXT?
Today, the market opened 2.66% below its closing price on Friday. The current price has already fallen on 4.8% since the closing on Friday, and it is now above the 3.400 support level. I expect further decline, however, with a possible rebound from the current level and pullback towards the SMA50, with a final target of 3.000.
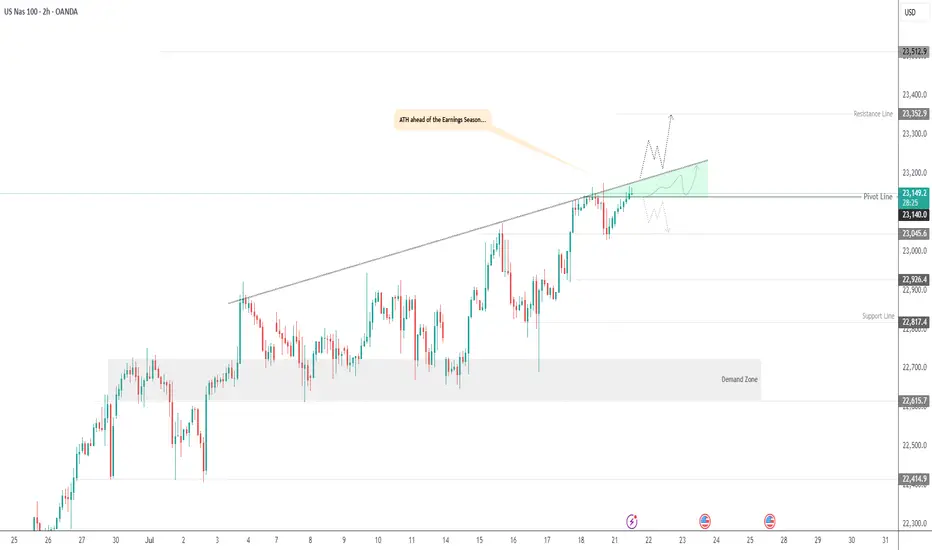
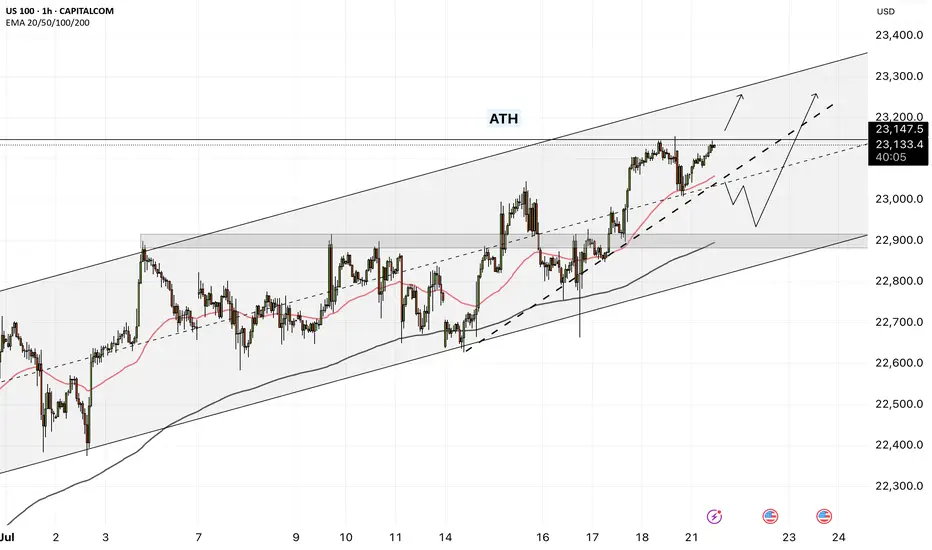
USNAS100 | Bullish Setup Ahead of Tech Earnings & Trade RiskUSNAS100 | Bullish Setup Ahead of Tech Earnings & Trade Risk
U.S. equity markets are entering a pivotal week with big-tech earnings and renewed focus on Trump’s proposed trade tariffs. Both the S&P 500 and Nasdaq are hovering near record highs, but new catalysts are required for continuation.
Technical Outlook:
The price has stabilized above 23140, breaking the pivot and confirming bullish momentum. As long as the price holds above this level, the trend remains bullish, especially if it breaks the green triangle resistance structure.
A sustained move above 23140 opens the path toward 23250 and 23350, with further extension possible to 23510.
However, a 4H close below 23140 may activate a bearish correction toward 23045, and possibly deeper toward 22920 and 22820.
Resistance Levels: 23250 · 23350 · 23510
Support Levels: 23045 · 22920 · 22820
Bias: Bullish above 23140
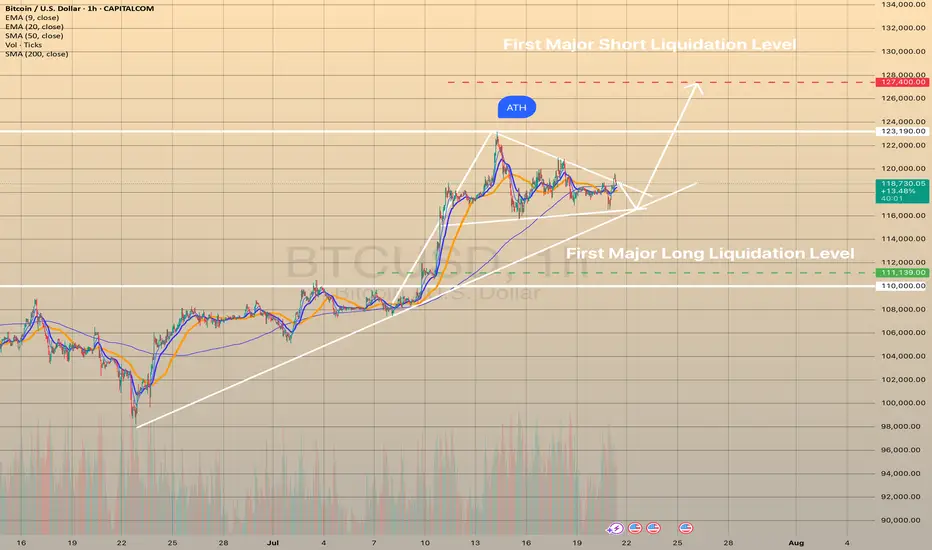
BTCUSD CONSOLIDATES BEFORE NEXT HIKE
BTCUSD CONSOLIDATES BEFORE NEXT HIKE📈
Bitcoin has been under buying pressure since the beginning of July 9. Since July 14 the price has been consolidating. Now the graph represents the bullish pennant.
I expect the price to continue trading sideways for some time, then rebound from the trendline and move towards first major liquidation level at 127,400.00.
What is a liquidation Level?
The price at which a crypto exchange forcibly closes a leveraged position when margin falls below the required level, recovering borrowed funds.
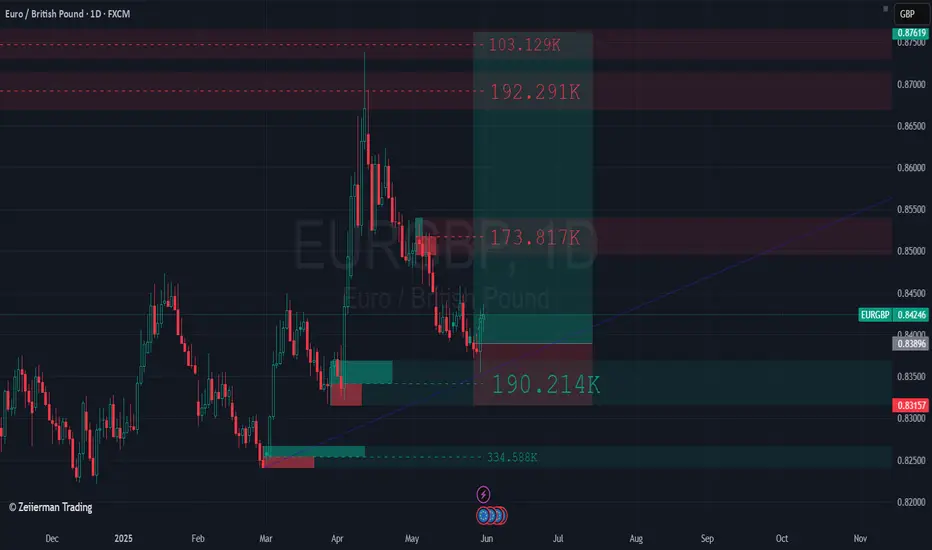
I'm currently long on EUR/GBPPrice is currently reacting to a retest of an order block located within the discount zone, following a Shift in Market Structure (SMS).
Additionally, on the weekly timeframe, price is also positioned in the discount zone, aligning with a weekly order block at the same level.
Disclaimer: This is not financial advice—just my personal analysis.
EURUSD is Nearing the Daily Uptrend! Hey Traders, in today's trading session we are monitoring EURUSD for a buying opportunity around 1.15800 zone, EURUSD is trading in an uptrend and currently is in a correction phase in which it is approaching the trend at 1.15800 support and resistance area.
Trade safe, Joe.
NAS100 - Stock Market Awaits Tariffs!The index is trading above the EMA200 and EMA50 on the 1-hour timeframe and is trading in its ascending channel. The target for this move will be the channel ceiling, but if it corrects towards the indicated support area, it is possible to buy Nasdaq with better reward to risk.
In a week once again clouded by trade tariff threats, the stock market reacted cautiously at times. However, what truly captured investors’ attention was growing concern over potential political interference in Federal Reserve policymaking—a development that influenced market sentiment and shifted the focus away from geopolitical tensions.
Despite political headwinds, U.S. economic data continued to show signs of resilience. Investors this week were more focused on corporate earnings and inflation data than on trade war rhetoric or speculation about Jerome Powell’s possible dismissal. While betting markets such as Polymarket raised the odds of Powell being removed to 40%, legally, the president cannot dismiss the Fed Chair without a valid cause—and allegations like “lying to Congress” lack legal standing.
Still, the greater danger lies not in Powell’s dismissal itself but in the potential erosion of the Federal Reserve’s independence—something that could unsettle investors in stocks, bonds, and currencies alike. Analysts expect Trump may soon appoint an ally as an informal or “shadow” Fed Chair, a move that would elevate political risk in financial markets.
Nevertheless, markets are continuing to operate along familiar lines: equities focus on corporate profits, the bond market on inflation and growth, and the currency market on relative returns. For now, the takeaway is clear: Trump is winning—but perhaps only temporarily.
Rick Rieder, Chief Investment Officer at BlackRock, noted that despite trade tensions and inflation concerns, tariffs have had limited impact so far. Following the June CPI report, he pointed out that inflation ticked up slightly—core CPI rose by 0.23% monthly and 2.93% annually, while headline inflation was up 0.29% monthly and 2.67% annually—but the broader trend still reflects easing price pressures.
Rieder attributed this to companies acting preemptively, managing inventory and adjusting supply chains to avoid passing on costs to consumers. He also cited easing wage pressures and a weakening labor market as factors contributing to the decline in inflation.
As such, Rieder believes the Federal Reserve might lower interest rates in September, though a cut in July is less likely, as the central bank would prefer to assess the impact of tariffs first.
According to the Wall Street Journal, Treasury Secretary Scott Besant privately urged Trump not to remove Jerome Powell. Besant warned that such an action could cause unnecessary turbulence in financial markets and the broader economy, and would also face legal and political hurdles. He emphasized that the Fed is already signaling potential rate cuts later this year, and confronting Powell now would be unwarranted.
A source noted that Besant reminded Trump the economy is performing well, and markets have responded positively to administration policies—another reason to avoid drastic moves.
On another front, rising long-term bond yields have become a concern for Besant, as they increase the government’s borrowing costs.He has been working to keep yields in check and believes firing Powell could further escalate them—hence his conversation with Trump aimed at dissuasion.
The coming week will begin with market attention on the European Central Bank’s rate decision, which could set the tone for Eurozone monetary policy in the second half of the year. Meanwhile, a series of key U.S. economic data will be released, providing a clearer view of conditions in employment, production, and housing.
On Tuesday, Jerome Powell will deliver an opening speech at an official event in Washington. While he is unlikely to directly address Trump’s recent verbal attacks, investors will be listening closely for any subtle references to Fed independence or interest rate direction.
On Wednesday, the June existing home sales report will be released, which could indicate whether housing demand remains steady or is weakening.
Thursday will be a packed day on the economic calendar. The ECB’s rate decision will be announced—an event under heavy scrutiny amid Eurozone stagnation. In the U.S., preliminary PMI data from S&P, weekly jobless claims, and new home sales will also be published.
Finally, the week will wrap up on Friday with the release of U.S. durable goods orders—an important gauge of capital investment in the manufacturing sector.
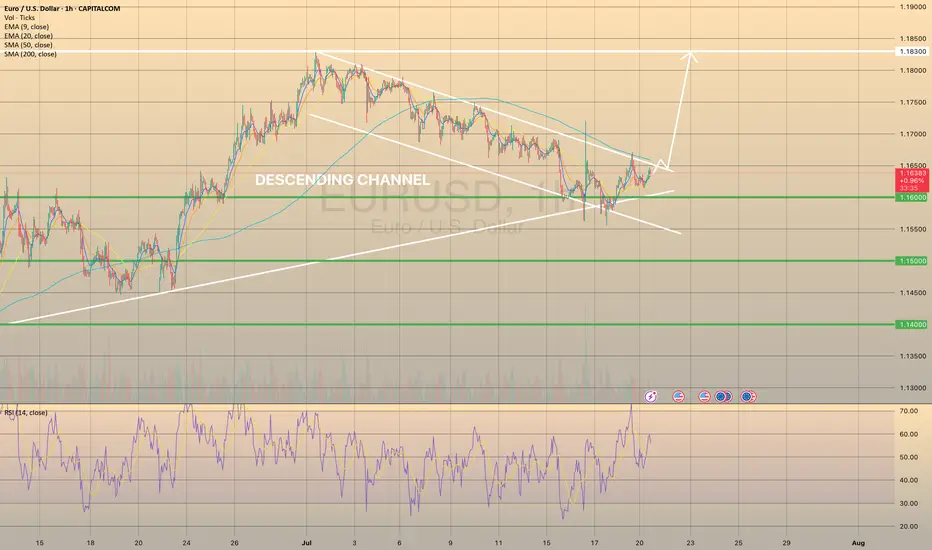
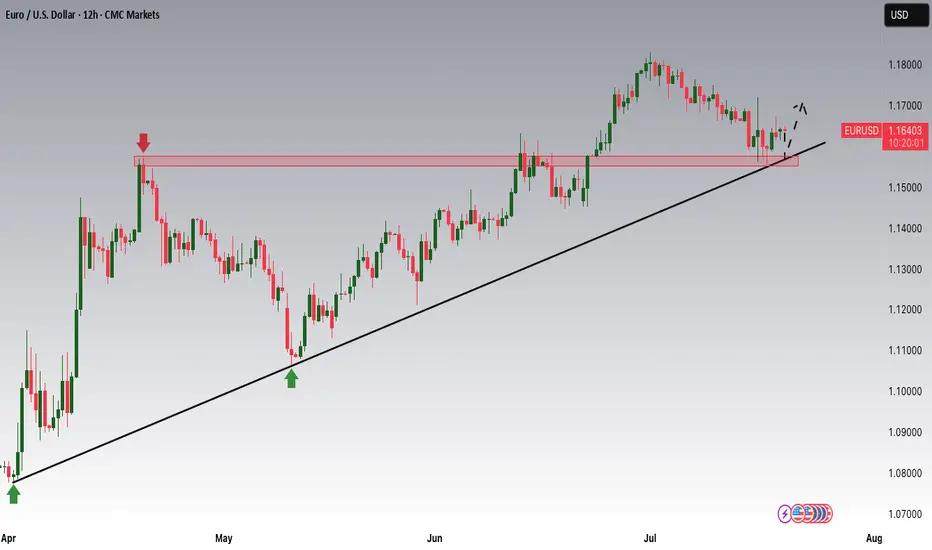
EURUSD FOUND SUPPORT, READY TO BREAK THE CHANNELEURUSD FOUND SUPPORT, READY TO BREAK THE CHANNEL🔥
EURUSD has been trading within the descending channel since the beginning of the descending channel. Recently the price reached the major trendline, graph started to show the bullish divergence on the RSI .
What is a bullish divergence?
A technical analysis pattern where the price makes lower lows, but a momentum indicator (e.g., RSI, MACD) forms higher lows, signaling weakening bearish momentum and a potential trend reversal upward.
So, another hike in this pair is expected. Possible direction: spike towards the SMA200, minor pullback and a further development of the bullish impulse.