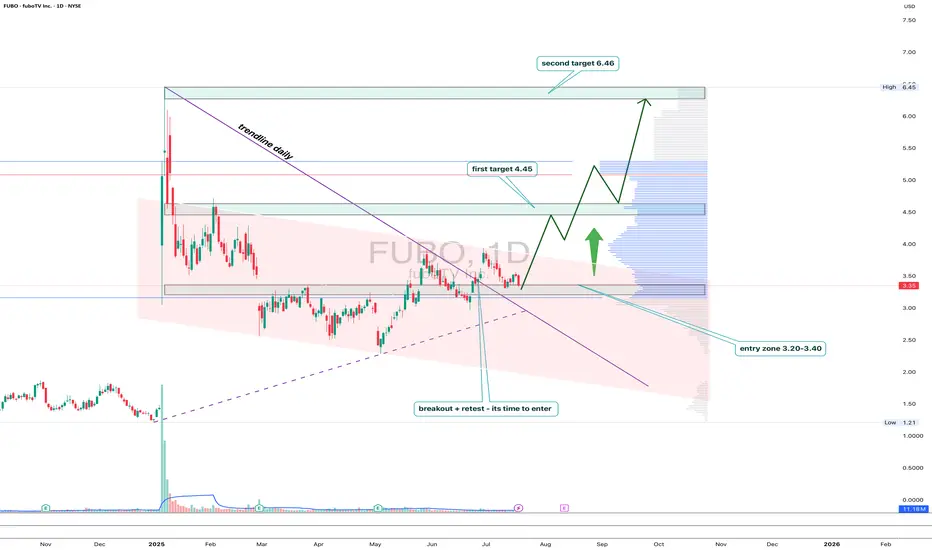
FUBO: trendline breakout with a subscription to $6.46FUBO has broken out of the descending trendline on the daily chart, followed by a clear retest and consolidation above the key 3.20–3.40 area. This zone coincides with the 0.5 Fibonacci retracement and high-volume support, confirming strong buyer interest.
As long as price holds above 3.20, the setup looks bullish with targets at 4.45 (0.382), 5.22, and finally 6.46 — the major resistance and top of the current range. Volume picked up on the breakout, validating accumulation from bigger players.
Fundamentally, FuboTV remains a niche contender in the sports streaming market. With optimized spending and new partnerships with major sports leagues, interest may spike ahead of events like the Olympics and NFL season.
Tactical setup:
— Entry zone: 3.20–3.40
— Must hold: above 3.20
— Targets: 4.45 / 5.22 / 6.46
— Invalidation: break below entry without buyer confirmation
This breakout might just be FUBO’s ticket to prime time.
Trend Lines
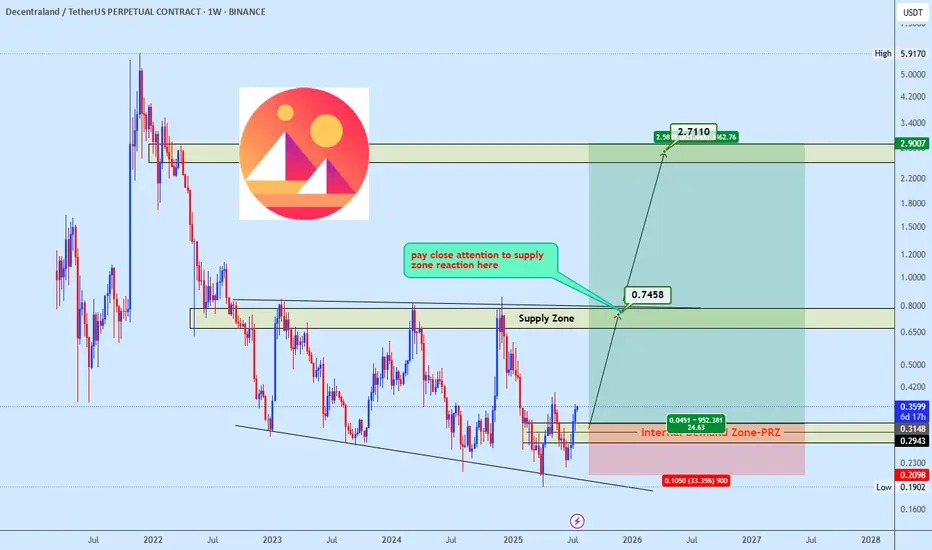
Manausdt buy opportunityMANAUSDT is gaining strength with price rebounding toward the bottom trendline and pushing upward. Momentum favors a continued rise toward the $0.65–$0.80 supply zone, a key level that previously triggered strong sell-offs. A successful breakout above this zone could unlock significant bullish momentum, with eyes set on the $2.70 region as the final setup target. Let price action lead, this could unfold swiftly.
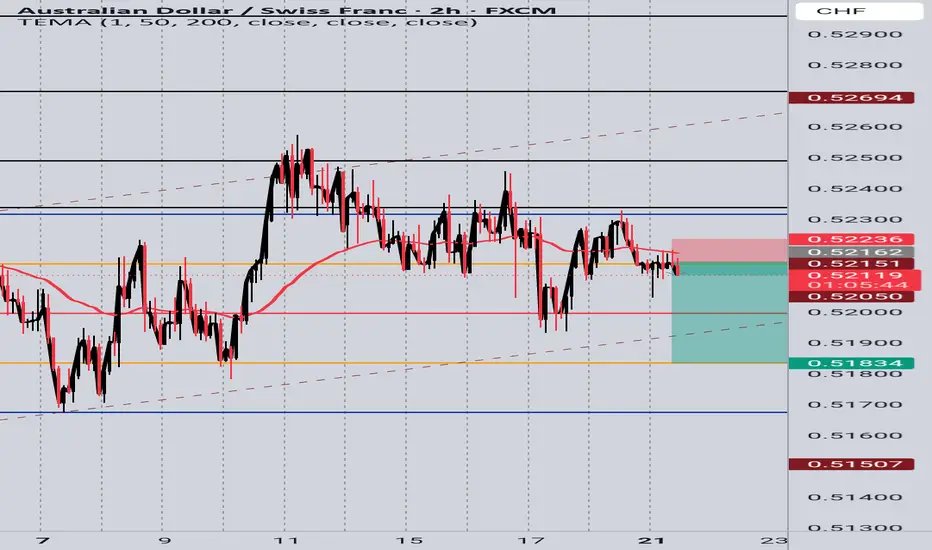
AUD/CHF 2H – Price Action Short Setup🔎 Why This Setup Makes Sense:
1.Trend Bias
Downtrend confirmed — price is below both structure and moving averages.
2.Resistance Rejection:
Price failed to break back above resistance near 0.5223 and left small bearish candles — showing seller strength.
3.Entry Idea:
Short entry just below the resistance zone with a tight stop above recent minor swing high (~0.5223).
4.Target Zone:
Your take profit is near 0.5183, where price previously bounced — a natural support and reaction zone.
Bitcoin monthly RSI CYCLEEvery time Bitcoin peaked in previous cycles, its monthly RSI exceeded 90. In this cycle, the RSI hasn't surpassed 75, but I expect a breakout through 75 to at least 86 in the coming months.

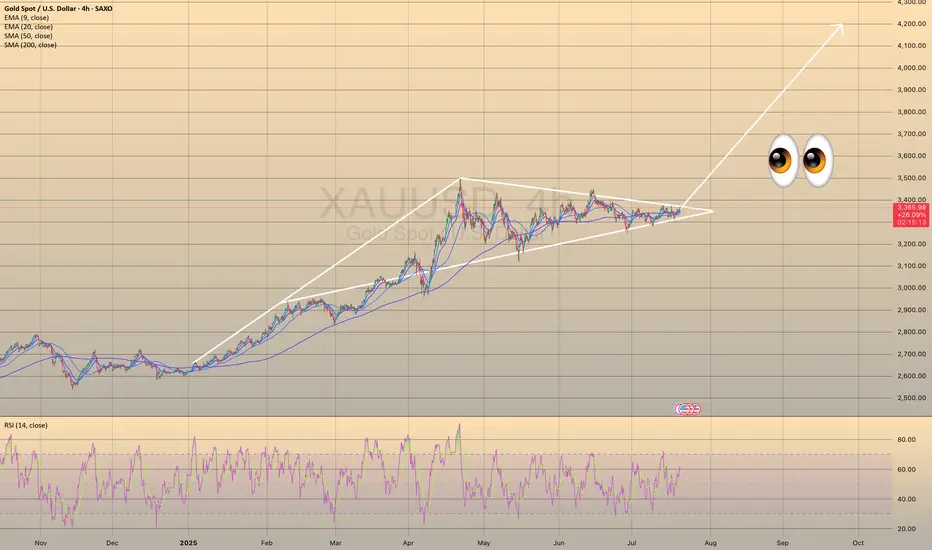
XAUUSD FORMED A BULLISH PENNANT PATTERN-ANOTHER BULLISH IMPULSE?XAUUSD FORMED A BULLISH PENNANT PATTERN - ANOTHER BULLISH IMPULSE?📈
Gold has been under buying pressure since the beginning of the year. Since April 21 the price has been consolidating. Now the graph represents the bullish pennant.
What is a bullish pennant?
Pennant pattern: Short-term continuation pattern after a sharp price move (flagpole), forming a small symmetrical triangle. Signals trend resumption, lasts 1-3 weeks with declining volume. So, first of all, identify a flagpole and a consolidating triangle. Confirm it with indicators (bullish/bearish divergence). After that you may trade breakout in trend direction (buy bullish, sell bearish) with volume spike. Set your stop-loss below/above the opposite side of pennant. You may set your take-profit at a flagpole height from a breakout.
Here we see the divergence on RSI 4-h timeframe. If the price breaks the upper border of the pennant pattern you may open long position.
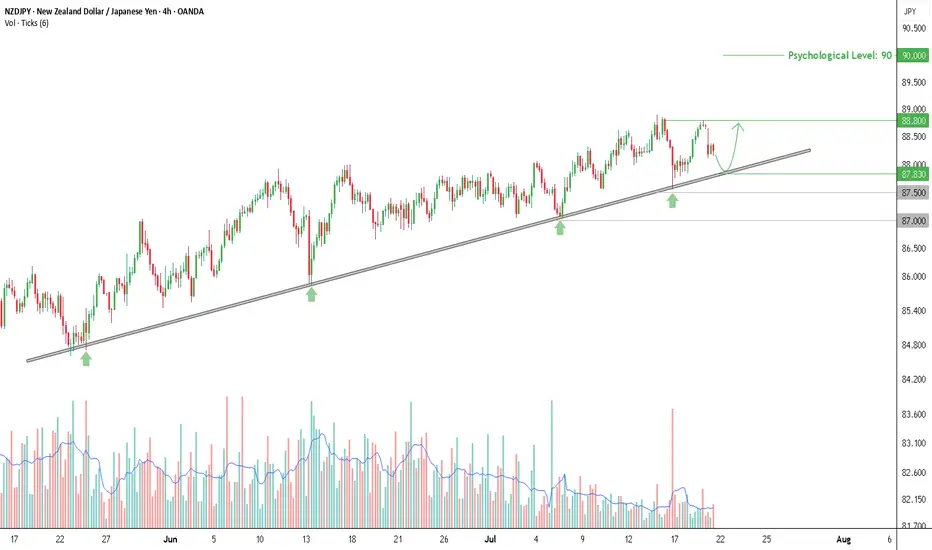
Buy Opportunity on NZDJPY, Testing Trendline with Rising VolumeThe NZDJPY chart on the 4-hour timeframe shows a consistent uptrend pattern, supported by a well-respected ascending trendline that has been tested multiple times since late May 2025. Rebounds from this trendline are marked by green arrows on the chart, indicating a strong reaction zone. Each time price touches the trendline, trading volume tends to increase—signaling active buying interest from market participants.
Currently, price is pulling back toward the trendline support area around 87.830, which could once again act as a bounce point, just like in previous sessions. As long as this trendline holds, the rebound scenario remains dominant and offers a potential opportunity for a long (buy) setup.
Entry & Take Profit
If price bounces from the trendline area, a buy entry can be considered around 87.83, with an initial take profit target at 88.80—the nearest local resistance level and previous consolidation zone.
Should the bullish momentum continue and break above 88.80, the next upside target could reach the psychological level of 90.00.
Stop Loss
As a risk boundary, a closing price below 87.50 can be used as a stop loss (SL) level, as it would indicate a potential breakdown of the higher low structure that has been forming.
If the trendline fails and price drops further, a deeper decline may extend toward the 87.00 area, which is a previously established horizontal support.
Additional Confirmation
It’s recommended to wait for bullish price action signals around the trendline area before entering a position, such as a bullish engulfing pattern, pin bar, or rejection candle. Also, monitor for a spike in volume as price approaches support, as increased volume often indicates strong buying interest.
As long as the trendline holds, the upward bounce scenario remains valid and should be considered for short- to medium-term buy strategies. The 87.83–87.90 zone is a key area to watch for the next market reaction.
Disclaimer: This analysis is part of a trading plan and does not constitute investment advice. Always use strict risk management and consider potential losses in every trade decision.
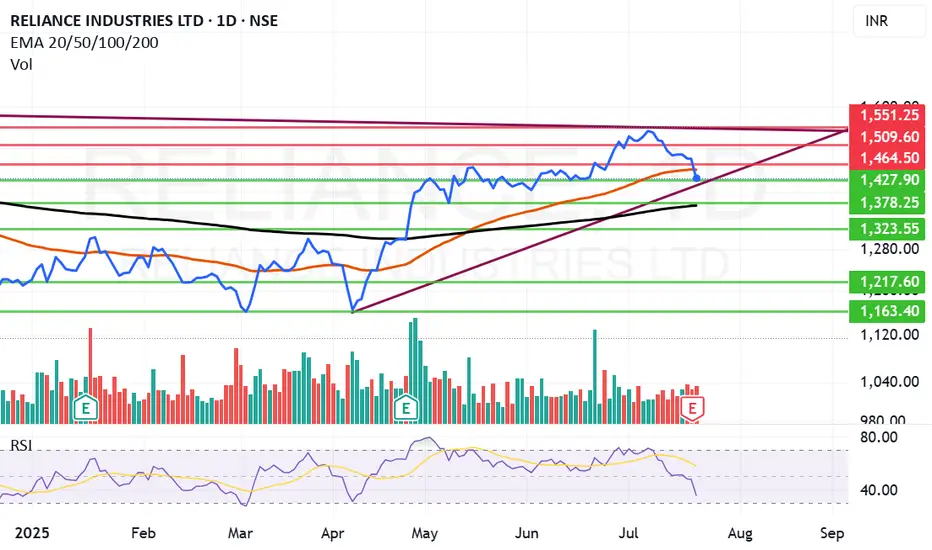
What to do with Reliance share after its drubbing today? Reliance looks weak post result however there is no spike in volume of sale that is a good point. The levels from which Reliance can recover seem to be 1427, 1370 or 1323. If we get a closing below 1323 the stock can fall to 1217 or even 1160 levels this is the reading as of now.
The result was looking good but on deeper scrutiny it was understood that major chunk was profit was due to sale of Reliance stake in Asian Paints business. This I think is not liked by the market specially the retail investors.
The stock has tanked close to 3% as of now but there is no huge selling seen from HNIs or MFs (As of now). (This is an assumption looking at the volume of sale) Volumes are similar to normal day of trade.
May be as retail investors panic MFs, HNIs and others might gulp the stock. Cant say clearly. We might reanalyze by end of the day but caution: Do not sell Reliance in Panic. Result was average it was not bad even if we ignore the Asian paint factor so. Currently I am not selling Reliance I am holding on to it. Might add at lower levels.
Disclaimer: The above information is provided for educational purpose, analysis and paper trading only. Please don't treat this as a buy or sell recommendation for the stock or index. The Techno-Funda analysis is based on data that is more than 3 months old. Supports and Resistances are determined by historic past peaks and Valley in the chart. Many other indicators and patterns like EMA, RSI, MACD, Volumes, Fibonacci, parallel channel etc. use historic data which is 3 months or older cyclical points. There is no guarantee they will work in future as markets are highly volatile and swings in prices are also due to macro and micro factors based on actions taken by the company as well as region and global events. Equity investment is subject to risks. I or my clients or family members might have positions in the stocks that we mention in our educational posts. We will not be responsible for any Profit or loss that may occur due to any financial decision taken based on any data provided in this message. Do consult your investment advisor before taking any financial decisions. Stop losses should be an important part of any investment in equity.
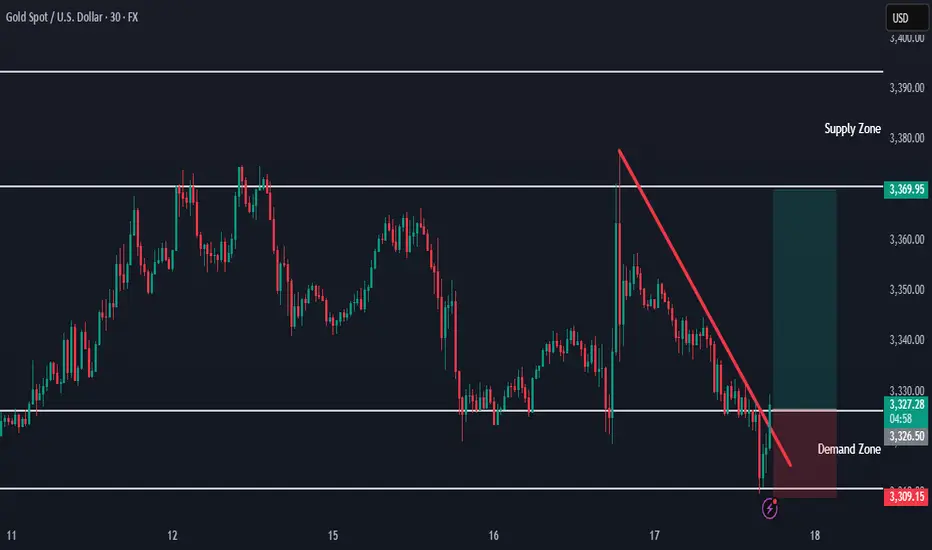
Gold Holding Demand — New Buy Setup FormingThe demand zone on the higher timeframe is still holding, and price is starting to move higher.
A new buy opportunity is forming upon the break of the downward trendline.
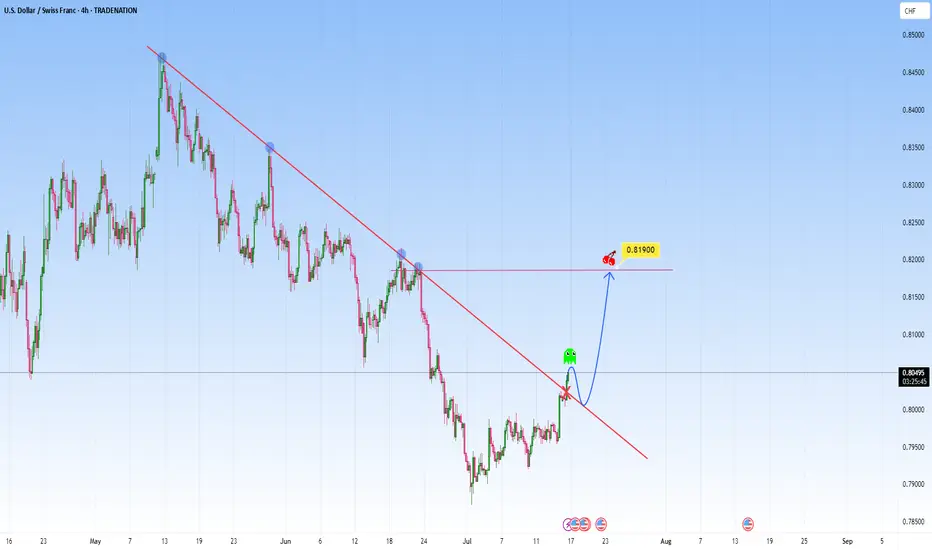
USDCHF: Could be telling a story of break-retest-reversalThe price action on the USDCHF presents an opportunity of structural transition. The descending trendline has acted as dynamic resistance, has contained each rally attempt beautifully. This trendline is marked by multiple rejections, reflected bearish dominance, a controlled downtrend in motion.
The recent movement though could signal a shift. The market has started to break above this descending structure, and it could early suggest that bearish momentum is weakening.
I will be waiting for the price to return to the broken trendline, treating former resistance as newfound support. It’s a confirmation pattern in order to filter false moves, a structure retest that reinforces breakout reliability.
From this base, I am expecting it to target the 0.81900 level, as shown. This area coinciding with horizontal resistance that aligns with previous reactions. Such levels as natural “gravitational pivots”.
An ideal approach here would involve observing the character of the pullback. If the market returns to the trendline with declining bearish volume and forms higher lows on lower timeframes, it strengthens the bullish case.
The trendline break on the chart is not just a signal, it’s a storyline unfolding. It marks a shift with a story. And if volume, price structure, and timing align as they appear poised to, this move could be the first move in a broader upside correction or trend reversal.
Just sharing my thoughts for the charts, this isn’t financial advice. Always confirm your setups and manage your risk properly.
Disclosure: I am part of Trade Nation's Influencer program and receive a monthly fee for using their TradingView charts in my analysis.
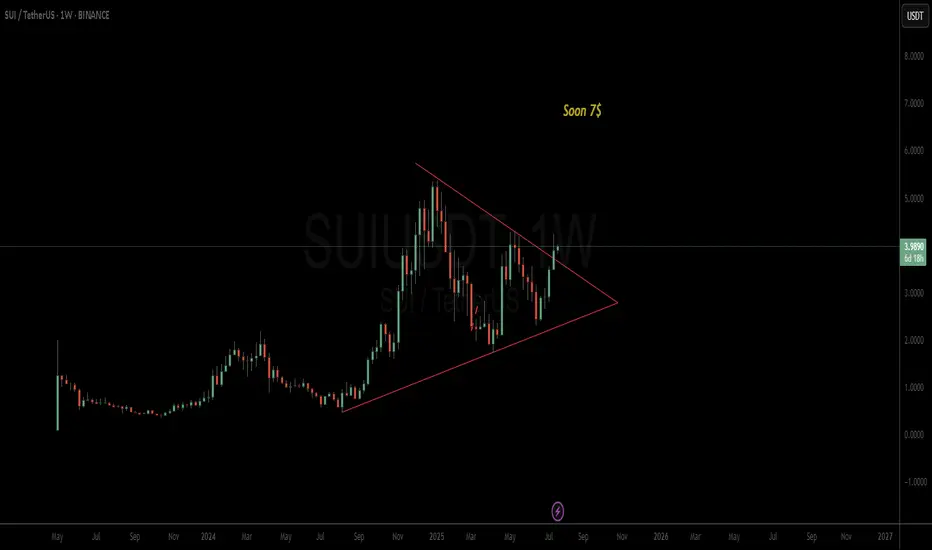
SUI potentail to 7$The chart is clear, folks
The triangle broke, and SUI has the potential to rise to 7$
Good luck
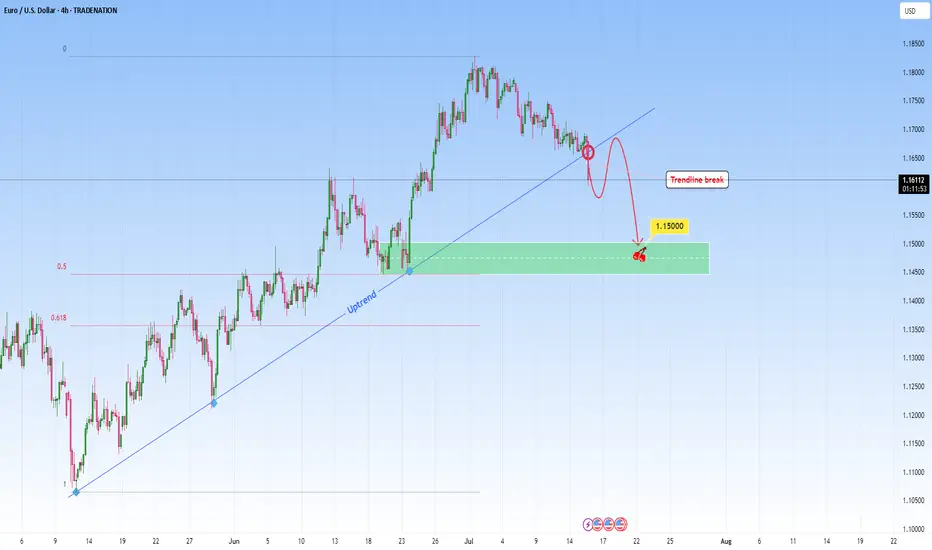
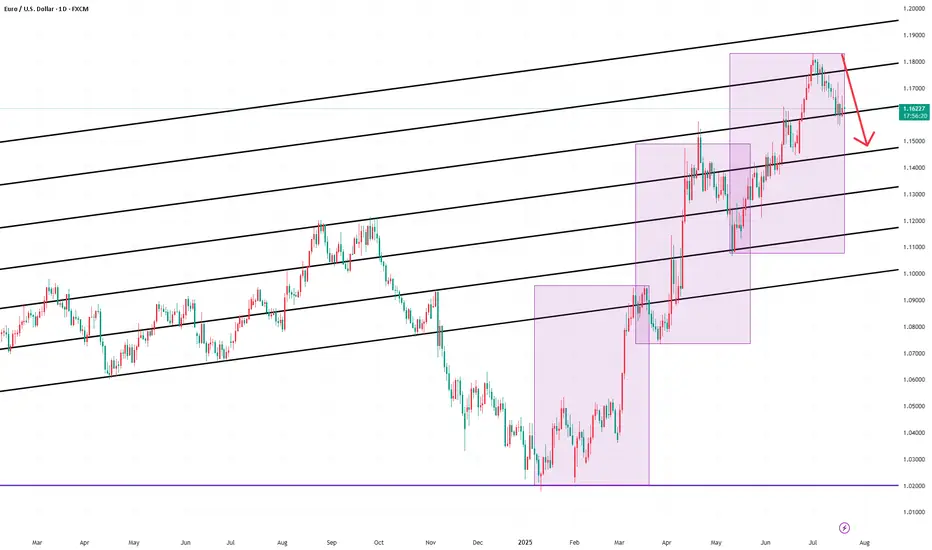
EURUSD: Sell Opportunity after Trendline breakEURUSD was in a steep uptrend but it might stop with this recent break through the uptrend. A break like this one on a strong trendline that had multiple touches, indicates either a potential reversal or major pause in the trend. This candle that broke the trendline signals the first hint of structural change.
I will be waiting for a retest and look to get involved in a short setup.
Ideally, what I look for in retests is to be met with a confirming candle. This would confirm the sellers have taken over and validate the change from uptrend to potential downtrend or consolidation phase.
My target would be around 1.1500.
Just sharing my thoughts for the charts, this isn’t financial advice. Always confirm your setups and manage your risk properly.
Disclosure: I am part of Trade Nation's Influencer program and receive a monthly fee for using their TradingView charts in my analysis .
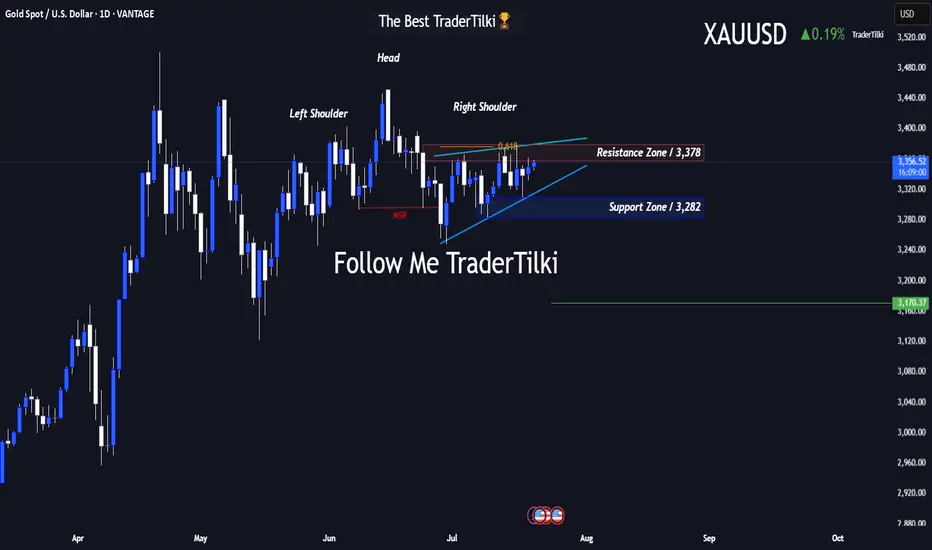
GOLD-XAUUSD vs. The FED: Technicals or Fundamentals?Good Morning Traders,
Let’s break down what gold is showing us on the 1-day chart:
- **Resistance:** 3,378
- **Support:** 3,282
- There’s a noticeable **head and shoulders pattern** on the chart. Under normal conditions, gold’s target sits at **3,170**.
Gold is highly sensitive to fundamental factors. Sudden war news or events like last week’s rumors about Trump firing the Fed Chair can trigger serious volatility.
That’s why I always combine **technical and fundamental analysis** in my approach.
For gold to reach the 3,170 target, the **3,282 support level must first be broken**. Since that hasn't happened yet, we can't confirm a bearish move—fundamentals play a key role here.
Keep in mind: this is a **swing trade** setup based on a 1-day chart. Reaching the target could take time.
I want to sincerely thank everyone who’s been supporting my analyses with likes—your support is
my biggest source of motivation when it comes to sharing content.
Much love and respect to you all.💛
EURUSD InsightWelcome to all our subscribers.
Please feel free to share your personal opinions in the comments. Don’t forget to like and subscribe.
Key Points
- Christopher Waller, a member of the Federal Reserve Board, commented on interest rate cuts, saying, “Why wait until September? It's only six weeks away and not that significant.”
- With the August 1st negotiation deadline approaching, Trump reportedly wants to impose tariffs on most EU goods at a level higher than the minimum 10%. Negotiations with the EU are said to be facing difficulties due to the U.S.’s hardline stance. The EU is expected to take retaliatory measures if the talks fail.
- Japan’s NHK reported that the ruling coalition of the Liberal Democratic Party (LDP) and Komeito is certain to fail to secure the 50 seats needed for a majority. As a result, Prime Minister Ishiba is likely to face difficulties in implementing his policies following a victory by the opposition.
This Week’s Key Economic Events
+ July 22: Speech by Fed Chair Jerome Powell
+ July 24: ECB Interest Rate Decision
EURUSD Chart Analysis
The downtrend continues, with the pair having dropped to the 1.16000 level. A further decline toward the 1.15000 area is possible if this level is breached, though a rebound from this zone is also a possibility. If a bounce occurs, attention should be paid to how the price behaves around the 1.18000 level. Conversely, if the pair drops to 1.15000 and then successfully rebounds, an upward move toward 1.19500 could be expected.
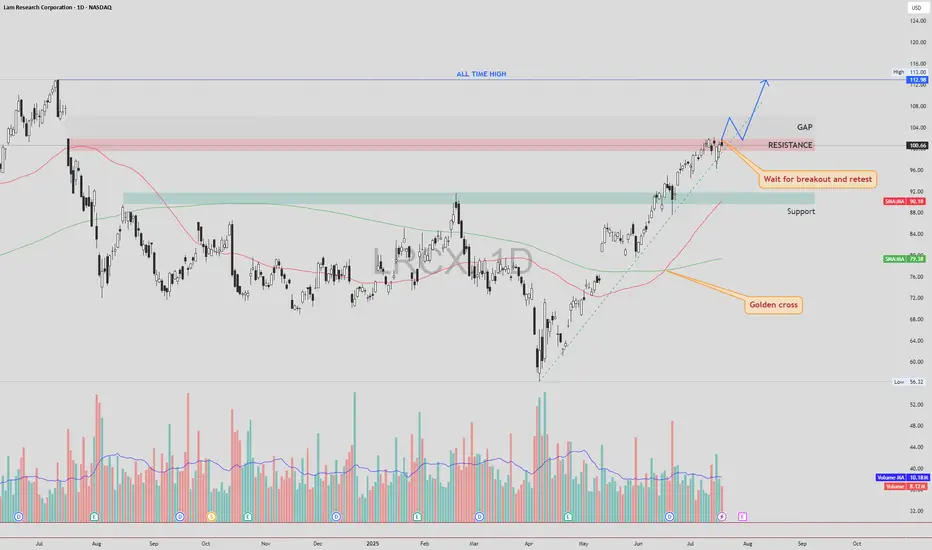
LRCX – Gap Fill First, Then Retest and Potential Move to ATHLRCX NASDAQ:LRCX is currently trading just below a key resistance zone, supported by strong bullish momentum and a confirmed Golden Cross formation.
🔍 Technical Scenario
There is a high probability that price may fill the gap above without retesting the current resistance. After the gap is filled, we could see a pullback to retest the previously untouched resistance zone (now acting as support).
If this retest is successful and holds, the structure may support a continuation move toward the All-Time High (ATH) zone.
📌 Trade Plan
Entry: Avoid chasing the breakout candle. Wait for a gap fill, followed by a clean retest of the broken resistance zone. Enter on confirmation of support holding.
Stop Loss: Place SL just below the retest zone or under the most recent higher low (structure-based stop).
Target 1: Gap fill completion
Target 2 : All-Time High (ATH), if retest confirms
⚠️ Risk Management
The gap-fill rally without retest can be volatile. Patience is key — let the price come back and confirm the breakout zone as new support.
As always, DYOR and manage your position sizing based on your risk profile.
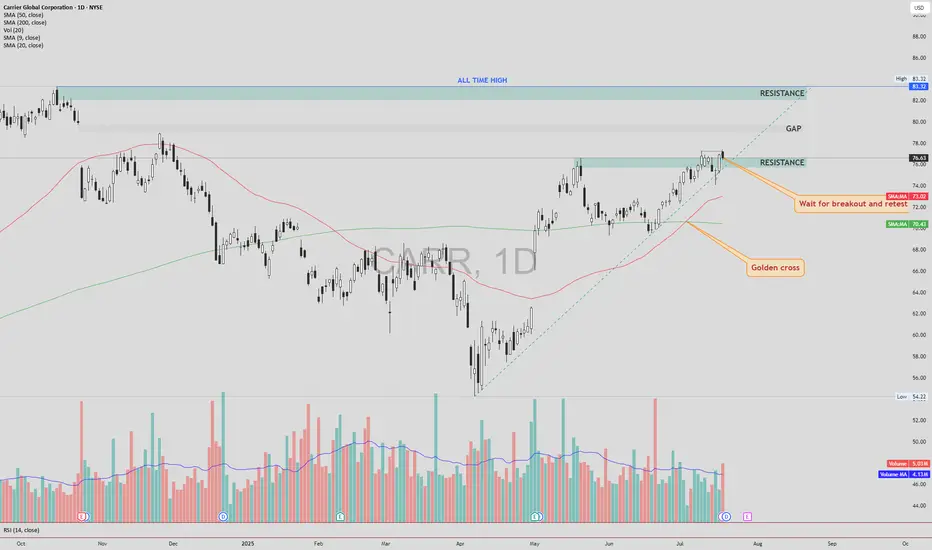
CARR – Bullish Breakout Toward Gap and ATHCarrier Global NYSE:CARR has closed above a key resistance zone near $76.50–$77.00 , indicating a possible breakout setup in progress. This move comes after a Golden Cross , where the 50 SMA crossed above the 200 SMA — a long-term bullish signal.
🔍 Technical Highlights:
✅ Golden Cross: Bullish momentum building.
✅ Breakout level: Price broke above horizontal resistance zone.
🔄 Next step: Wait for a potential retest of the breakout zone.
🔊 High volume on the breakout and retest would increase the strength and reliability of the setup.
🎯 Target Levels:
First Target (TP1): ~$80.00 — near the top of the existing gap.
Second Target (TP2): ~$83.32 — the current All-Time High (ATH).
🛡 Trade Plan:
Entry idea: After a clean retest of the breakout level with supportive volume.
Stop-loss: Below the retest zone or under 50 SMA (~$72-74 area).
Invalidation: If price falls back below resistance on high volume.
Conclusion:
CARR shows a strong breakout setup after a Golden Cross. A confirmed retest with volume could open the door toward the gap fill and new all-time highs.
DYOR – This is not financial advice.
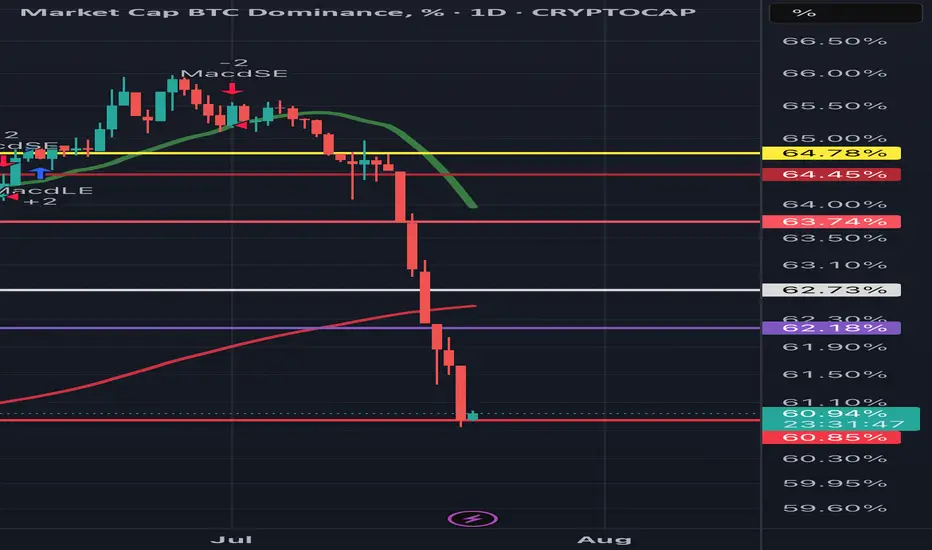
BTCDCame down and nail the first target .
Let’s see how she responds.
Really believe this the beginning of it all.
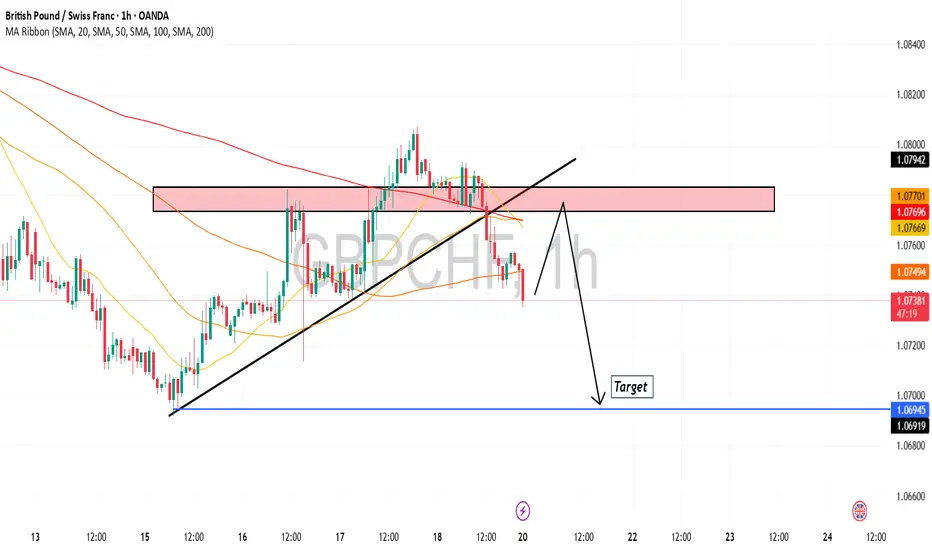
GBPCHF is Ready for a breakthroughHello Traders
In This Chart GBPCHF HOURLY Forex Forecast By FOREX PLANET
today GBPCHF analysis 👆
🟢This Chart includes_ (GBPCHF market update)
🟢What is The Next Opportunity on GBPCHF Market
🟢how to Enter to the Valid Entry With Assurance Profit
This CHART is For Trader's that Want to Improve Their Technical Analysis Skills and Their Trading By Understanding How To Analyze The Market Using Multiple Timeframes and Understanding The Bigger Picture on the Charts
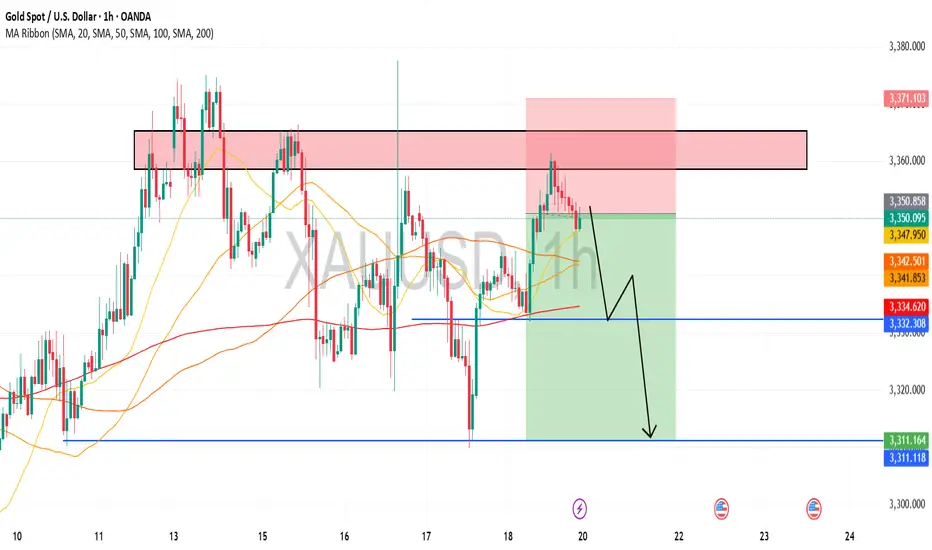
Gold is in the Bearish DirectionHello Traders
In This Chart GOLD HOURLY Forex Forecast By FOREX PLANET
today Gold analysis 👆
🟢This Chart includes_ (GOLD market update)
🟢What is The Next Opportunity on GOLD Market
🟢how to Enter to the Valid Entry With Assurance Profit
This CHART is For Trader's that Want to Improve Their Technical Analysis Skills and Their Trading By Understanding How To Analyze The Market Using Multiple Timeframes and Understanding The Bigger Picture on the Charts
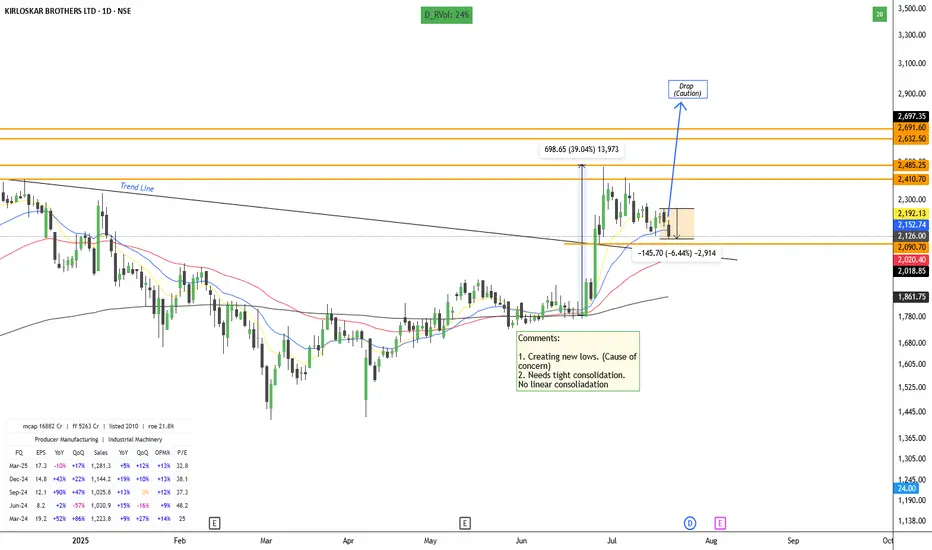
Swing TradingTighter consolidation above 2090 is needed for further movement in this stock.
I have marked all the important observations on the chart for analysis.
Drop which I have mentioned in the chart is a cause of concern.
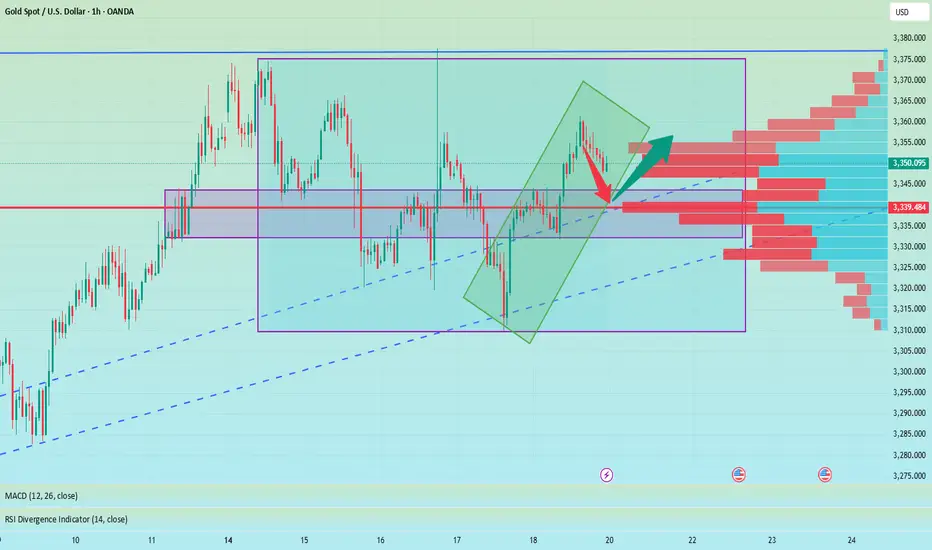
Monday market forecast, pay attention to the 3339 retracement📰 News information:
1. The Trump administration puts pressure on the Federal Reserve to cut interest rates
2. The continued impact of tariffs and the responses of various countries
📈 Technical Analysis:
This week's basic judgment and forecast on the gold market trend were consistent, but on Friday, the overall gold fluctuations were not large. The overall trend of the daily line fluctuated around 3345, and the 3345 line also became a short-term long-short watershed. Although prices are likely to rise more easily than fall in the short term, it should be noted that the three-month adjustment cycle is coming to an end while the fundamentals of the bull market have not changed. It is recommended that you focus on preventing risks from short position operations next week. At the same time, the overall strong shock pattern, the anti-pulling momentum has not reached the top suppression position, and the area around 3339 below is the previous intensive trading area, which constitutes a certain support in the short term. If the market fails to effectively break below next week, it will greatly boost the bullish momentum, and it is not ruled out that there will be a possibility of refreshing the high point near 3380 next week.
On the whole, the short-term focus next week is the 3345-3335 area below. If it falls back to this point, you can consider arranging long orders. The short-term target is 3355-3365, and the strong trend is expected to continue to touch 3375-3385.
🎯 Trading Points:
BUY 3345-3335
TP 3355-3365-3375-3385
In addition to investment, life also includes poetry, distant places, and Allen. Facing the market is actually facing yourself, correcting your shortcomings, confronting your mistakes, and strictly disciplining yourself. I hope my analysis can help you🌐.
TVC:GOLD PEPPERSTONE:XAUUSD FOREXCOM:XAUUSD FX:XAUUSD OANDA:XAUUSD FXOPEN:XAUUSD
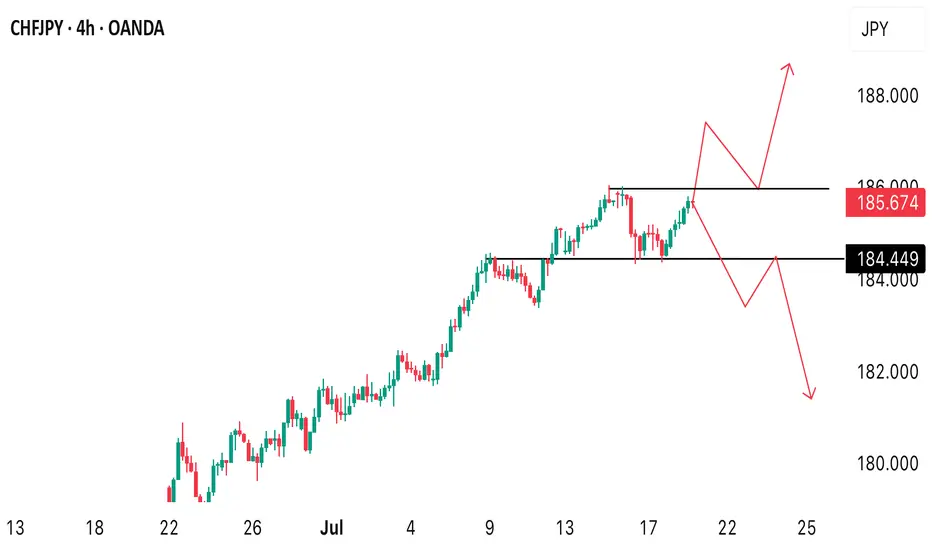
What to expect next on CHFJPYTrend remains strongly bullish from the higher timeframe. Monthly, & weekly. Daily timeframe is slightly bullish but currently loosing some momentum. Therefore, from the H4 timeframe, we’re likely to see either a break above the current resistance to form a new high or were to see a decline below the key level.
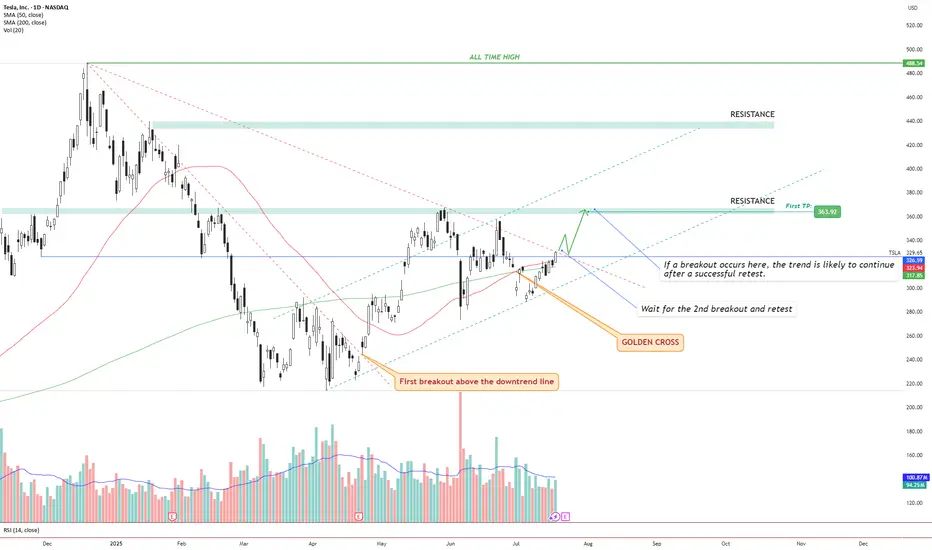
TSLA – Golden Cross + Dual Breakout Structure Targeting $363 andIdea Text:
Tesla NASDAQ:TSLA has recently printed a powerful Golden Cross , where the 50 SMA has crossed above the 200 SMA — signaling a potential long-term bullish shift in trend.
But price action shows more:
We’re observing a dual-breakout structure, where the first breakout above the long-term downtrend line has already occurred (see orange label), and the price is now approaching a critical horizontal resistance zone.
Let’s break it down step-by-step:
🔸 Step 1: Golden Cross
The 50 SMA crossed above 200 SMA — a classic signal for trend reversal. This often attracts institutional interest, especially if followed by breakout confirmation.
🔸 Step 2: First Breakout (Already Confirmed)
Price broke above the descending trendline, retested it, and maintained higher structure. This breakout initiated a shift in market sentiment from bearish to neutral-bullish.
🔸 Step 3: Second Breakout (Setup Forming)
Price is now testing horizontal resistance around $330–$335 zone. This zone also coincides with dynamic resistance from prior failed swing attempts. A successful breakout above this level, followed by a clean retest, can serve as confirmation for a bullish continuation.
🔸 Step 4: Target Setting
🎯 First TP is set at $363.92, a well-defined resistance level. If the breakout holds, next potential targets may develop around key zones such as $395 and $440, depending on price strength and continuation.
🔸 Risk Management
✅ Ideal entry after retest of breakout above ~$335.
❌ Stop-loss below the breakout level or below 50 SMA (~$315 area), depending on entry style.
🔄 Monitor volume: breakout without volume = weak move.
Conclusion:
We are watching a classic price action + moving average confluence setup. Golden Cross, breakout + retest structure, clean resistance level, and defined targets all align.
This setup is valid only with confirmation. No breakout = no trade.
⚠️ Not financial advice. DYOR.