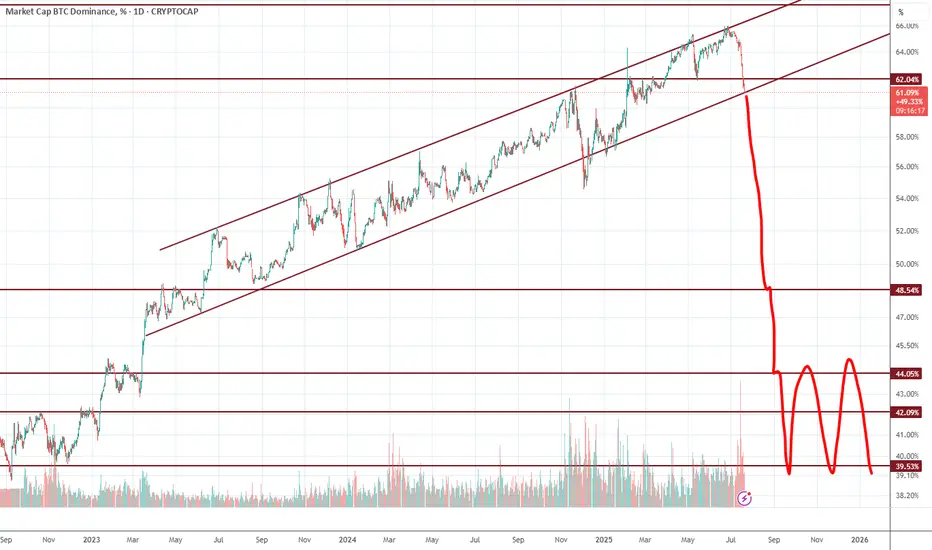
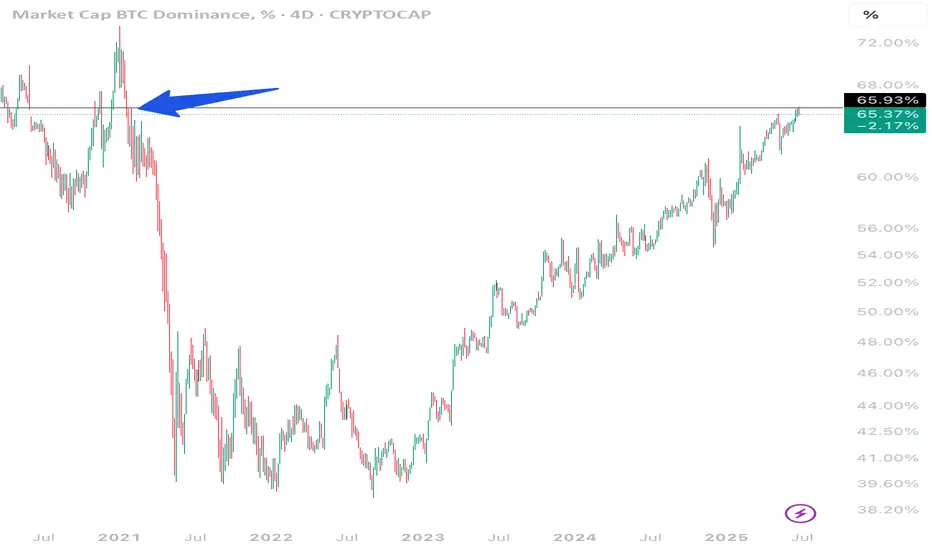
Altseason-2025: the moment of truthA long BTC.D uptrend is about to be over. The next 2 months will be altseason. Keep your altcoin bags, soon we will be rich. Don't be too greedy, don't skip a possibility to exit from the market with a profit.
Trend Lines
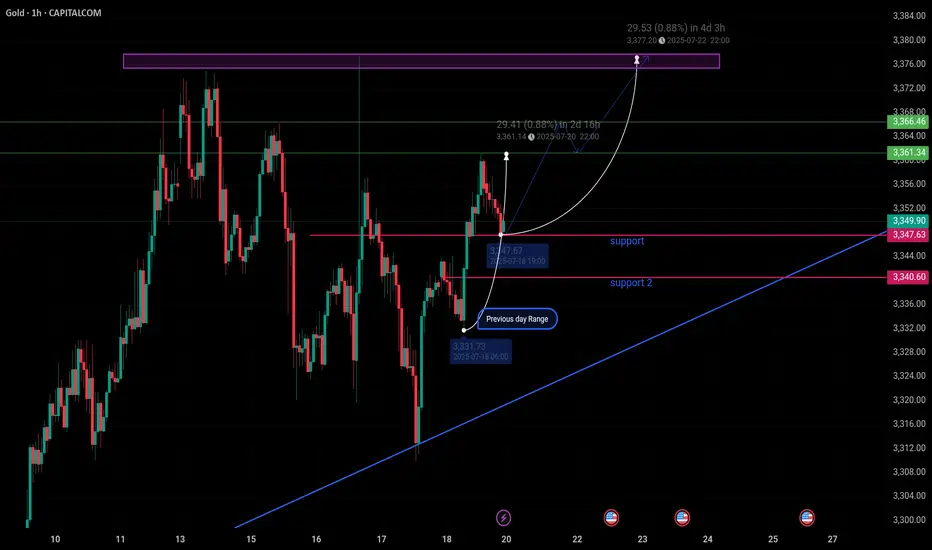
"Gold (XAU/USD) Bullish setup .. what is your opinion?This chart shows the 1-hour price action of Gold (XAU/USD) with a bullish outlook. The price is currently around $3,349.90, with marked support levels at $3,347.63 (support) and $3,340.60 (support 2). A previous day's range is highlighted near $3,331.73, acting as a key reference. The chart suggests a potential upward move toward the resistance zone between $3,361.34 and $3,377.20, with a projected price path indicated by curved white and blue arrows. If the price holds above the first support, it could continue its bullish trend toward the highlighted resistance area in the coming days
Analysis of gold market operation strategies and market trends n
Remember not to act on impulse when trading. The market is a place where you can deal with all kinds of dissatisfaction, so you must not hold orders. I believe many people have experienced this. The more you resist, the more panic you will feel. The floating losses will continue to magnify, and you will not be able to eat or sleep well, and you will miss many opportunities in vain. If you also have these troubles, then you might as well follow my pace and try to see if it can make you suddenly enlightened. If you need help, I will always be here, but if you don't even extend your hand, how can I help you?
The trend of gold on Friday was mainly oscillating upward. It can be said that gold on Friday was a volatile market, closing at 3350. If there is no stimulation from international news over the weekend, we will continue to be bullish next week. If your current gold operation is not ideal, I hope I can help you avoid detours in your investment. Welcome to communicate with us!
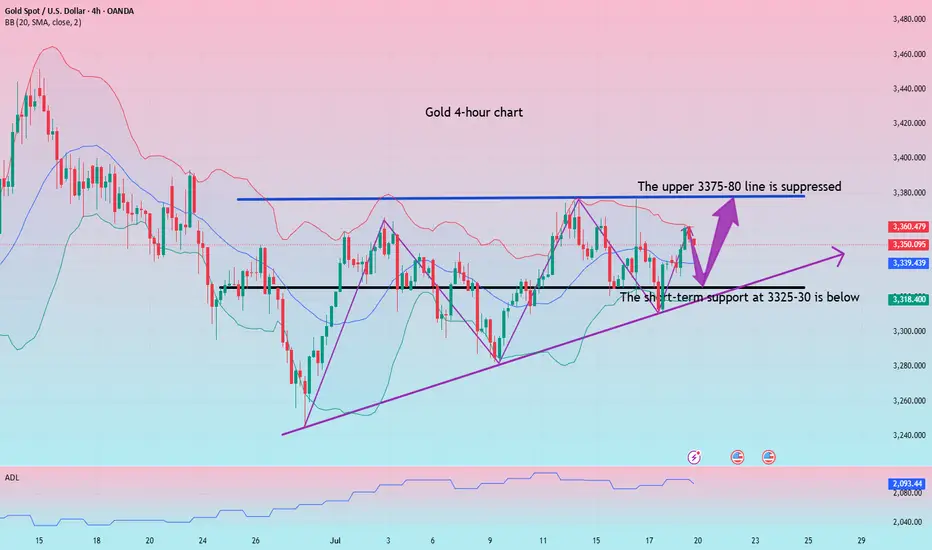
From the 4-hour analysis, the short-term support below continues to focus on the vicinity of 3340-45, the strong support is at the 3310 mark, and the key pressure above focuses on the 3380 line. First, rely on this range to maintain the main tone of high-altitude low-multiple cycles. In the middle position, watch more and do less, be cautious in chasing orders, and wait patiently for key points to enter the market.
Gold operation strategy:
Gold goes long when it falls back to the 3335-43 line, and covers long positions when it falls back to the 3320-25 line, stop loss at 3313, target 3370-75 line, and continue to hold if it breaks;
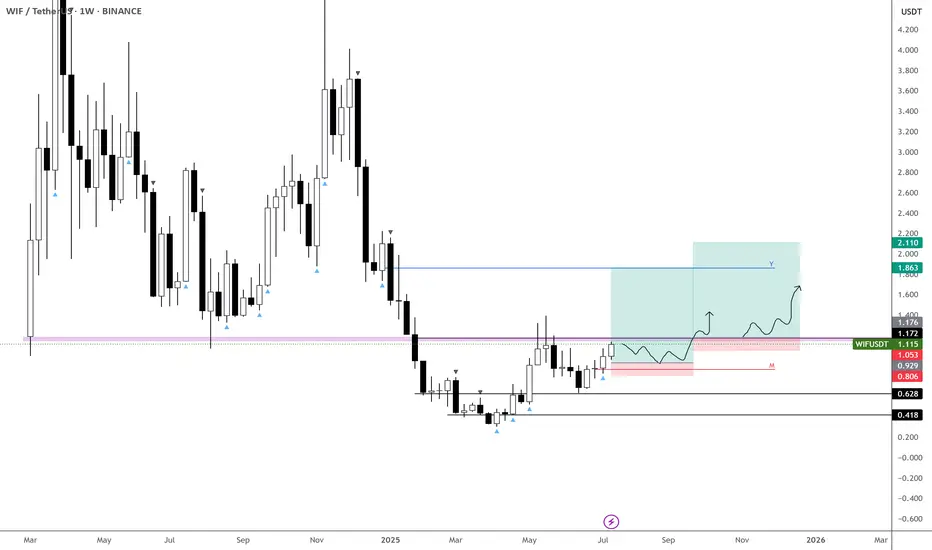
$WIF just gearing for a new ATH! Not expecting much of a retrace on BINANCE:WIFUSDT — more likely we get consolidation against resistance.
This current level is crucial, and likely to form the base for either:
• A new ATH, or
• At minimum, a third retest of the $4.5–5 zone.
The broader market continues to push higher, and with Bitcoin Dominance breaking down, things could get very interesting in the coming months.
📌 Plan:
• Waiting on a clean retrace (as per second entry... previous post)
• Or a reclaim of the purple block to add to the position
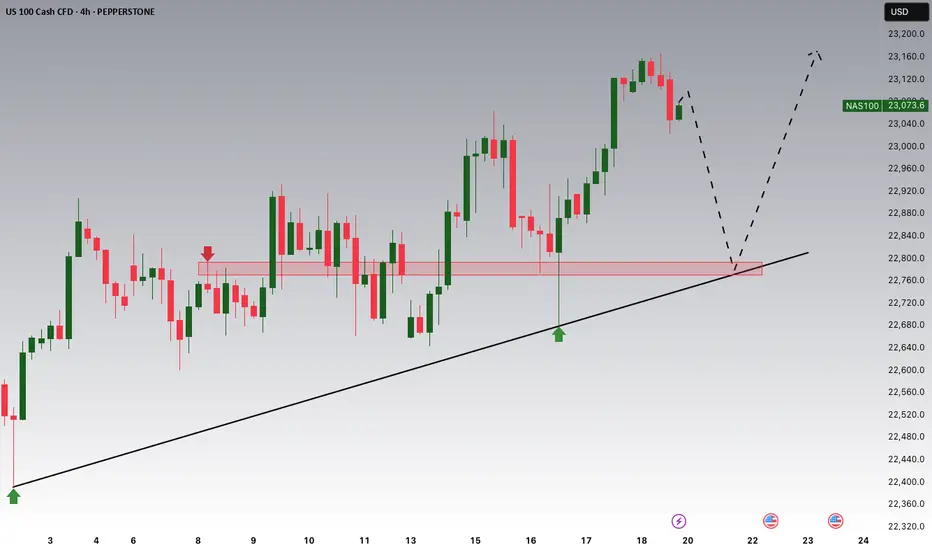
NASDAQ Potential UpsidesHey Traders, in tomorrow's trading session we are monitoring NAS100 for a buying opportunity around 22,780 zone, NASDAQ is trading in an uptrend and currently is in a correction phase in which it is approaching the trend at 22,780 support and resistance area.
Trade safe, Joe.
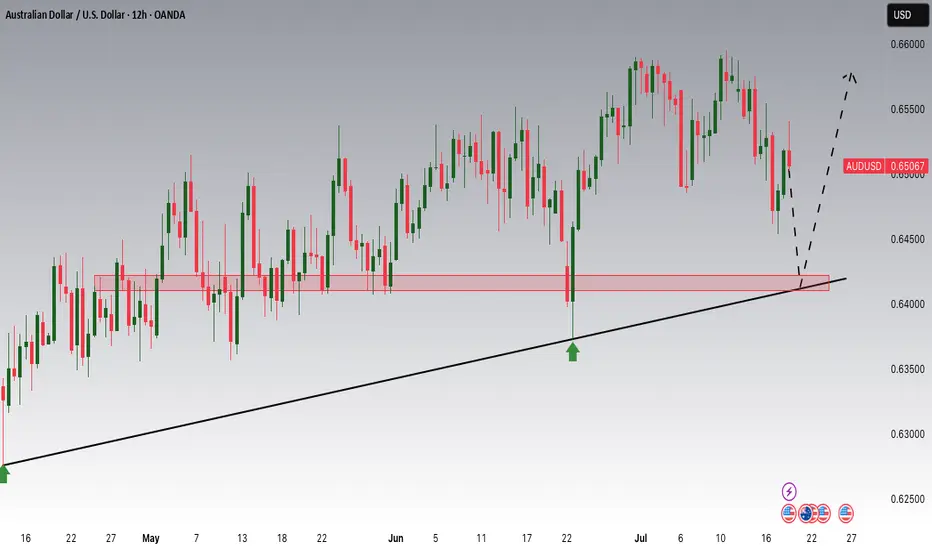
AUDUSD Potential UpsidesHey Traders, in tomorrow's trading session we are monitoring AUDUSD for a buying opportunity around 0.64200 zone, AUDUSD is trading in an uptrend and currently is in a correction phase in which it is approaching the trend at 0.64200 support and resistance area.
Trade safe, Joe.
It's over for BTC Dominance, benjamin cowen is wrong hereAlt rally time :) . it will be incredibly hard to overcome this resistance on the chart. Don't listen to benjamin cowen at this point, he is too bullish on btc still. Cya in a few weeks when he changes his mind.
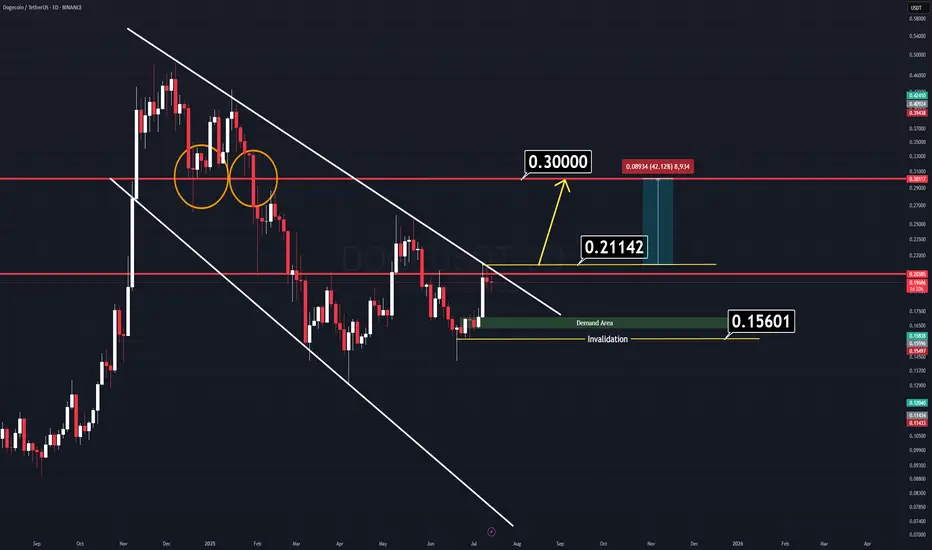
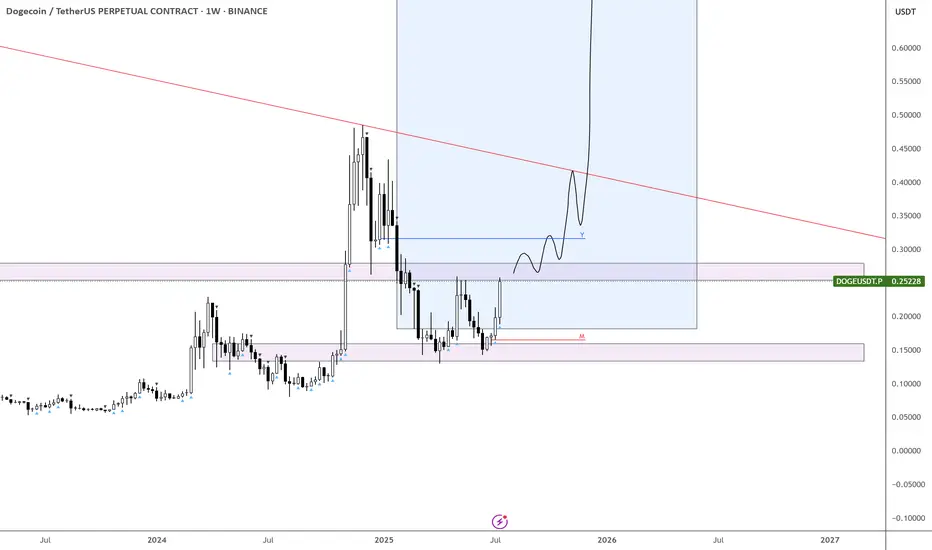
DOGE Analysis (3D)There’s a very simple and clear chart setup on Dogecoin (DOGE) right now.
We have two major horizontal key levels and a channel that is about to break down. If the price manages to close above the yellow-marked line ($0.21142), we can expect a strong rally to follow.
There’s no need for complicated indicators cluttering the screen — all relevant levels are clearly marked on the chart.
Two Logical Entry Approaches:
1️⃣ Breakout Entry: Enter on a confirmed breakout. (Waiting for a daily candle close on a memecoin might slightly reduce your profit range, but it’s the safer approach.)
2️⃣ Demand Zone Entry: Wait for the price to retrace to the green demand zone — though this scenario seems less likely for now.
A combined approach can work best: enter on breakout, use the horizontal levels as support, and set a tight stop-loss to manage risk.
Good Luck.
HelenP I. Gold will little correct and then rise to top of wedgeHi folks today I'm prepared for you Gold analytics. If we look at the chart, we can see a clear ascending wedge pattern that has been guiding the price action. The structure is well-defined by a lower trend line providing consistent support and an upper resistance line. I believe that the key area to watch right now is the support zone between 3310 and 3295 points. The logic is that after the recent push, the price may undergo a small, healthy correction to test this zone's strength. The condition for our bullish scenario to unfold is a successful hold of this support; a bounce or signs of buyer interest in this area would be the confirmation we are looking for. Once this condition is met, I believe that gold will have enough momentum to continue its upward movement within the confines of the wedge. Therefore, the main goal for this scenario is set at 3415 points. This target is not arbitrary; it directly coincides with the resistance line of the wedge, which represents a logical point for the current upward swing to conclude. If you like my analytics you may support me with your like/comment.❤️
Disclaimer: As part of ThinkMarkets’ Influencer Program, I am sponsored to share and publish their charts in my analysis.

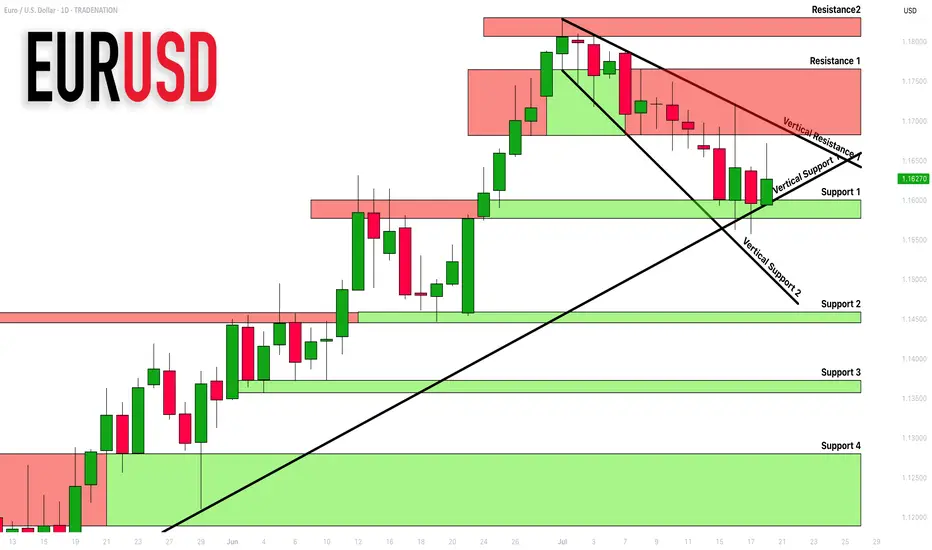
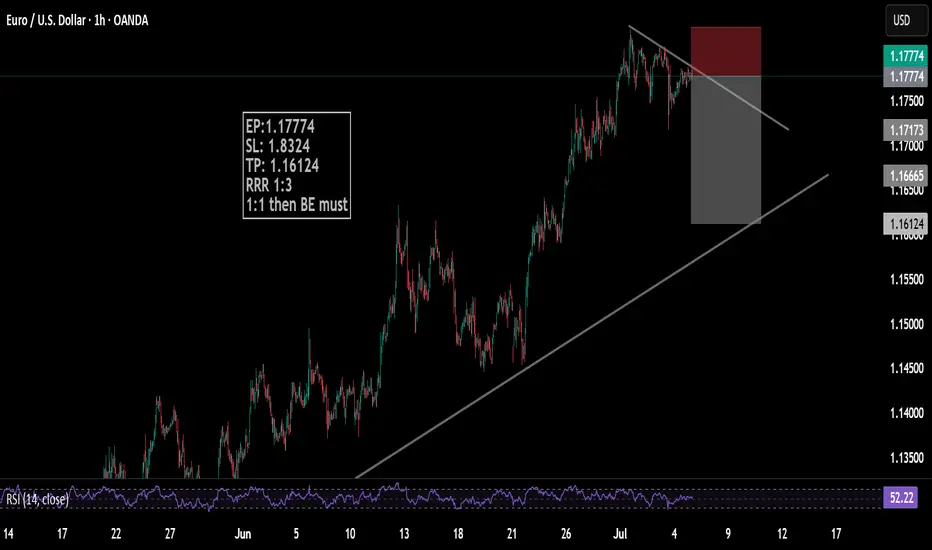
EURUSD: Support & Resistance Analysis For Next Week 🇪🇺🇺🇸
Here is my latest structure analysis and important supports/resistances
for EURUSD for next week.
Consider these structures for pullback/breakout trading.
❤️Please, support my work with like, thank you!❤️
I am part of Trade Nation's Influencer program and receive a monthly fee for using their TradingView charts in my analysis.
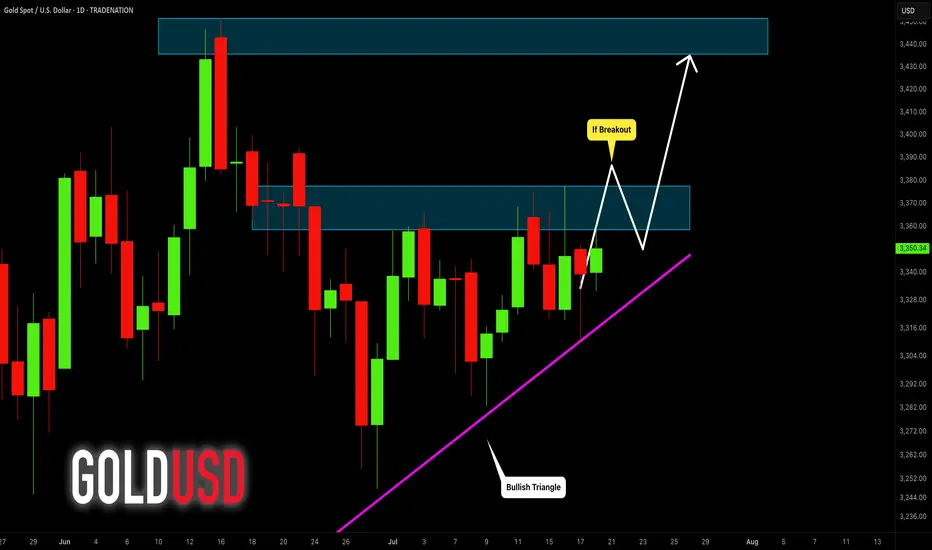
GOLD (XAUUSD): Sticking to the Plan
Update for my last Sunday's post for Gold.
Previously, we spotted a cup & handle pattern on a daily time frame.
It turned into an ascending triangle pattern - another bullish formation this week.
I am sticking to the same plan - our strong bullish signal is a breakout
of a neckline of the pattern and a daily candle close above 3378.
It will confirm a strong up movement.
❤️Please, support my work with like, thank you!❤️
I am part of Trade Nation's Influencer program and receive a monthly fee for using their TradingView charts in my analysis.
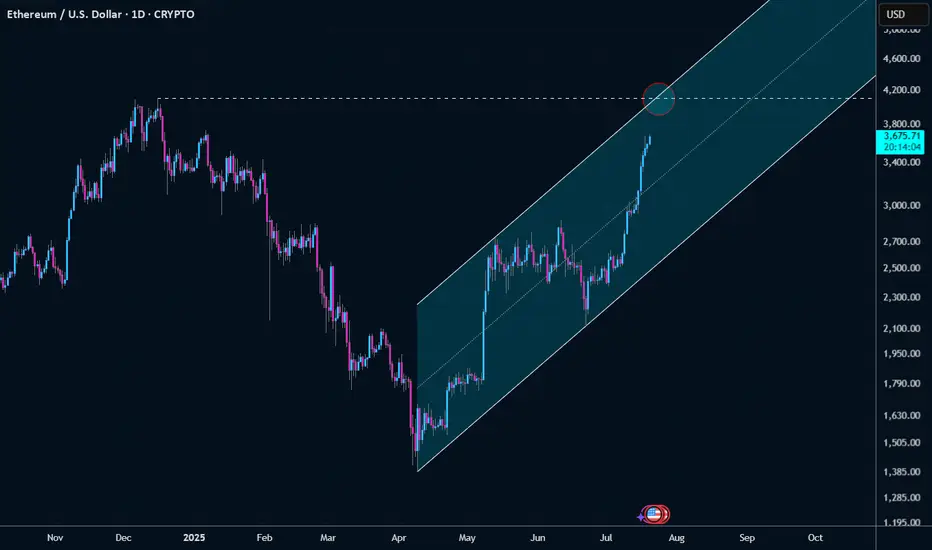
+4K Incoming FastI think ETH just melts up from here to ~4100 short term high. We're seeing inflows into the ETH ETFs that are larger than the BTC ETF inflows now.
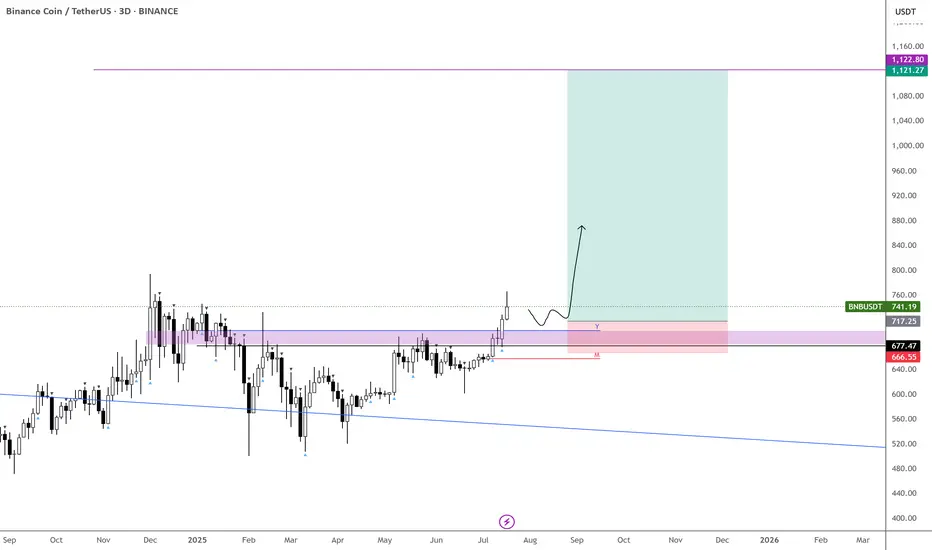
$BNB Is ready for $1k USDLow 700s before continuation?
This one’s been coiling up beautifully — still waiting on that strong move to hit.
OKX:CATUSDT and BINANCE:CAKEUSDT are part of the rotation I’m betting on.
BINANCE:BNBUSDT has one of the strongest consolidation structures among high caps — and it’s also one of the biggest laggards.
Looks like a setup worth the risk.
$1 in the Horizon for $DOGE!We’ve got something interesting brewing on CRYPTOCAP:DOGE right now:
Monthly trend is active
Uptrend in place for over a year (not relying on that timeline, but historically, targets hit within it)
If we can get above $0.30 and hold, the path to $1 opens up for the first time.
Other similar charts are also aligning for exponential moves, setting up to break out of multi-year consolidation patterns.
Keep a close eye on CRYPTOCAP:XLM as well — it’s shaping up with a very similar structure.
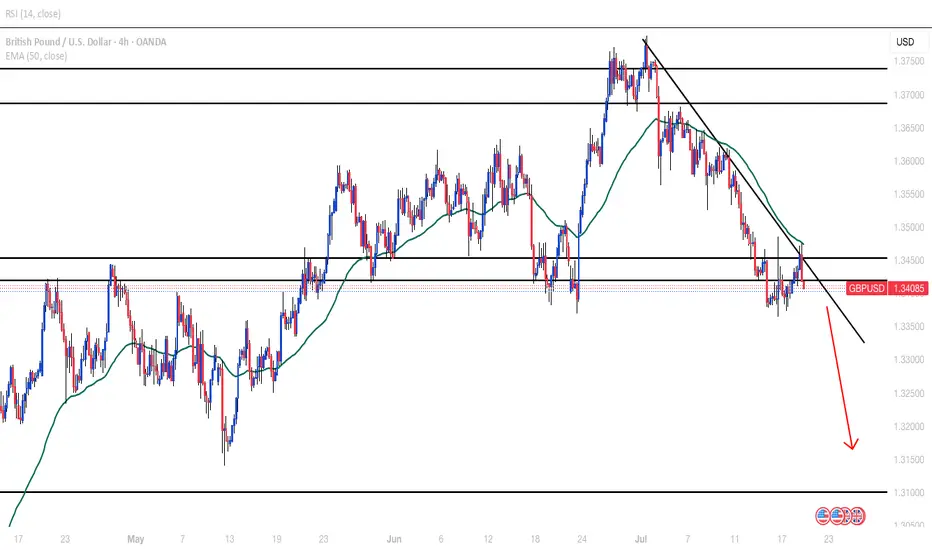
GBPUSD POSSIBLE TREND CHANGE?Reached a strong weekly resistance and pushed down. Broke daily/H4 support. Retesting zone with 50EMA rejection. Looking at 1.32500 as 1st target
ETHETH has poised for more bullish movement to the upside we are currently at a demand zone in confluence with a fibonnaci and also sma in line with the level if it should hold we might see eth rally into 3800 per coin and 4600 per coin

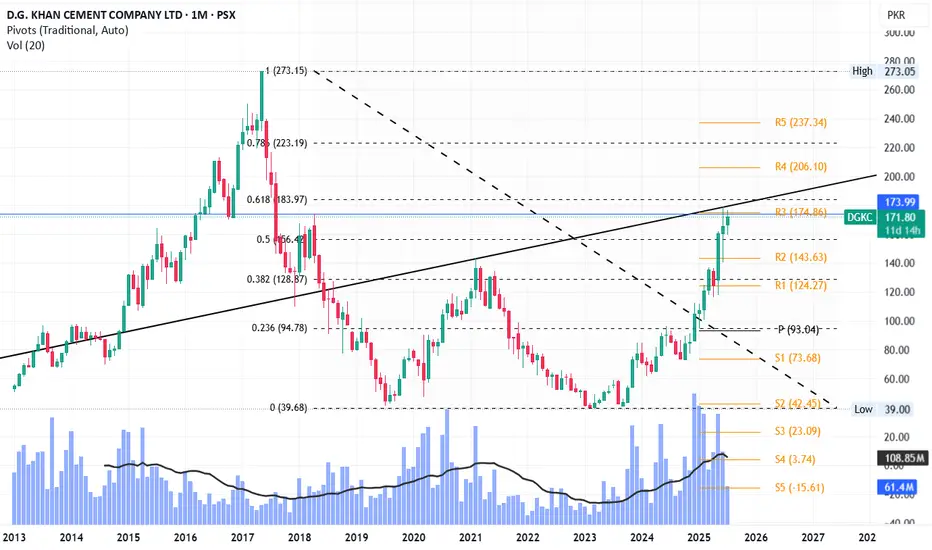
DGKC LongCurrently the trendline and previous resistance level (173 - 179) are stopping it from going upward.
Fib 0.618 level is also near (184) which will be again a major hurdle before it goes further up towards 223 and 273.
However, RSI, MACD and Stoch are fine that suggest no extreme pressure for the price to go downwards yet.
INIL LongRSI, MACD and Stoch, all are giving buy signal.
INIL has tested its monthly support 1 twice, forming a small W which is a bullish pattern.
It is trending above its monthly pivot (174).
Currently, the trendline is stopping it and breaking it will not only make it retest its R1 (212) but also 250 (R2) soon.
Volumes are not supporting though but once it breaks the trendline, we may witness volumes as well.
Its my personal opinion, not a buy / sell call.

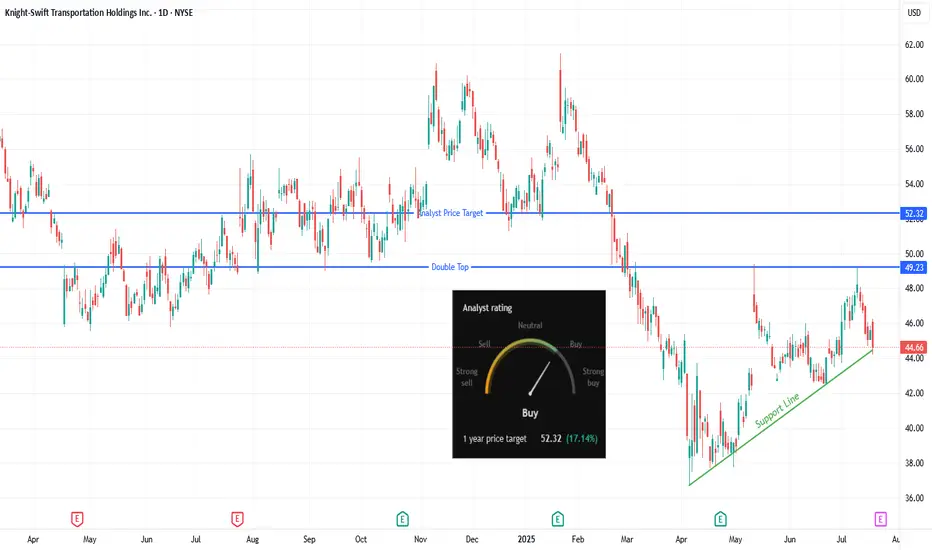
Can KNX Challenge Resistance with Analyst Support?Trade Summary 📝
Setup: KNX building higher lows above rising support; testing multi-month resistance zone.
Entry: Watching for long entry on a break above $46.26.
Stop-loss: Below $44.20 (just under trendline support).
Targets: $49 (near double top resistance), $52.32 (analyst price target).
Risk/Reward: Attractive with defined risk and upside to multiple levels.
Technical Rationale 🔍
Rising trendline support shows bulls steadily defending higher.
Price compressing just below a prior pivot/high—breakout could spark new momentum.
Double top at $49 offers a logical first target; further room if bulls push to analyst target at $52.
Catalysts & Context 🚦
Analyst 1-year price target sits at $52.32 (+17%), with a “Buy” consensus rating.
Trucking/transport sector showing signs of rotation after long weakness.
Upcoming earnings and macro data could act as catalysts for a move.
Trade Management Plan 📈
Entry: On confirmed break and close above $46.26.
Stop-loss: Just below $44.20 support.
Scaling: Trim at $49 (double top area); hold runners for $52.32 if momentum continues.
What’s your move on KNX?
🔼 Bullish—Breakout incoming
🔽 Bearish—Resistance will hold
🔄 Waiting for confirmation
*** Follow us now to ensure you don't miss the next big setup ***
Disclaimer ⚠️: Not financial advice. Trade at your own risk and always use stops.
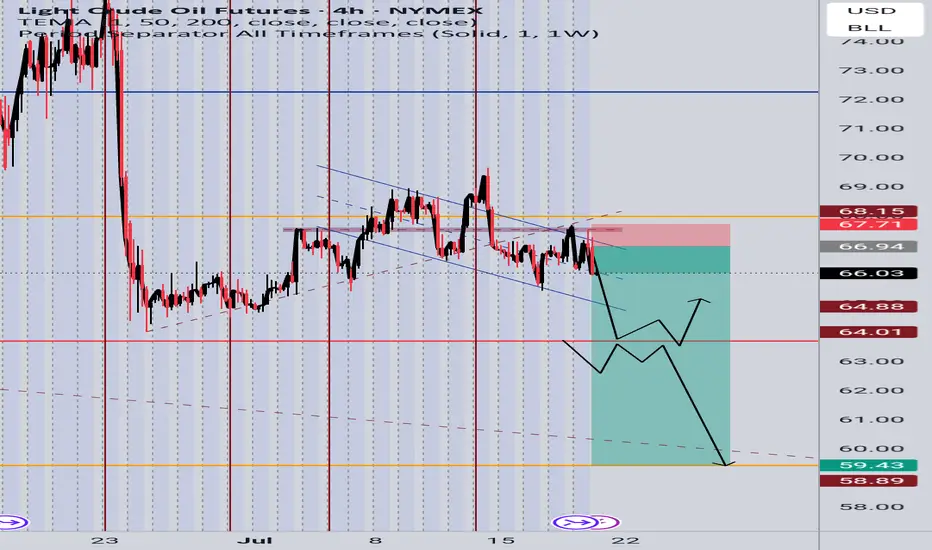
Light Crude Oil Futures (CL1!) - Potential Bearish Continuation Price is currently respecting a descending channel after rejecting the 68.00–68.15 resistance zone. We've observed:
A strong bearish impulse breaking key structure.
Retest of a previous support now acting as resistance (66.94)
Downside targets around 64.00, and possibly extending to the 59.50–58.90 support zone.
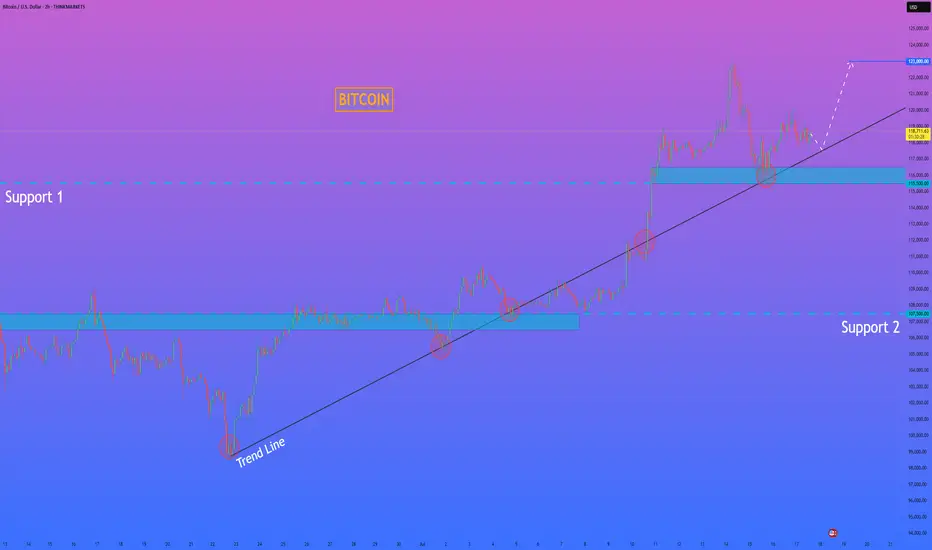
HelenP. I Bitcoin will correct to trend line and then start riseHi folks today I'm prepared for you Bitcoin analytics. The price has been trading in a strong bullish structure, clearly respecting the ascending trend line since the rebound from the 107500 level. Each time the price touched the trend line, it formed a higher low and continued the upward movement. After breaking through the important Support 1 zone (115500–116500), BTC made a strong impulse upward and reached a local high above 122000 points. Currently, the price is making a pullback and moving closer to the trend line again. This area has previously acted as a major point of interest for buyers, and now it's expected to play a key role once more. The support zone and trend line are converging, which makes this level critical for the next move. I believe BTCUSD will bounce from this area and continue its bullish momentum. My goal is set at 123000 points. Given the market structure, higher lows, and strong reaction from the support zones, I remain bullish and expect further growth from current levels. If you like my analytics you may support me with your like/comment ❤️
Disclaimer: As part of ThinkMarkets’ Influencer Program, I am sponsored to share and publish their charts in my analysis.
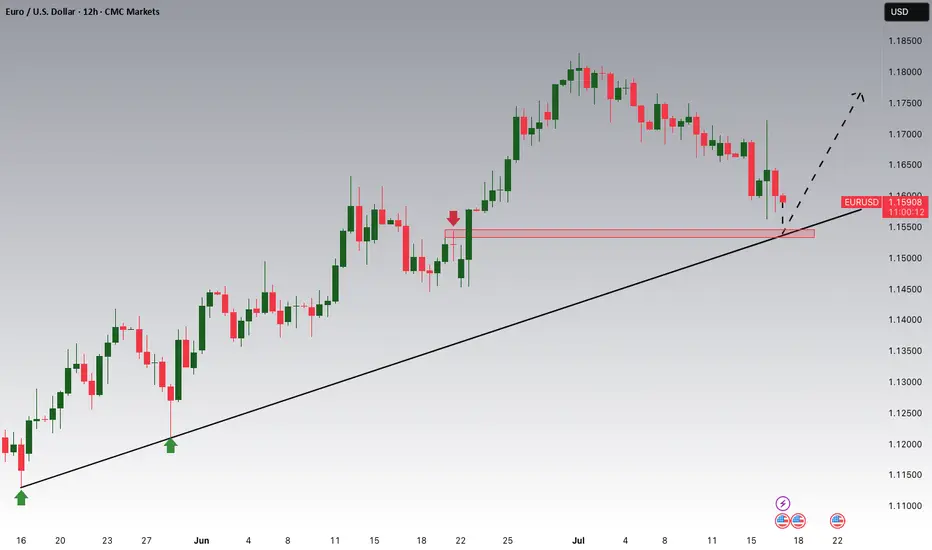
EURUSD is Nearing an Important Support!!Hey Traders, in today's trading session we are monitoring EURUSD for a buying opportunity around 1.15400 zone, EURUSD is trading in an uptrend and currently is in a correction phase is in a correction phase in which it is approaching the trend at 1.15400 support and resistance area.
Trade safe, Joe.