How to seize deterministic trading opportunities?The rebound momentum of the gold market has been significantly enhanced today. After breaking through the 3345 resistance in the Asian session, it has continued to rise. It has now reached around 3360, and has rebounded by more than US$50 from this week's low of 3310, setting a new rebound high in the past three trading days. After the gold price effectively broke through the key resistance band of 3340–3350, it triggered some short stop loss trading and trend funds to enter the market, driving the price to accelerate the upward trend. Judging from the hourly chart, the trading volume has increased by about 30% compared with the same period yesterday, indicating that the market's recognition of this round of rebound has increased significantly.
A physically full sun candle chart has been closed in the 4-hour cycle, successfully standing on the Bollinger middle track, further confirming the upward structure, the mid-track support area 3340–3345 has become a key position for bulls' defense, and the short-term structure of the market is still relatively strong. Overall, the intraday retracement range of gold is limited, and the probability of continuing to rise is relatively high. In terms of strategy, it is still recommended to go long. In the short term, focus on the 3340–3345 area retracement support, and the stop-profit target is 3365–3370; if the upward breakthrough, pay attention to the suppression performance of the 3370–3375 line, beware of highs and falls, and pay attention to controlling risks.
Trend Lines

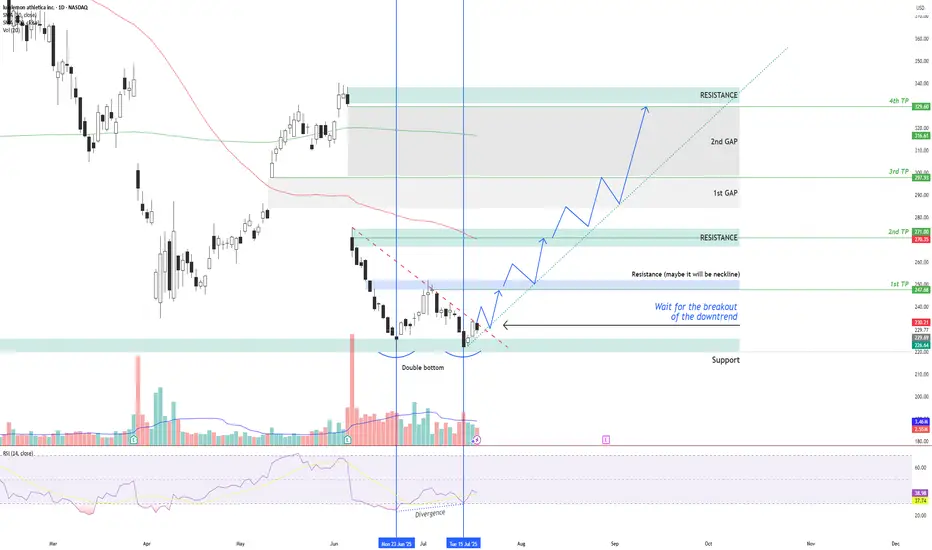
LULU – Double Bottom + RSI Divergence: Multi-Target Setup After LULU NASDAQ:LULU is showing signs of a potential bullish reversal after forming a double bottom structure around the $220 support zone , along with a bullish divergence on the RSI indicator.
Two vertical lines highlight the divergence: while price made a lower low, RSI formed a higher low – indicating a possible momentum shift in favor of buyers.
Currently, price is moving just below a descending trendline, which has been acting as dynamic resistance. The first condition for a long setup is a confirmed breakout above this trendline followed by a successful retest. If that happens, an entry can be considered .
📌 Entry Plan:
Entry: After a breakout and retest of the descending trendline.
1st TP: ~$247 — This level coincides with a local resistance zone, which may act as a neckline of the double bottom.
If price breaks above $247 and retests, it confirms bullish continuation.
📈 Target Structure:
2nd TP: ~$271 — next major resistance zone.
3rd TP: ~$297 — aligns with the first major gap zone.
4th TP: ~$329 — final gap resistance from previous sell-off levels.
This structure allows for scaling into the trade in stages — each breakout and retest offers a new confirmation and extension to the next target zone.
Volume analysis, price action, and RSI momentum all support the probability of a trend reversal — but confirmation is key.
Not financial advice. Always conduct your own research and risk management.
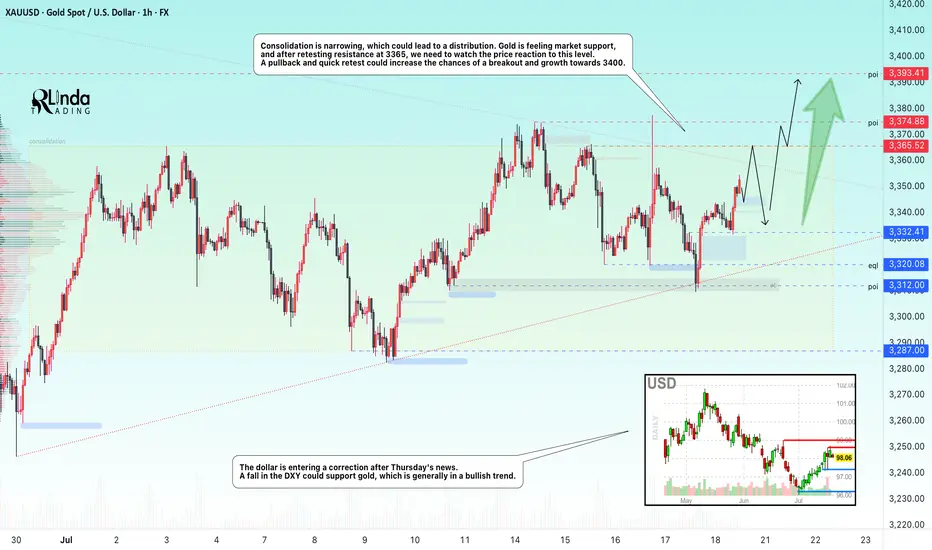
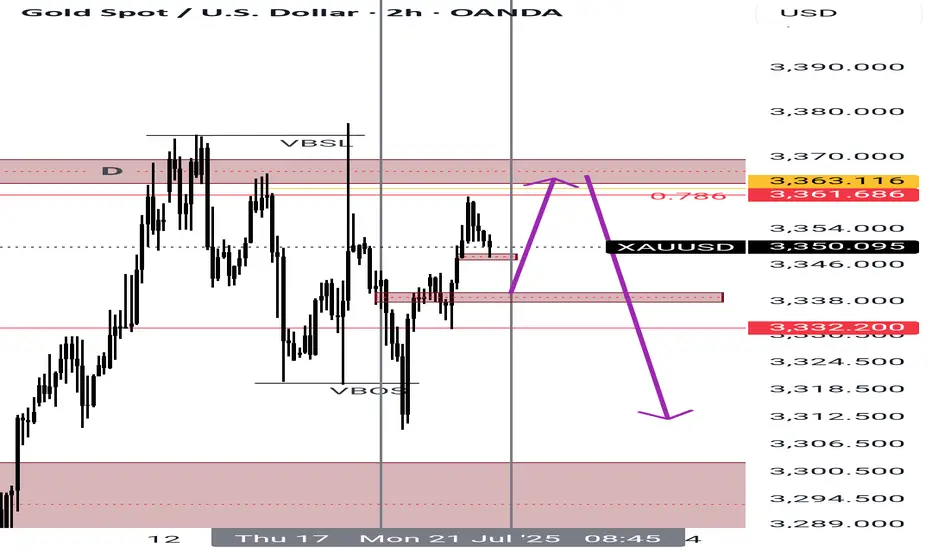
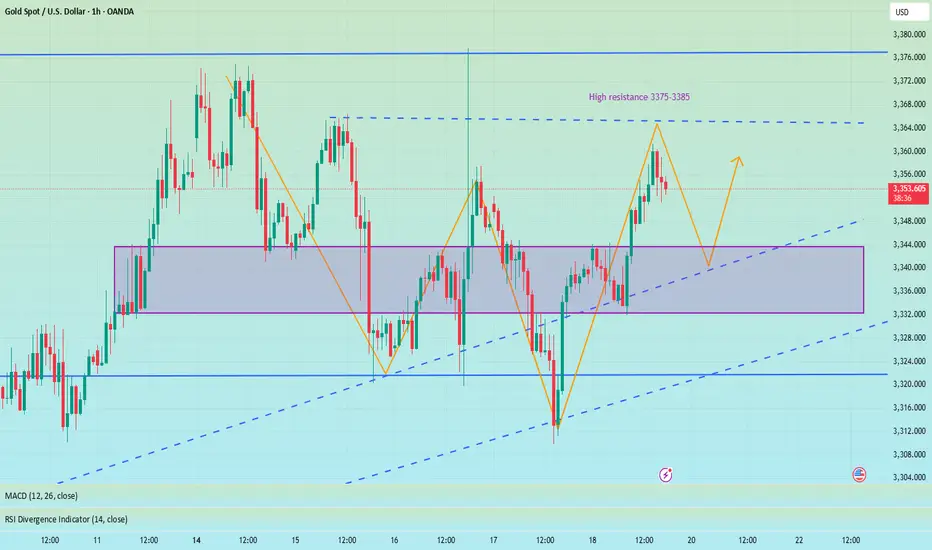
GOLD → Retest of consolidation resistance. Chances of a breakoutFX:XAUUSD bounces off support at 3312, forming a false breakdown at 3320. The price is heading towards consolidation resistance. The chances of continued growth are increasing...
Gold rebounded from its low amid statements by Fed member Waller about a possible rate cut in July. However, strong US sales and labor market data strengthened the dollar and held back XAU/USD growth. Despite statements by some Fed members about maintaining a tight policy, traders continue to expect rate cuts before the end of the year. The focus is on new economic data that could affect the dollar and gold prices.
Technically, consolidation is narrowing, which could lead to distribution. Gold is feeling market support, and after retesting resistance at 3365, we need to watch the price reaction to the level. A pullback and quick retest could increase the chances of a breakout and growth to 3400.
Resistance levels: 3365, 3375
Support levels: 3332, 3320, 3312
There is a high probability that there will be an attempt to break through the consolidation resistance amid expectations of a rate cut. This phase may be accompanied by either a correction to retest and return for a breakout, or a breakout and consolidation of the price above the level. Today, Friday, I expect a retest and correction, as there may not be enough local potential for a breakout of this level, and the price has already lost some of its momentum since the opening of the session...
Best regards, Linda!
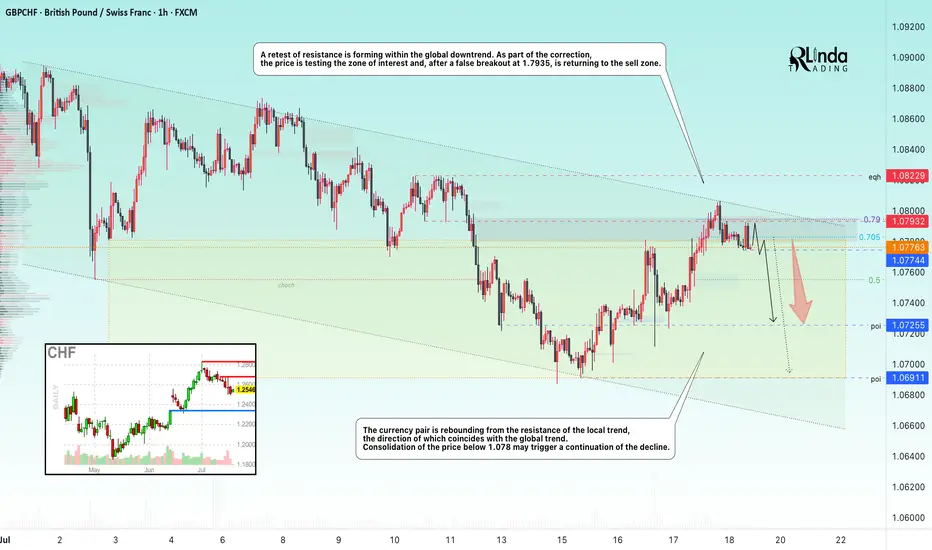
GBPCHF → Retest of resistance to the global downtrendFX:GBPCHF is facing resistance from the local trend, which is aligned with the global bearish trend. The trend may continue...
A retest of resistance is forming within the global downtrend. As part of the correction, the price is testing the zone of interest and, after a false breakout of 1.7935, is returning to the selling zone.
The currency pair is rebounding from the resistance of the local trend, which coincides with the global trend. Consolidation of the price below 1.078 may trigger a continuation of the decline
Resistance levels: 1.07932, 1.0823
Support levels: 1.07744, 1.07255
Price consolidation in the selling zone followed by a break of the local structure could strengthen the bearish sentiment, which could trigger a further decline overall.
Best regards, R. Linda!
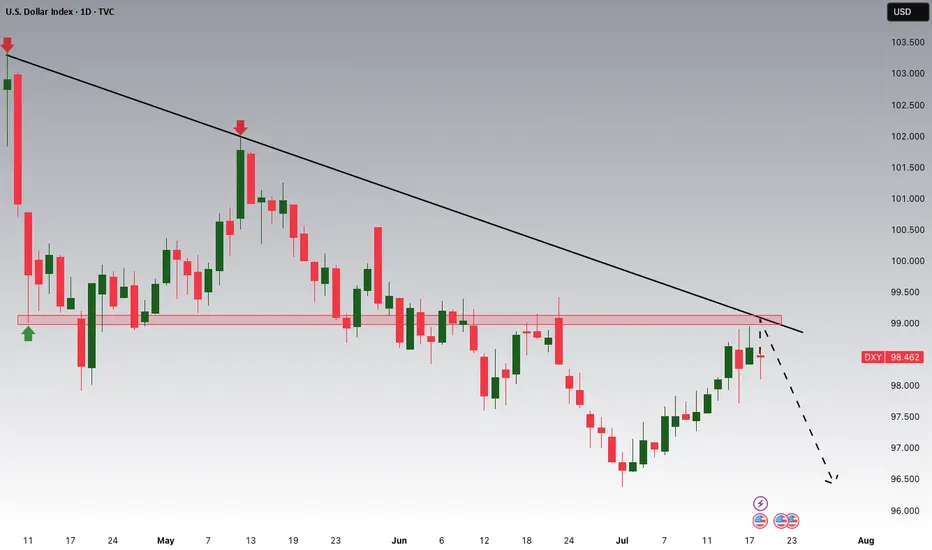
DXY Potential DownsidesHey Traders, in the coming week we are monitoring DXY for a selling opportunity around 99.000 zone, DXY is trading in a downtrend and currently is in a correction phase in which it is approaching the trend at 99.000 support and resistance area.
Trade safe, Joe.
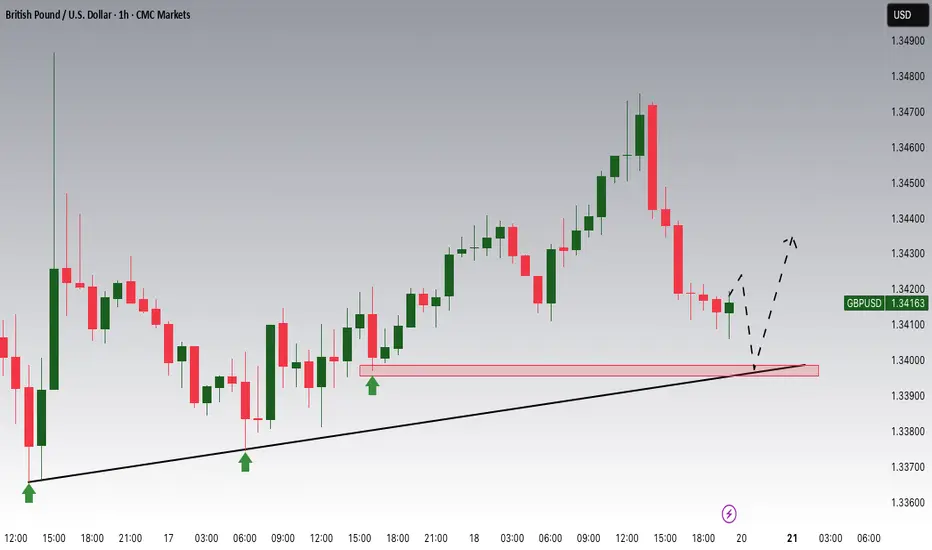
GBPUSD Potential UpsidesHey Traders, in today's trading session we are monitoring GBPUSD for a buying opportunity around 1.33900 zone, GBPUSD is trading in an uptrend and currently is in a correction phase in which it is approaching the trend at 1.33900 support and resistance area.
Trade safe, Joe.
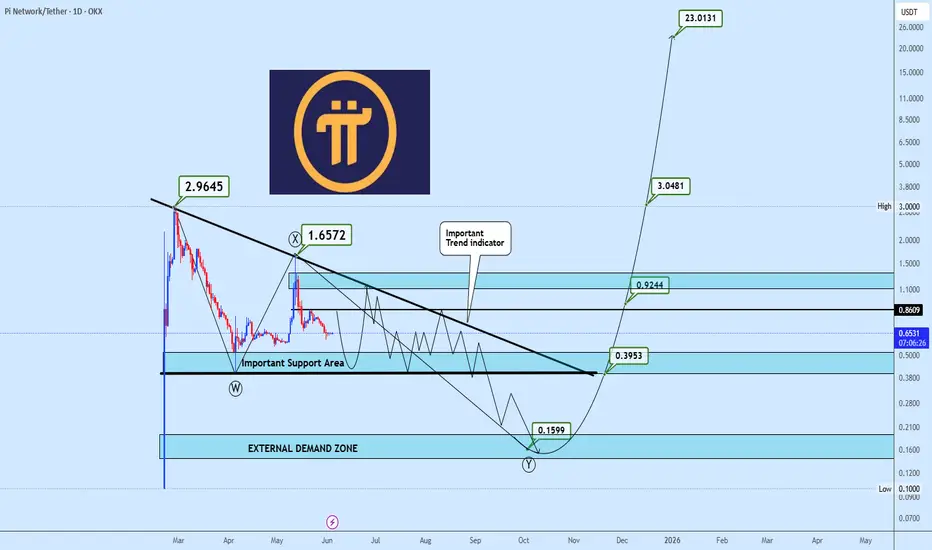
PIUSDT Range Play Within a Potential Descending TriangleAfter reaching a high of $2.9645, PIUSDT has experienced a sharp decline, establishing a base near the $0.38 zone. This base continues to hold, suggesting the formation of a potential descending triangle.
For now, the strategy is to trade the range while the structure matures. A break below $0.38 would likely trigger further downside toward $0.16, where a strong external demand zone aligns with the completion of a possible WXY corrective formation.
On the flip side, a breakout above the upper trendline of the triangle would be a strong bullish signal, potentially igniting a significant rally. Upside targets are already projected on the chart.
As the structure develops, all eyes remain on the key levels that will determine the next major move.
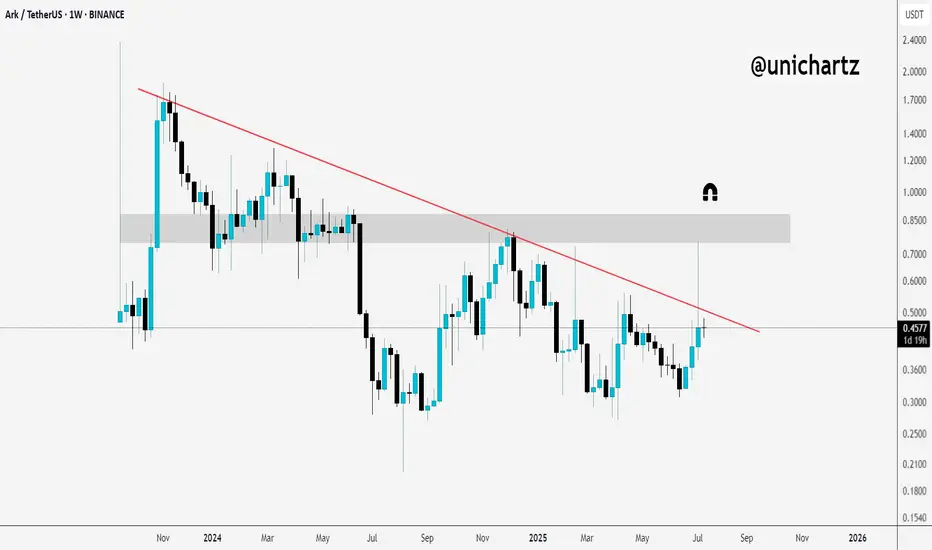
Potential Breakout Setup on ARK/USDT$ARK/USDT Weekly Outlook
Price is currently trading just below the trendline resistance.
If we get a clean breakout and weekly close above it, there’s a good chance we’ll see a move toward the marked resistance zone above.
Add this one to your watchlist — it’s heating up.
DYOR, NFA
XAUUSD ANALYSISWe are waiting for the price to come to our zone demand where we look for buy UpTo the level of supply zone where we look for sell entry .
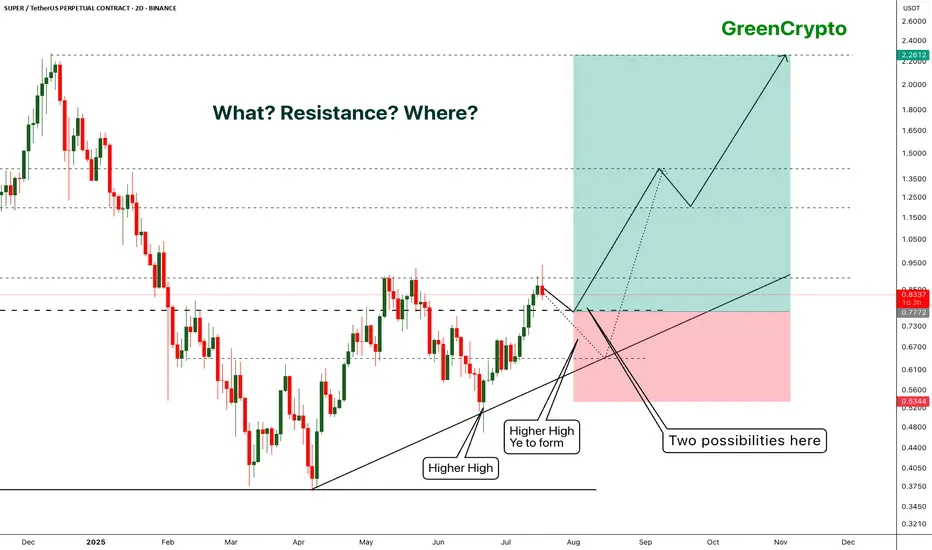
SUPER - Getting ready for the super run- Price is trading near the resistance after forming higher high.
- it's highly likely that price will get rejected around the resistance and will form another higher high.
- this is an excellent opportunity for us to enter the trade.
Entry Price: 0.7322
Stop Loss: 0.5344
TP1: 0.8939
TP2: 1.0517
TP3: 1.2867
TP4: 1.6336
TP5: 2.2243
Max Leverage 5x.
Don't forget to keep stoploss.
Support us by Liking and following.
Thanks and Cheers!
GreenCrypto
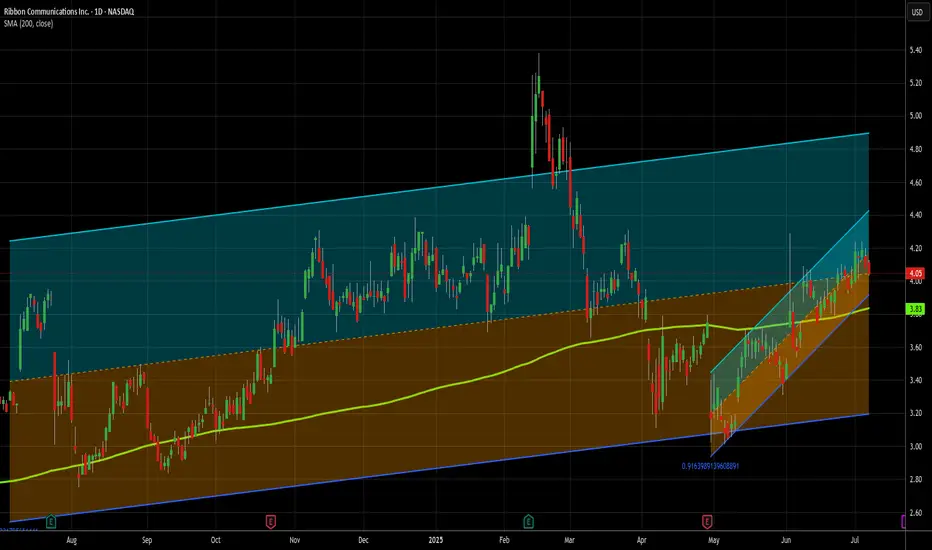
Small cap is the flavor of the day - Long at 4.05I decided to do a small cap stock today. I don't use too many of these as ideas, though I do trade them on my own. I don't usually publish about them because they are inherently more risky than large cap, established stocks. And to be fair, RBBN has a spotty history from a chart perspective.
Go ahead and zoom on out all the way. See that? That's what danger looks like. This stock has lost 80% of its value in the last 10 years, and 50% in the last 4. However, in its defense, it is profitable on a reported earnings basis over the last 12 months, and has held its own for several years now, and that's why I'm not AS nervous as I might otherwise be publishing this.
Additionally, it's solidly above its 200MA and in both a 1 year and 2 month uptrend, so its recent strength is good. I haven't dug down all the way back to its debut, but I suspect I'd have at the very least had a challenge making money on this one over its entire existence. But I am not trading its entire existence today. 75% of the trades in this stock in the last year would have closed in under 2 weeks, so the short term picture is what I'm mostly looking at here, and over the last month or so this has been a very solid stock. Could that change tomorrow? Yup. But I don't have that crystal ball. All I can do is rely on the system that has of late produced excellent results here.
In the last 12 months, there have been 27 buy signals here. 25 closed profitably and 2 are still open and down 18% and 9%, respectively. INCLUDING the losers, however, the median daily return on those trades has been .48% (>10x the market avg) and the average daily return is 1.02% (> 23x the avg daily market return).
Trading is about balancing risks and rewards. This stock is riskier than most, but the rewards are a lot better, too. I don't put all my money into any one trade - that's a TERRIBLE idea. The vast majority of my open trades are relatively safe, large cap stocks. But risky has its place in a portfolio. I made 15% in 2 days recently on QUBT (I posted that trade here) and made almost 18% on NUTX in the last 2 days - just closed that trade today. As a % of my portfolio of trades, ones like that can be small positions, but make a meaningful impact. That's my hope for RBBN here.
Of the 25 winning trades in the last year, over half produced a gain of 4% or more. And the average holding periods of the winners was only 8 days, with 15 of the 25 closing in a week or less. That rapid return also reduces the risk in a stock like this one. Wnen you only stick around for a few days most of the time, it's harder (not impossible) to get caught holding the bag during a drop.
My close will be signal based, and not a particular price target, but the trades I referred to above on RBBN give a good outline. However, the 2 losers have been open since February, so be forewarned that IF you follow me on this one, you might need to buckle your chinstrap. It could get bumpy.
As always - this is intended as "edutainment" and my perspective on what I am or would be doing and why, not a recommendation for you to buy or sell. Act accordingly and invest at your own risk. DYOR and only make investments that make good financial sense for you in your current situation.
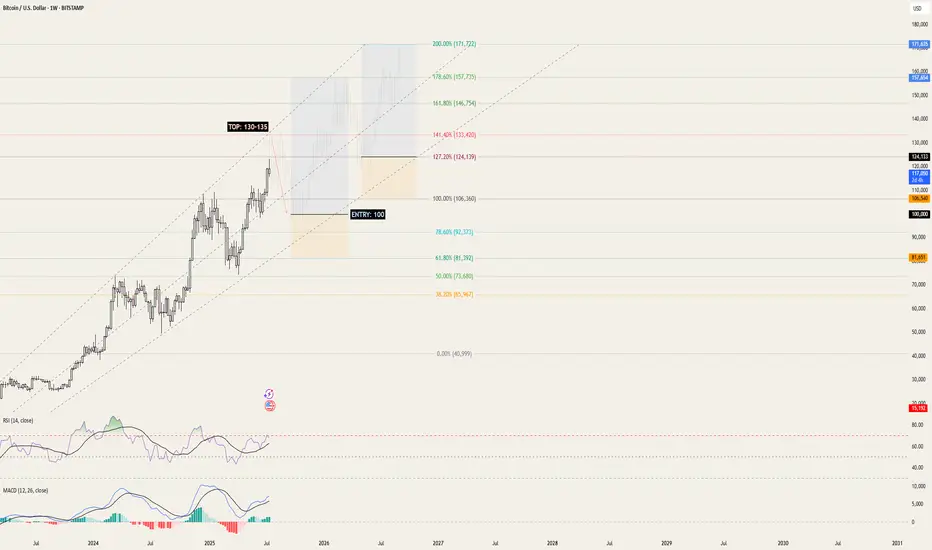
BTC/USD | 2025 Top = 130k | 2026 Top = 170k+Continuing the current upwards trajectory, using Fibonacci trend analysis, we'll reach BTC's peak for 2025 @ 130-135k within the next few months.
By the end of the month / beginning of 2026, BTC will be back to 100k - this is where this strategy begins.
Enter @ 100k between the 78.6% and 100% Fibonacci levels, setting a comfortable SL down to the 61.8% Fibonacci level @ 80k. Over the course of 3-6 months we'll then reach the first peak of 2026 at the 178.6% level @ 150-160k . Close.
From this point, timelines rely purely on consistency, however considering Bitcoin's adoption and rate of growth, an upwards trend is guaranteed.
We wait for price retraction down to 120-125k near the lower 127.2% Fib level and enter. SL down at 100% Fib level @ 100-105k. Next peak for 2026 is 170k and above , possibly creating a top @ 200k.
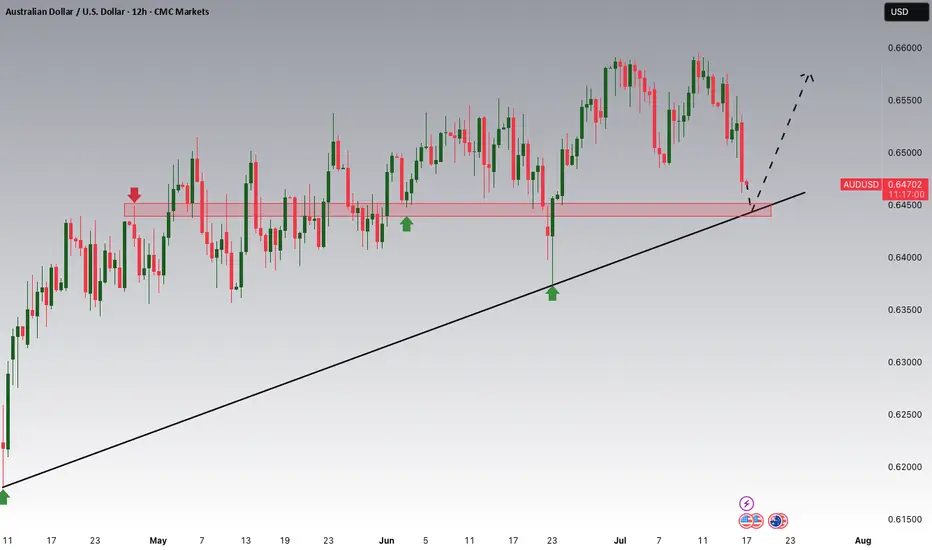
AUDUSD Potential UpsidesHey Traders, in today's trading session we are monitoring AUDUSD for a buying opportunity around 0.64500 zone, AUDUSD is trading in an uptrend and currently is in a correction phase in which it is approaching the trend at 0.64500 support and resistance area.
Trade safe, Joe.
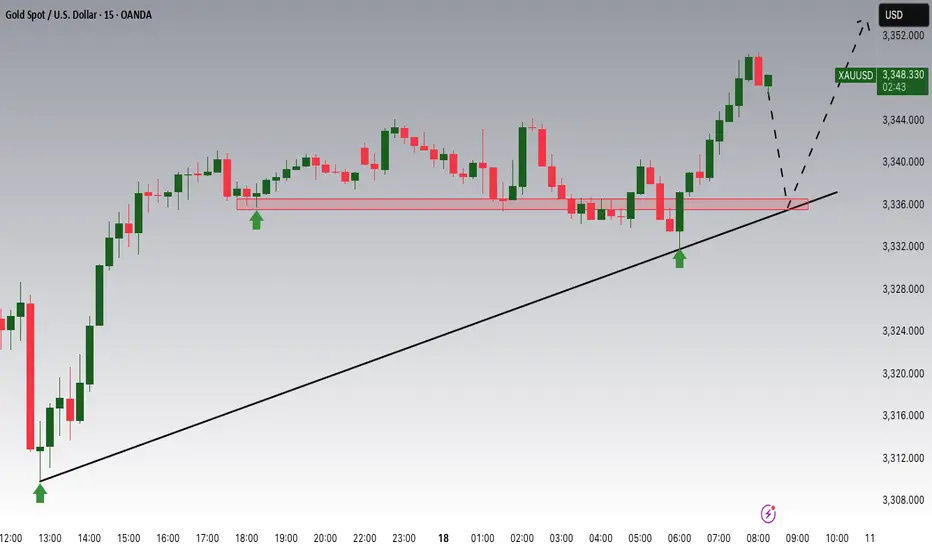
Gold Potential UpsidesHey Traders, in today's trading session we are monitoring XAUUSD for a buying opportunity around 3,336 zone, Gold is trading in an uptrend and currently is in a correction phase in which it is approaching the trend at 3,336 support and resistance area.
Trade safe, Joe.
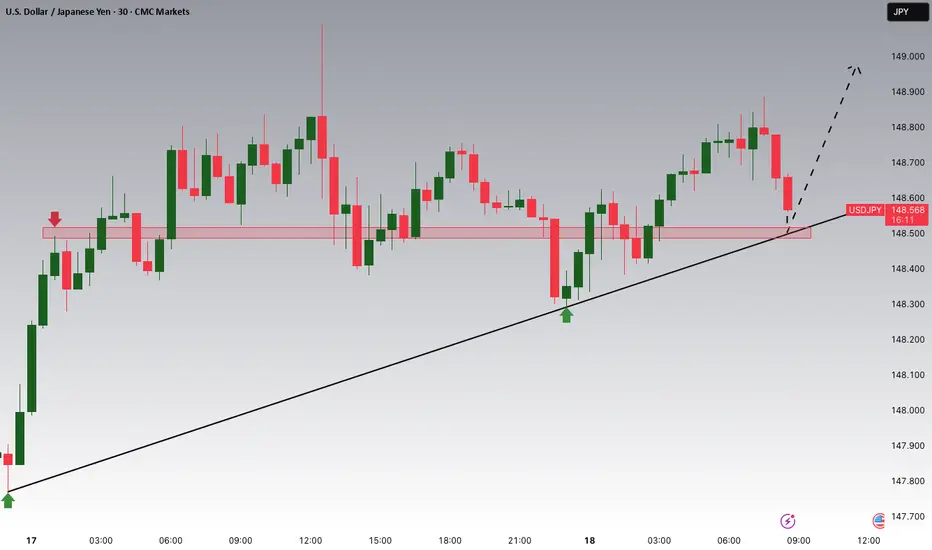
USDJPY Potential UpsidesHey Traders, in today's trading session we are monitoring USDJPY for a buying opportunity around 148.500 zone, USDJPY for a buying opportunity around 148.500 zone, USDJPY is trading in an uptrend and currently is in a correction phase in which it is approaching the trend at 148.500 support and resistance area.
Trade safe, Joe.
#EURUSD: Last Bullish Price Extension! Get Ready! EURUSD is approaching our buying zone, a key level, which suggests a smooth bullish reversal. As this is a swing trade, we advise keeping stop losses larger. There are two targets to keep an eye on. Remember, this is not a guaranteed move, and this is just our overview. Good luck and trade safely.
Team Setupsfx_
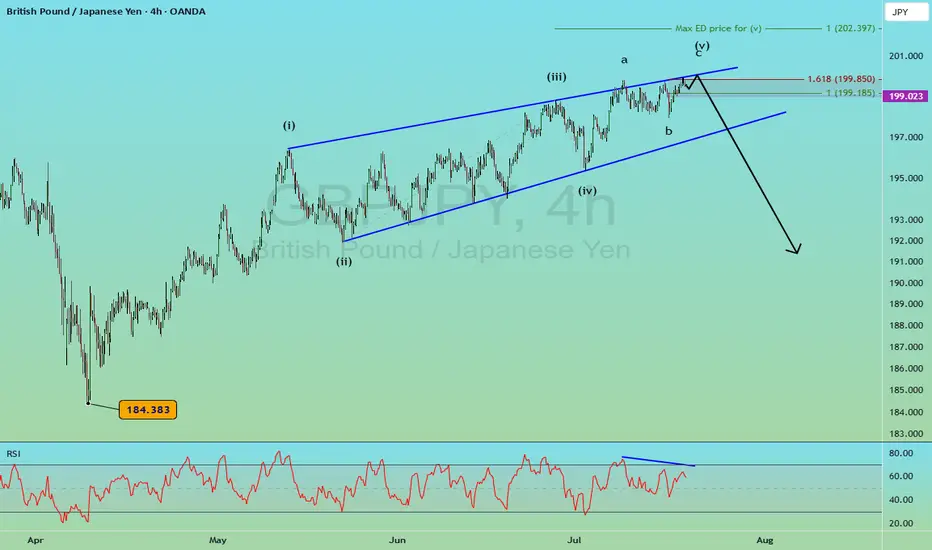
GBPJPY Large Reversal Pattern [Elliott Wave]Executive Summary:
GBPJPY shaping a diagonal pattern.
Large bearish reversal could push down to 184.
Above 202.40 voids the pattern as labeled.
I typically don't conduct Elliott wave analysis on cross pairs simply because they are the children of the two main currencies involved. GBPJPY is the child of GBPUSD and USDJPY.
With that said, I still scroll through charts looking for compelling patterns and GBPJPY caught my attention.
First, it's knocking on the door of 200...a nice round number.
Secondly, the rally from 184 in April to now appears to be a very mature Elliott wave ending diagonal pattern .
Diagonals shape in 5 waves. Remember, wave 3 cannot be the shortest of waves 1,3,5. Since wave 3 is shorter than wave 1, that means wave 5 cannot be longer than wave 3.
So we simply measure out wave 3 and apply it to the end of wave 4, and, voila, we have a maximum target for wave 5 at 202.40 .
That maximum target doesn't mean GBPJPY has to go that high, but this market is ripe for a large bearish turn. If GBPJPY does push above 202.40, then my wave labeling is incorrect.
Ending diagonals tend to be fully retraced which implies a decline back to 184 ... 1500 pips from today's price.
GBJPY may dance around in the 199 handle for a day or two.
A break below 199 could be an early warning signal of the bearish reversal. A break below the blue support trend line helps confirm the pattern.
If this bearish reversal takes hold, then GBPUSD or USDJPY likely experiences a large decline too.
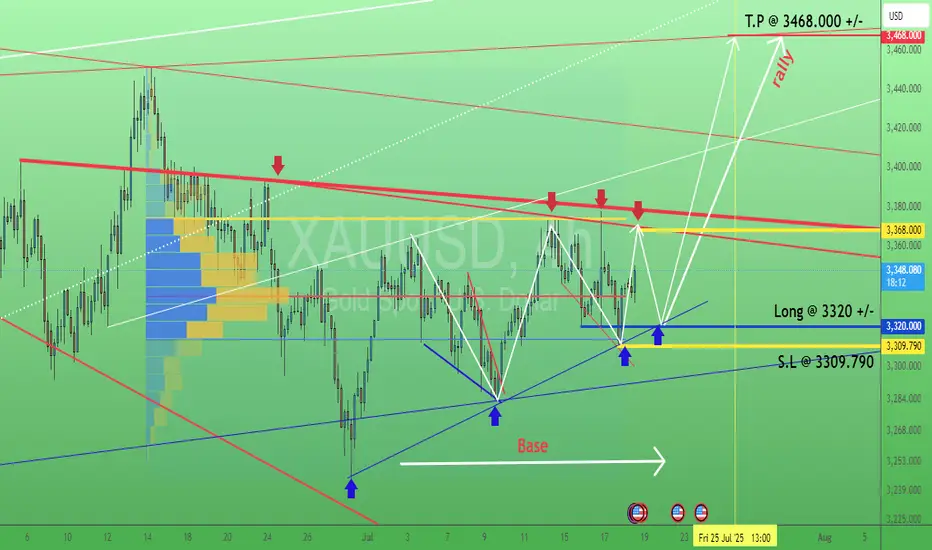
Gold. Swing trading signal. 18/July/25XAUUSD probably still ranging within 3309 - 3368 before breakout to the upside...targeting still around 3460 +/-
PEPE Faces Key Resistances – Is a -8% Pullback Coming?The PEPE memecoin ( BINANCE:PEPEUSDT ) is currently near the Resistance zone($0.00001392-$0.00001330) and Important Resistance lines . This is the third time that PEPE has attacked the Important Resistance lines .
In terms of Elliott wave theory , it seems that PEPE is completing the microwave 5 of the main wave 3 , so that the main wave 3 is of the extended type .
Also, we can see the Regular Divergence(RD-) between Consecutive Peaks.
I expect a -8% drop for PEPE in the coming hours.
First Target: $0.00001251
Second Target: $0.00001212
Note: Stop Loss(SL)= $0.00001400
Please respect each other's ideas and express them politely if you agree or disagree.
PEPE Analyze (PEPEUSDT), 4-hour time frame.
Be sure to follow the updated ideas.
Do not forget to put a Stop loss for your positions (For every position you want to open).
Please follow your strategy and updates; this is just my Idea, and I will gladly see your ideas in this post.
Please do not forget the ✅' like '✅ button 🙏😊 & Share it with your friends; thanks, and Trade safe.

Long and short fluctuations, the market is waiting for a break📰 News information:
1. Powell responds to White House issues
2. Will other countries impose reciprocal sanctions on tariffs?
📈 Technical Analysis:
Although the MACD indicator of the gold hourly line formed a golden cross, the market reached a high of around 3361, and the RSI indicator was close to the overbought area, so we need to be cautious about corrections. From the 4H chart, the MACD second golden cross is on the zero axis. Currently, we are paying attention to the moving average SMA5 near 3343, and the SMA60 support line 3332. If the 4H upward trend falls back, we need to go long. At present, gold is still running above, and there is no good participation point in the short term, but on the whole, we should pay attention to the support of 3345-3332 below, and we can consider going long if it retreats and stabilizes. We continue to pay attention to the resistance pressure of 3375-3385 above, and we can try to go short if it does not break.
🎯 Trading Points:
SELL 3375-3385
TP 3365-3355
BUY 3345-3332
TP 3365-3375-3385
In addition to investment, life also includes poetry, distant places, and Allen. Facing the market is actually facing yourself, correcting your shortcomings, facing your mistakes, and exercising strict self-discipline. I share free trading strategies and analysis ideas every day for reference by brothers. I hope my analysis can help you.
FXOPEN:XAUUSD OANDA:XAUUSD FX:XAUUSD FOREXCOM:XAUUSD PEPPERSTONE:XAUUSD TVC:GOLD
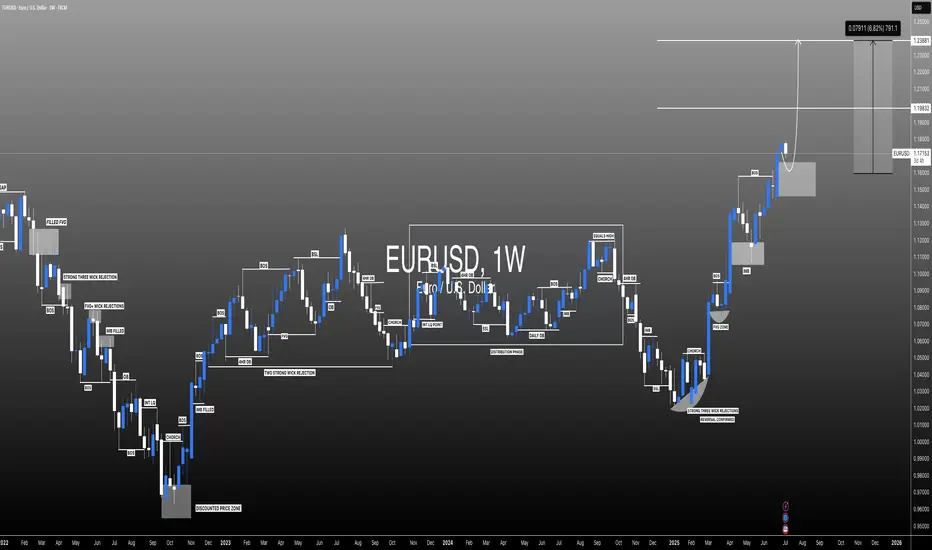
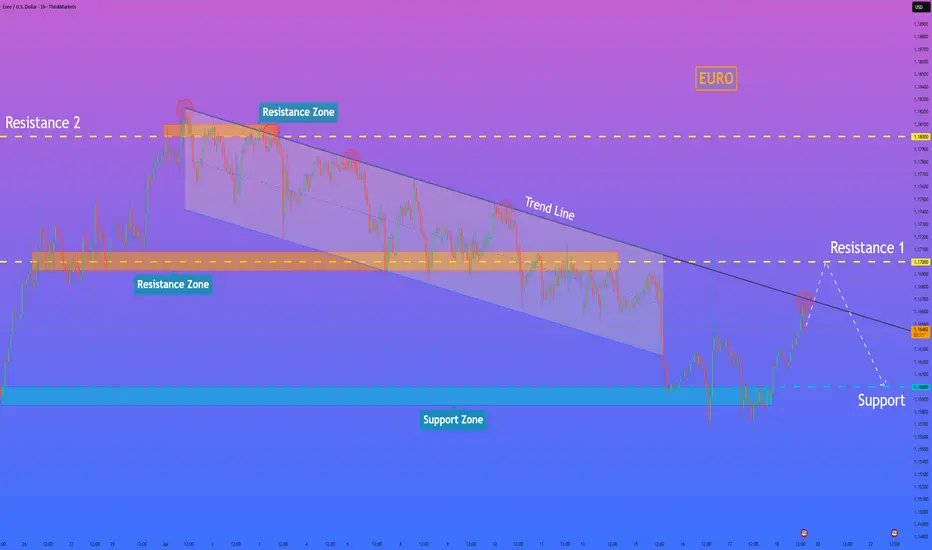
HelenP. I Euro will reach resistance level and then start fallHi folks today I'm prepared for you Euro analytics. For an extended period, the euro was trading within a clearly defined downward channel, consistently respecting its boundaries and moving under bearish pressure. Recently, however, the price staged an aggressive breakout from this structure, pushing above the upper trend line with a strong impulse. This move signaled a potential shift in momentum, as buyers appeared to take control and drive the price away from the major support zone near the 1.1600 level. Currently, following this upward breakout, the price is approaching a critical test at resistance 1. This area, centered around the 1.1700 level, is significant as it previously acted as a key pivot point and support inside the downward channel. The current price action is a classic scenario where old support is being retested as new resistance, which will determine the validity of the recent bullish move. Despite the recent breakout, I expect the upward momentum to fail as the price challenges the resistance zone 1 around 1.1700. I anticipate a rejection from this level, which would confirm the breakout as a false move and re-establish the dominant bearish trend. The primary target for the subsequent decline is the major support level at 1.1600. For this reason, my goal is set at the 1.1600 level. If you like my analytics you may support me with your like/comment ❤️
Disclaimer: As part of ThinkMarkets’ Influencer Program, I am sponsored to share and publish their charts in my analysis.
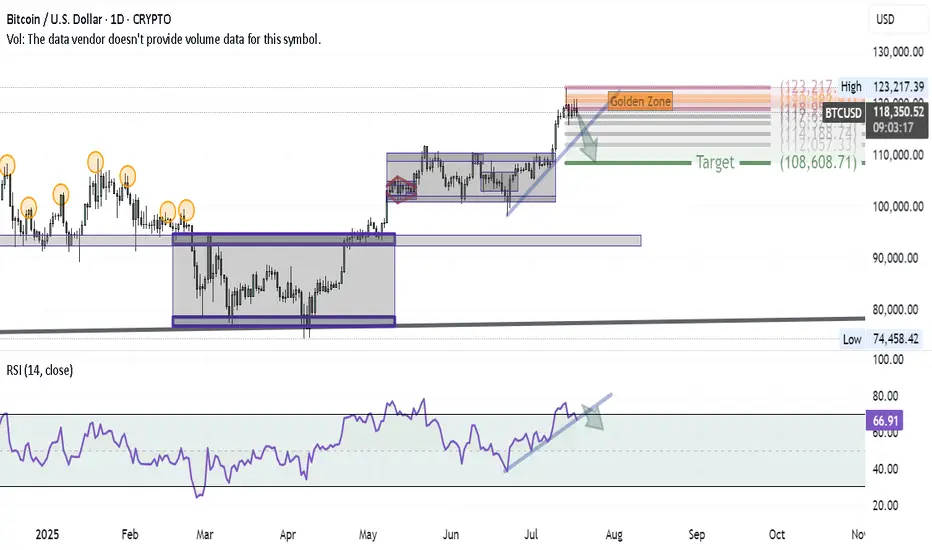
Bitcoin Correction Unfolding — First Wave in MotionAfter successfully hitting the BITCOIN target and anticipating a major correction in my previous ideas, here’s how the first wave of that correction is shaping up on the daily chart:
1- At the recent high, a Shooting Star candle formed — a classic reversal signal.
2- Using Volunacci analysis, the price retraced exactly to the Golden Zone, validating the first leg of the pullback.
3- The next step? A breakdown of the blue trendline would likely send us toward the Volunacci target at $108,600.
4- For confirmation, we're watching the RSI trendline — if it breaks down as well, it would strongly support the bearish continuation.
The setup is clean and developing as expected — it's all about following price and letting the chart guide the story.
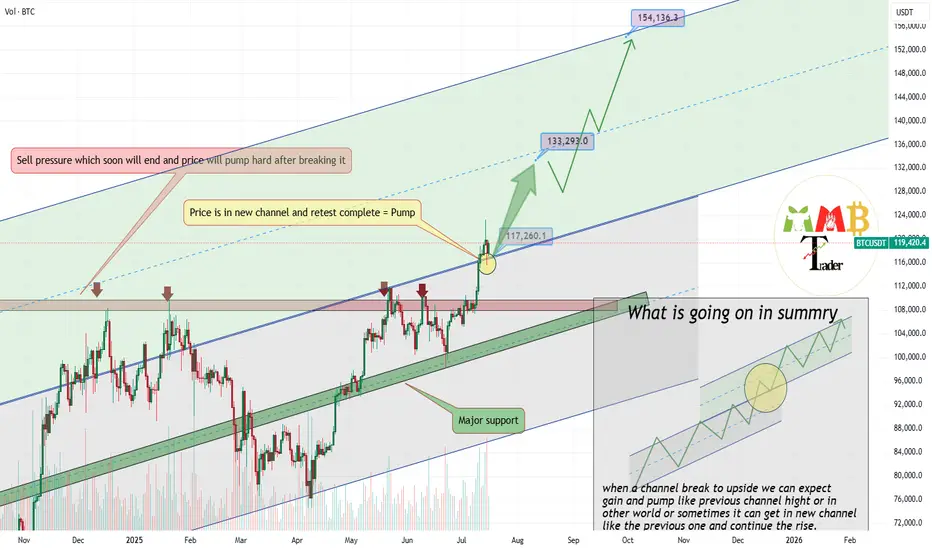
Bitcoin retest of breakout completed soon 133K$As we can see price broke previous channel and now is in new Ascending channel and pointing targets like 133K$ & 150K$.
Major support now is around 116000$ to 117000$ and price hold strong and market can easily continue more pump here like the green arrow.
BINANCE:BTCUSDT is now hitting ATH constantly and this just beginning of this bull run because ALT coins are not yet started.
DISCLAIMER: ((trade based on your own decision))
<<press like👍 if you enjoy💚