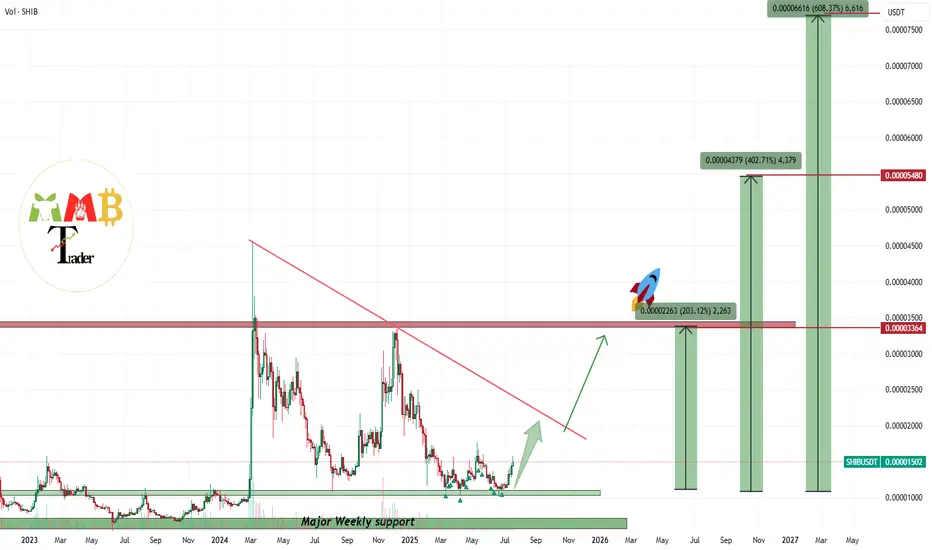
SHIBUSDT first target is +200% after years of sleepBINANCE:SHIBUSDT is not dead or sleep or it wont be any more and i think in this market soon it can see more gain and this +40% until now is just start and at least our first target which is +200% can hit soon like green arrow.
DISCLAIMER: ((trade based on your own decision))
<<press like👍 if you enjoy💚
Trend Lines
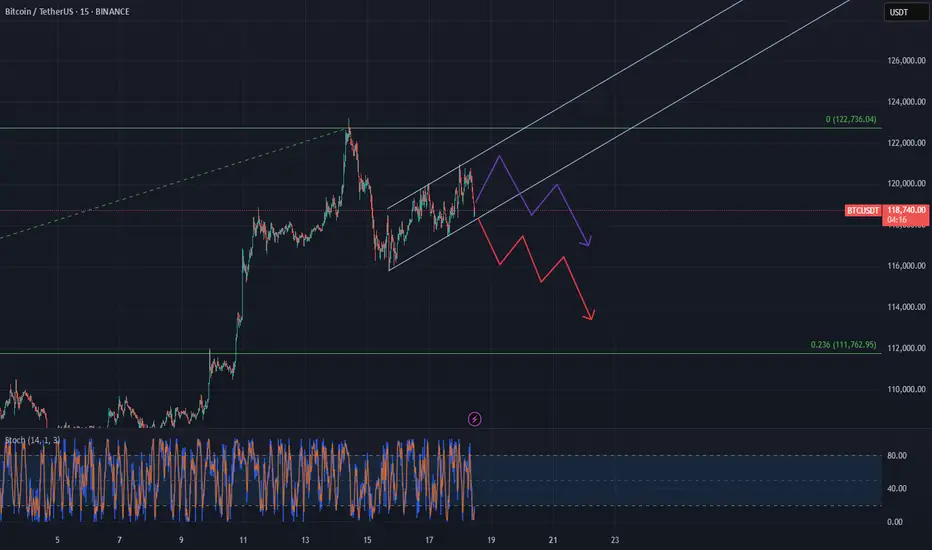
BTC consolidating a short term bearish channelBTC is moving inside a short-term bearish channel right now, even though the bigger trend is still upward. It looks like it's just consolidating for the time being, bouncing between the top and bottom of the channel.
But if it breaks below that lower trendline, we could see a pretty sharp move down—possibly all the way to around $112K , which lines up with the Fibonacci retracement from the last rally. That zone could act as a support.
It might hang out in this range a little longer, but once it breaks down, it’s probably heading toward that level.
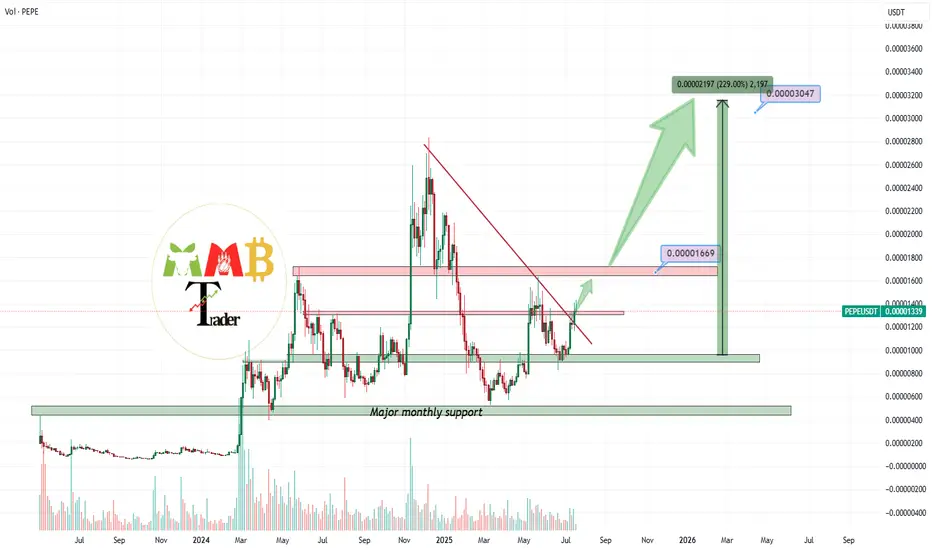
PEPEUSDT broken trendline and bullish market aheadAs we can see on the major resistances which was red trendline broke and price now after more range here or without it can see more gain at least to the targets like 0.000017$.
DISCLAIMER: ((trade based on your own decision))
<<press like👍 if you enjoy💚
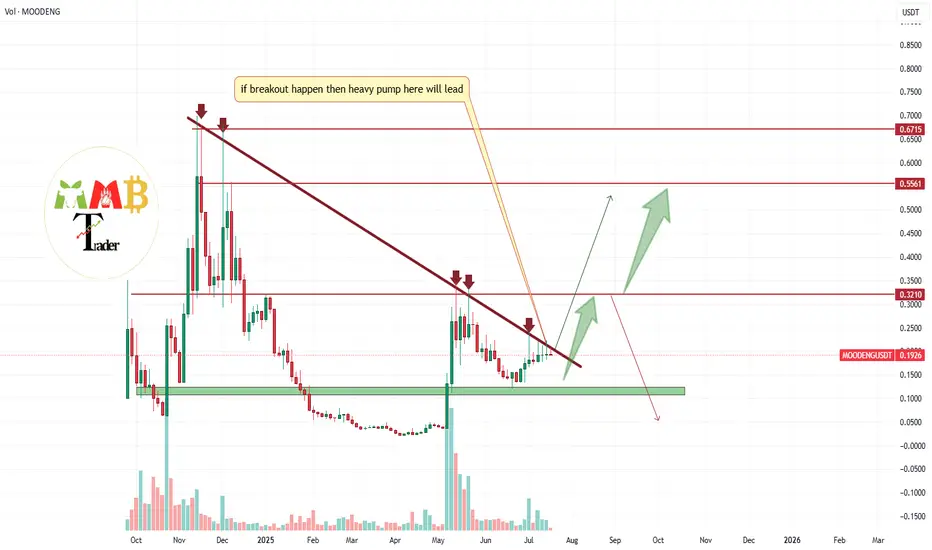
MOODENGUSDY near major resistance zone (Possible breakout ahead)As we can see price is near last and major resistance zone which is red trendline resistance and valid breakout here to the upside cause huge amount of rise and pump like green arrows on chart.
DISCLAIMER: ((trade based on your own decision))
<<press like👍 if you enjoy💚
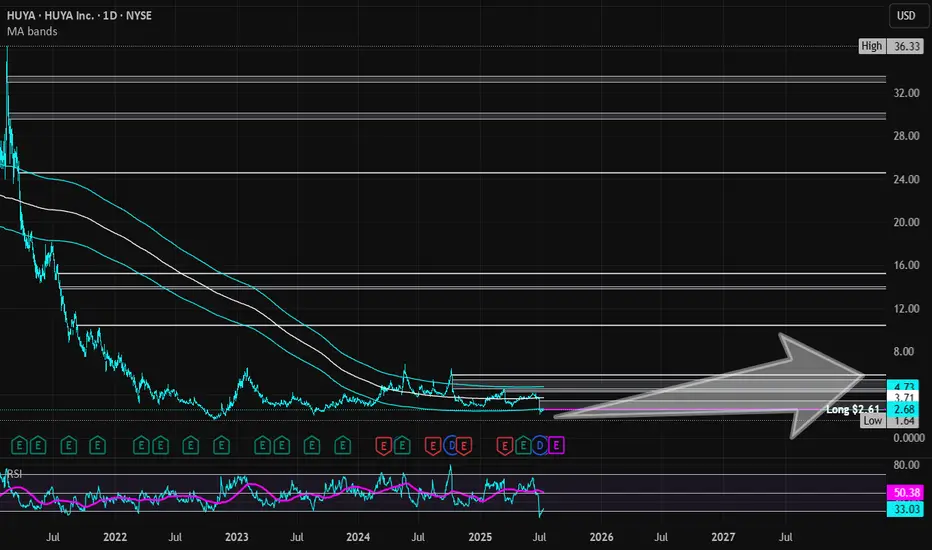
HUYA | HUYA | Long at $2.61HUYA NYSE:HUYA operates game live streaming platforms in China. This stock got my attention based on the reported fundamentals and price position, but moderate "Chinese delisting" risks exist given the US's new political administration.
Book Value = $3.23 (Undervalued)
Forward P/E = 4.1x (Growth)
Debt-to-equity = 0x (Healthy)
Quick Ratio = 1.56x (Healthy)
Altman's Z Score = <1.8 (Bankruptcy risk is relatively high)
From a technical analysis perspective, the stock price momentum has shifted upward based on the historical simple moving average. The price often consolidates within and slightly outside of this simple moving average band before progressing higher (after a long period of selling). While near term-declines are a risk, a longer-term hold (if the fundamentals do not change and delisting doesn't occur) may pay off given the value, growth, and overall health of the company.
Thus, at $2.61, NYSE:HUYA is in a personal buy zone.
Targets into 2028:
$3.45 (+32.2%)
$5.80 (+122.2%)
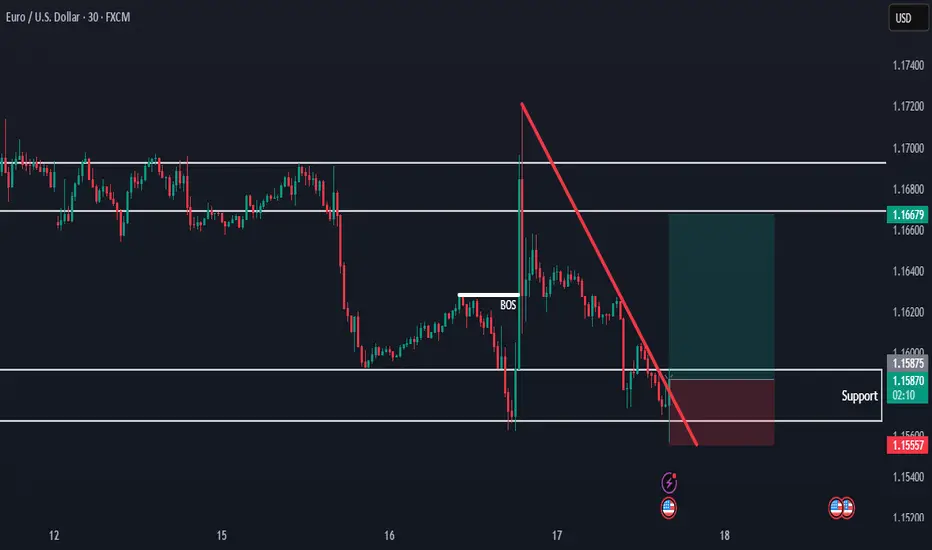
EURUSD Holding Support — Bullish Move in ProgressHello everybody!
There is a strong higher timeframe resistance now acting as support.
Price is respecting this area and starting to form a strong move to the upside.
We are looking to enter a buy position here, as the overall bullish trend is likely to continue.
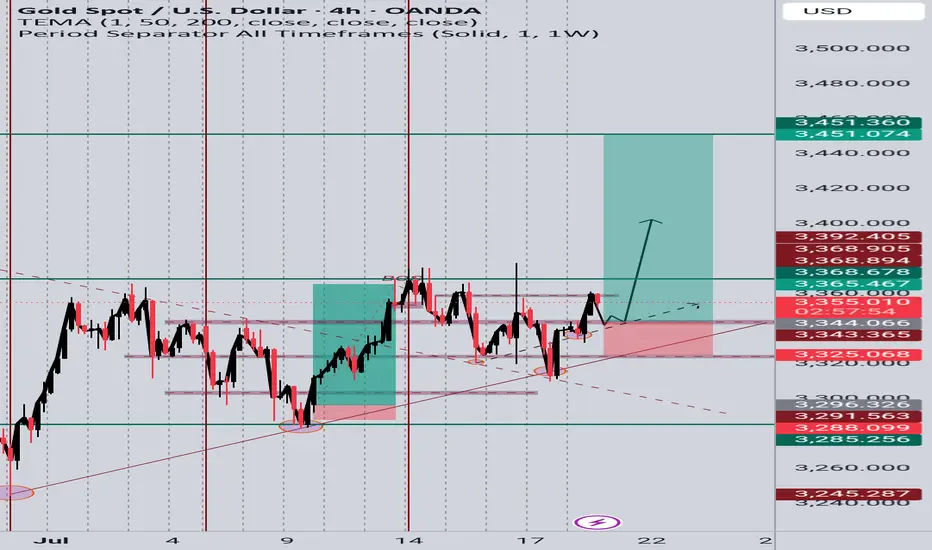
GOLD (XAUUSD) Long Idea – Breakout Confirmation📆 Timeframe: 4H
📈 Type: Long (Buy)
🎯 Entry: Around 3348-3355
🎯 Target: 3451
NOTE: Price has respected the ascending trendline from early July.
Clean breakout from a consolidation range after several rejections near 3365 resistance.
Bullish structure confirmed with higher lows and higher highs.
Fibonacci levels and support zone at ~3344 are holding strong.
Targets set at prior resistance zone (~3451), aligning with liquidity zone.
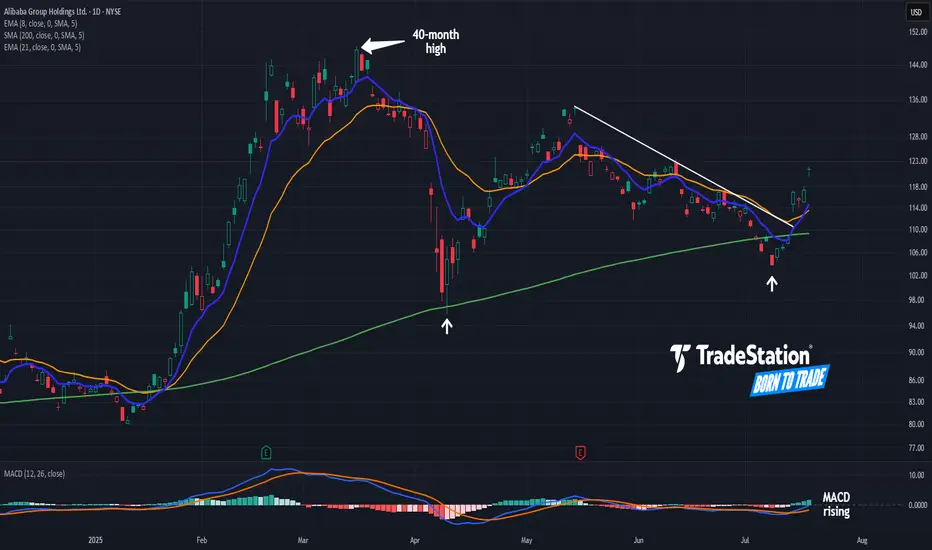
Alibaba Breaks a TrendlineAlibaba began 2025 with a big rally. Now, after a long pullback, some traders may see further upside in the Chinese tech giant.
The first pattern on today’s chart is the pair of higher lows (marked with white arrows) along the rising 200-day simple moving average. Those may reflect the development of a longer-term uptrend.
Second, BABA peaked above $148 in March. It was the highest price since November 2021. That may suggest a long-term downtrend is fading.
Third is the series of lower highs in May and June. The stock broke that falling trendline this week, a potential sign of improving price action in the short term.
Next, MACD is rising and the 8-day exponential moving average is nearing a potential cross above the 21-day EMA. Those could be viewed as further positive short-term signals.
Finally, BABA is an active underlier in the options market. (Volumes have averaged more than 200,000 contracts per session in the last month, according to TradeStation data.) That may help traders take positions with calls and puts.
TradeStation has, for decades, advanced the trading industry, providing access to stocks, options and futures. If you're born to trade, we could be for you. See our Overview for more.
Past performance, whether actual or indicated by historical tests of strategies, is no guarantee of future performance or success. There is a possibility that you may sustain a loss equal to or greater than your entire investment regardless of which asset class you trade (equities, options or futures); therefore, you should not invest or risk money that you cannot afford to lose. Online trading is not suitable for all investors. View the document titled Characteristics and Risks of Standardized Options at www.TradeStation.com . Before trading any asset class, customers must read the relevant risk disclosure statements on www.TradeStation.com . System access and trade placement and execution may be delayed or fail due to market volatility and volume, quote delays, system and software errors, Internet traffic, outages and other factors.
Securities and futures trading is offered to self-directed customers by TradeStation Securities, Inc., a broker-dealer registered with the Securities and Exchange Commission and a futures commission merchant licensed with the Commodity Futures Trading Commission). TradeStation Securities is a member of the Financial Industry Regulatory Authority, the National Futures Association, and a number of exchanges.
Options trading is not suitable for all investors. Your TradeStation Securities’ account application to trade options will be considered and approved or disapproved based on all relevant factors, including your trading experience. See www.TradeStation.com . Visit www.TradeStation.com for full details on the costs and fees associated with options.
Margin trading involves risks, and it is important that you fully understand those risks before trading on margin. The Margin Disclosure Statement outlines many of those risks, including that you can lose more funds than you deposit in your margin account; your brokerage firm can force the sale of securities in your account; your brokerage firm can sell your securities without contacting you; and you are not entitled to an extension of time on a margin call. Review the Margin Disclosure Statement at www.TradeStation.com .
TradeStation Securities, Inc. and TradeStation Technologies, Inc. are each wholly owned subsidiaries of TradeStation Group, Inc., both operating, and providing products and services, under the TradeStation brand and trademark. When applying for, or purchasing, accounts, subscriptions, products and services, it is important that you know which company you will be dealing with. Visit www.TradeStation.com for further important information explaining what this means.
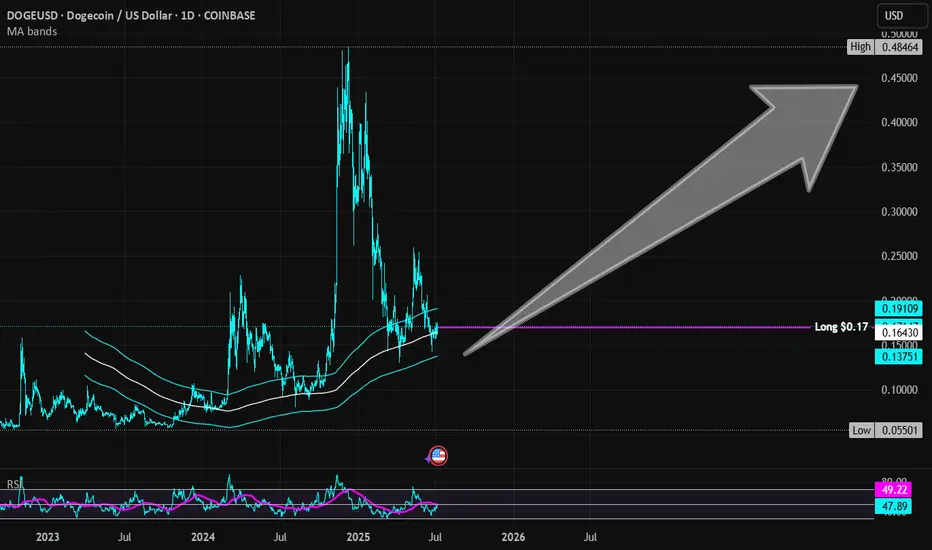
Dogecoin | DOGE | Long at $0.17Currently within my historical simple moving average area and consolidating. I suspect a move up is imminent, but 100% speculation. Crypto "bros" know more than I do.
Targets into 2028:
$0.25 (+47.1%)
$0.45 (+164.7%)
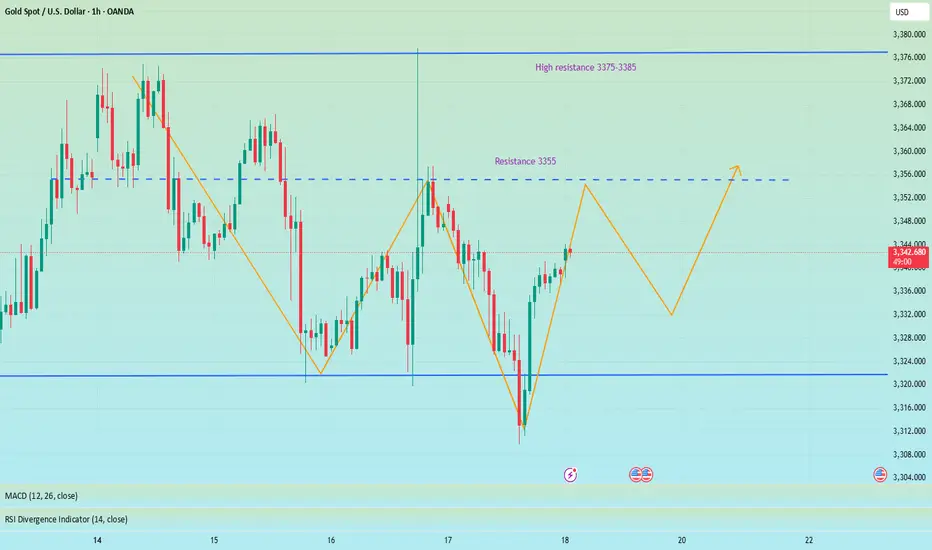
The short-selling idea remains unchanged, defend 3355📰 News information:
1. Powell responds to White House issues
2. Will other countries impose reciprocal sanctions on tariffs?
📈 Technical Analysis:
Gold closed with a long lower shadow on the daily line yesterday and closed with a doji on the hourly line. In the short term, gold may continue to rise and is expected to touch the 3355 line. If gold cannot break through and stabilize above 3355, then gold may fall back. We can still consider shorting, and the target can be 3330. If the trend is as expected, it may form the embryonic form of a head and shoulders bottom. On the contrary, if the gold price breaks through 3355, stop loss on short positions and pay attention to the high resistance of 3375-3385.
🎯 Trading Points:
SELL 3340-3355
TP 3330-3320
In addition to investment, life also includes poetry, distant places, and Allen. Facing the market is actually facing yourself, correcting your shortcomings, facing your mistakes, and exercising strict self-discipline. I share free trading strategies and analysis ideas every day for reference by brothers. I hope my analysis can help you.
TVC:GOLD PEPPERSTONE:XAUUSD FOREXCOM:XAUUSD FX:XAUUSD OANDA:XAUUSD FXOPEN:XAUUSD
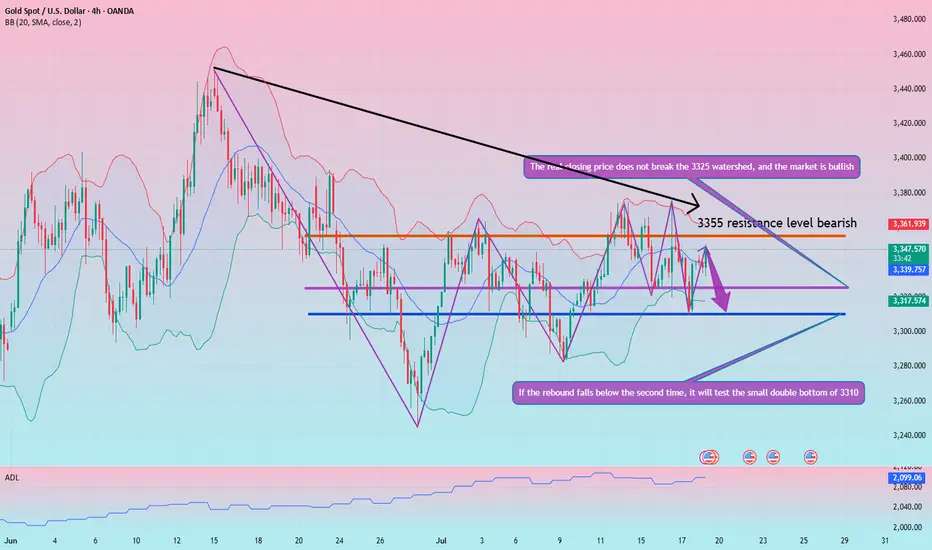
Gold rebound brings bearish opportunities
Before the fishermen go out to sea, they don't know where the fish are? But they still choose to go because they believe they will return with a full load. When you invest, you don't know whether you can make a profit, but you still need to try, and from the moment you decide to do it, you must insist on believing to gain something. The same is true for gold investment. You may still be losing money at the moment, but as long as you find me, all losses will be solved!
Views on the trend of gold!
In terms of gold, unfortunately, the bulls don't seem to last long, and they are also a bit unstable! Emphasize the most critical point, the continuous rise of the sun, the first wave of V-shaped rebound last night, and then the high-level oscillation, and there was no continuation of the rise of the sun last night. The bulls did not take off in one wave, but were held down again. But in the same way, don't think that the bulls are held down, and the bears will come. We still have to distinguish according to the range and strength. In many cases, the market maintains a oscillating range.
So how do you look at it today? Is there still hope for the bulls? From the perspective of correction, every big drop has poor continuity, and they all bottom out and rebound, just like gold fell to 3310 last night and violently rose to 3344, so there is a high probability that there will be continuation after the retracement today. On the one hand, even if it rebounds, it is also volatile, and the rebound and second decline is the continuation of the market. Therefore, currently pay attention to two points, the upward pressure 3355, and the downward strength and weakness dividing point 3325!
Gold: You can short at the rebound of 3350-55, defend 10 US dollars, and the target is 3330-25! If it breaks 3325, it will look down to the double bottom support of 3310. On the contrary, if it does not break, it can be shorted and look up to 3345-50!
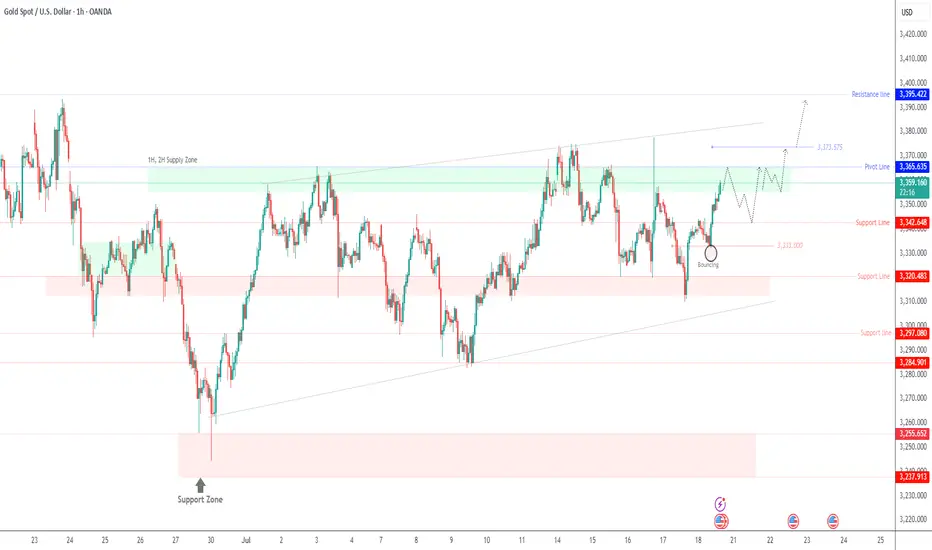
Gold Eyes 3365 – Breakout or Rejection?GOLD | Technical Outlook
Gold maintains bullish momentum as long as it trades above 3355, aiming to test the 3365 resistance level.
However, signs of rejection at 3365 may emerge, especially if the 4H candle closes below this level. In that case, expect a period of sideways consolidation between 3365 and 3342.
A confirmed 1H candle close above 3365 would signal bullish continuation toward 3373, with an extended target at 3395.
Key Levels:
• Pivot: 3355
• Resistance: 3365 / 3375 / 3395
• Support: 3342 / 3333
Outlook:
• Bullish above 3355
• Breakout above 3365 confirms further upside
• Rejection at 3365 may lead to short-term range-bound movement
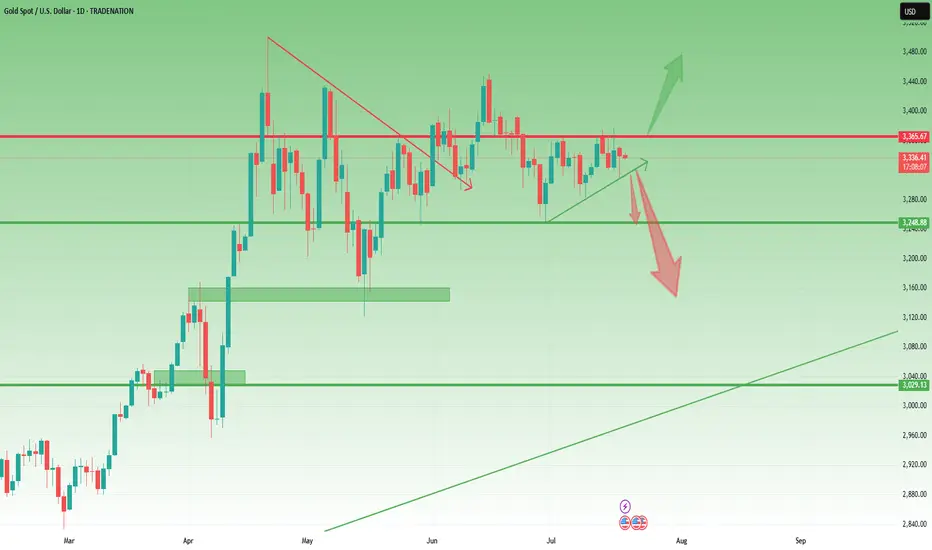
Gold- Still needs to resolve the range🔸 Still Rangebound, But Not for Long
In yesterday’s analysis, I mentioned that two scenarios are in play for Gold:
1. Bullish above 3375
2. Bearish under 3320
Throughout the session, price action leaned toward the bearish side, and I aligned with that by opening a short position. It ended with a minor loss — just 50 pips, which is negligible considering I'm looking for a potential 1,000 pip move in the bigger picture.
________________________________________
🔍 What's Next?
As the title says, Gold still needs to resolve the current range before a clear directional move unfolds.
The same key levels discussed yesterday remain valid and relevant.
And since it’s Friday, today’s daily and weekly candle close will be critical in shaping expectations for next week.
________________________________________
📈 Bullish Case: Close Above 3360
• A daily/weekly close around 3360 would bring strong pressure on the 3375 resistance.
• That could lead to a bullish breakout from the ascending triangle pattern.
• It would also leave behind a bullish weekly pin bar (last week was a bullish pin bar too).
• This scenario would bring 3450 into focus — with 3500 and even a new ATH on the table in the coming weeks.
________________________________________
📉 Bearish Case: Close Near 3300
• A close near 3300 would signal a failed rally attempt
• That would expose 3250 support short term, and 3150 medium term.
________________________________________
🧭 Final Thoughts
At the moment, I’m flat and waiting for clearer confirmation later in the day.
The next move big will be defined by the weekly close — it’s as simple as that.
P.S.: It’s just a hunch , but I’m still leaning toward a break under 3300 as the next major move.
Disclosure: I am part of TradeNation's Influencer program and receive a monthly fee for using their TradingView charts in my analyses and educational articles.
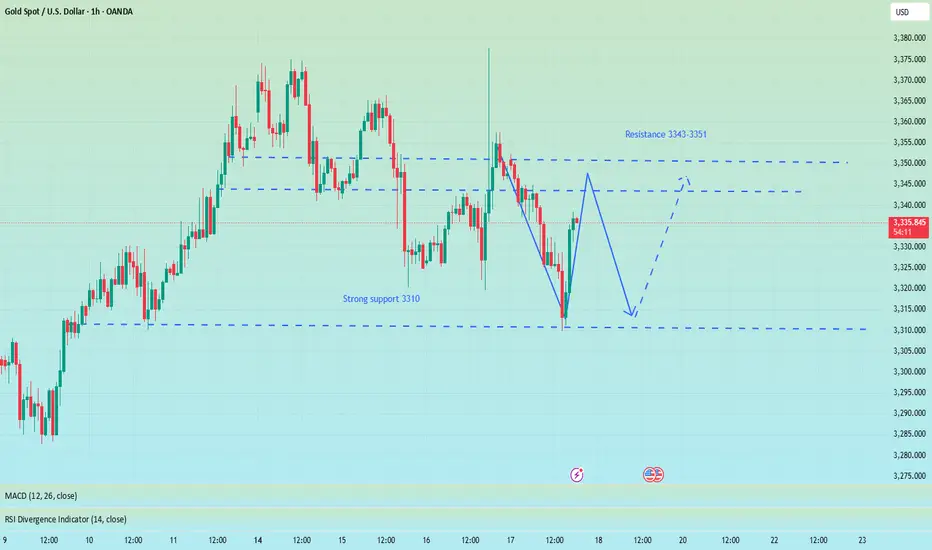
Bottom-out rebound, 3338 short orders enteredYesterday, the gold market was affected by Trump's remarks about firing Federal Reserve Chairman Powell. After briefly falling below 3320, the price quickly rose by nearly 60 points, reaching a high of 3377. Trump later clarified that the news was false, triggering a gold sell-off, and the market rose and fell. As of Thursday's European session, gold prices fell back to around 3320. After a rapid rise and fall in the US market on Wednesday, the downward trend continued on Thursday, with the US market hitting a low of 3310 before rebounding. Judging from the 4-hour chart, the Bollinger Bands failed to open downward, indicating that the current market lacks continuity and the overall market remains in a volatile pattern. In a volatile market, it is recommended to pay attention to key support and resistance levels for high-selling and low-buying operations. The upper resistance range is currently at 3343-3351, and the important watershed support level below is at 3310.
OANDA:XAUUSD
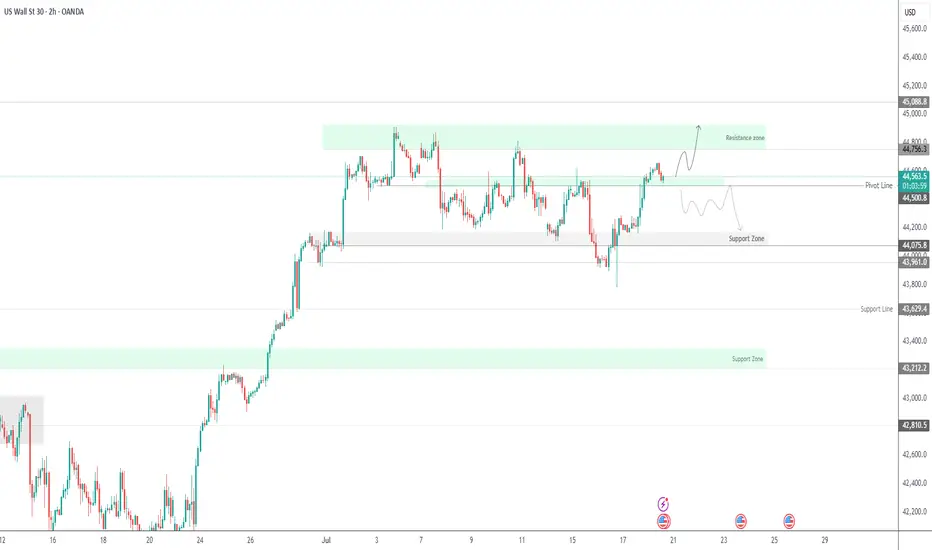
US30 Holds Above 44500 – Bullish Momentum in PlayUS30 | Technical Overview
The price action continues to reflect a bullish bias, supported by strong earnings reports and solid U.S. economic data. As long as the index trades above 44500, the upward momentum is expected to continue.
Technical Outlook:
Price remains bullish above 44500, with upside targets at 44640 and 44760.
A confirmed 1H close below 44500 would shift momentum to the downside, exposing support levels at 44350 and 44215.
Key Levels:
• Pivot: 44500
• Resistance: 44640 / 44760 / 44920
• Support: 44350 / 44215 / 44075
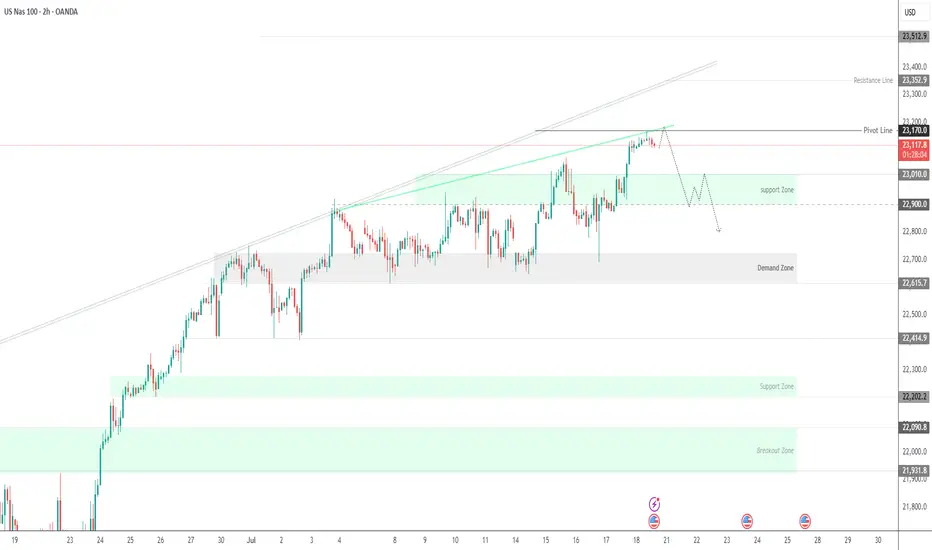
NASDAQ100 Hits Target at 23170 – Watch for Breakout or PullbackNASDAQ100 Tests ATH – Key Decision Zone at 23170
New ATH Achieved:
NASDAQ100 recorded a new All-Time High (ATH), hitting our target at 23170 precisely as projected.
Currently, price is consolidating below 23170. Sustained rejection at this level could trigger a short-term bearish pullback toward 23010. A deeper correction may extend to 22900 or even 22815.
However, a clean breakout above 23170 would confirm bullish continuation, with the next target at 23350.
Key Levels
• Pivot: 23170
• Resistance: 23250 / 23350
• Support: 23010 / 22900 / 22815
Outlook:
• Bullish above 23170
• Bearish below 23170 (short-term pullback zone)
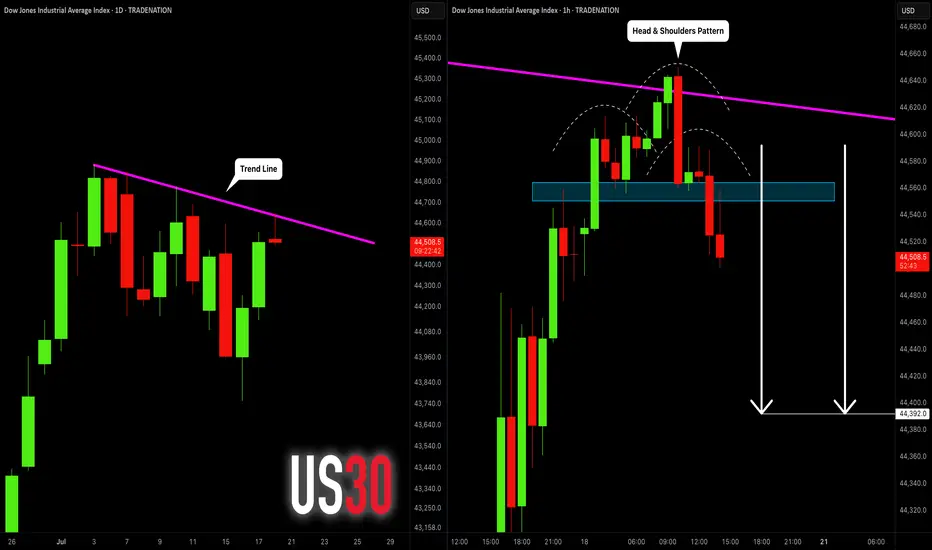
DOW JONES INDEX (US30): Bearish Move From Trend Line
I see a test of a strong trend line on US30.
The price formed a head & shoulders pattern on that
and a breakout of its neckline on an hourly time frame.
I expect a retracement to 48390
❤️Please, support my work with like, thank you!❤️
I am part of Trade Nation's Influencer program and receive a monthly fee for using their TradingView charts in my analysis.
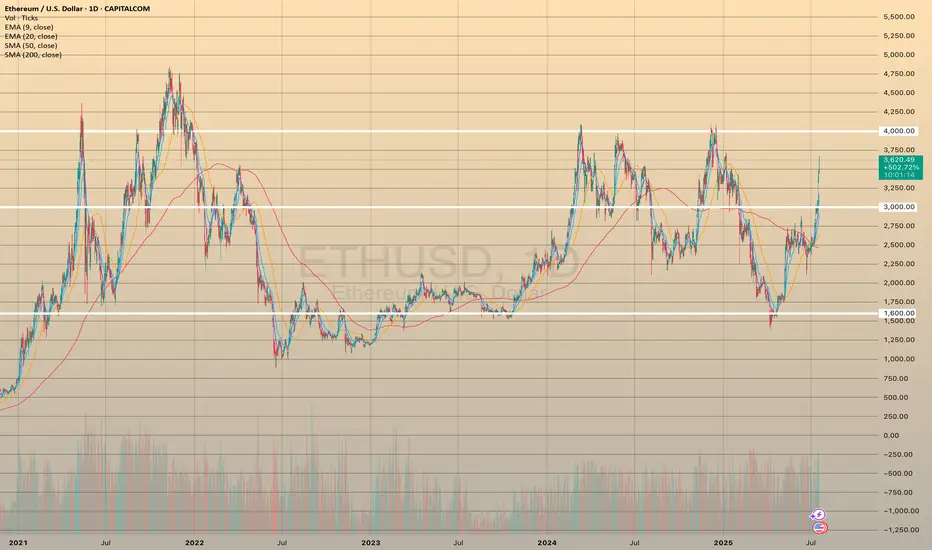
ETHUSD - ANOTHER GROWING WEEK
ETHUSD - ANOTHER GROWING WEEK✅
ETHUSD has been growing all these days together with a bitcoin. All the news, listed in my previous post for the BTCUSD are also valuable here. Really nice fundamental support, people are purchasing the asset.
But what's with technicals? 📊
Compared to the bitcoin, ETHUSD hasn't reached ATH. According to a daily chart (pic 1), the price has been moving sideways since 2021 and a strong resistance is waiting ahead at 4,000.00. However, for now we are good. I bet that during upcoming days the asset will reach this level and rebound from it. Will it break the resistance? I think it is too early to make any conclusions.
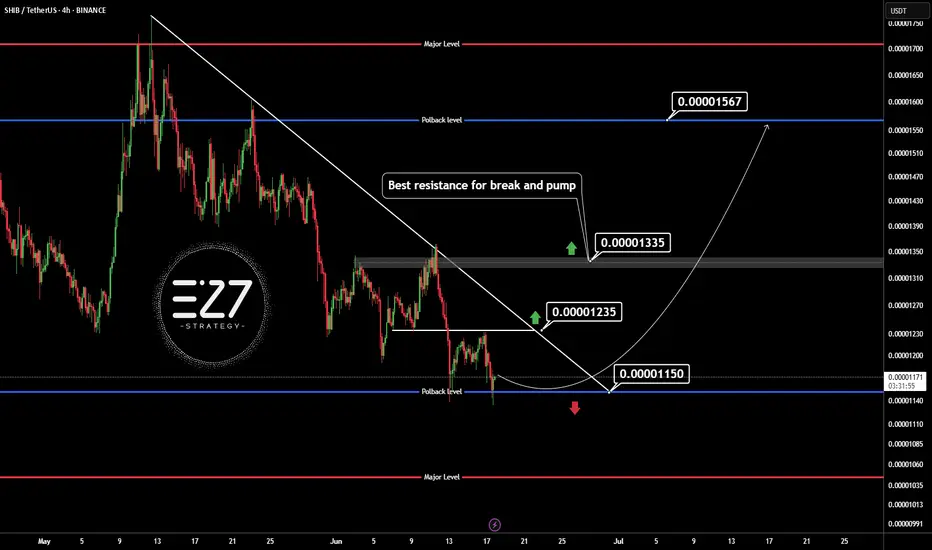
SHIBUSDT🕯 The key resistance level, identified as the best resistance for a break and pump, stands at 0.0000135, with a potential price increase to 0.00001567 if breached, serving as the next target (Pullback level). On the support side, the main level is observed at 0.0000115, and should the price fall below this, it may decline further to the lower Major Level of 0.0000100.
🔽 Resistances:
Main resistance level: 0.0000135 (potential break for pump)
Next target (Pullback level): 0.00001567
🔼 Supports:
Main support level: 0.0000115
Lower level (Major Level): 0.0000100
⚠️Contorl Risk management for trades.
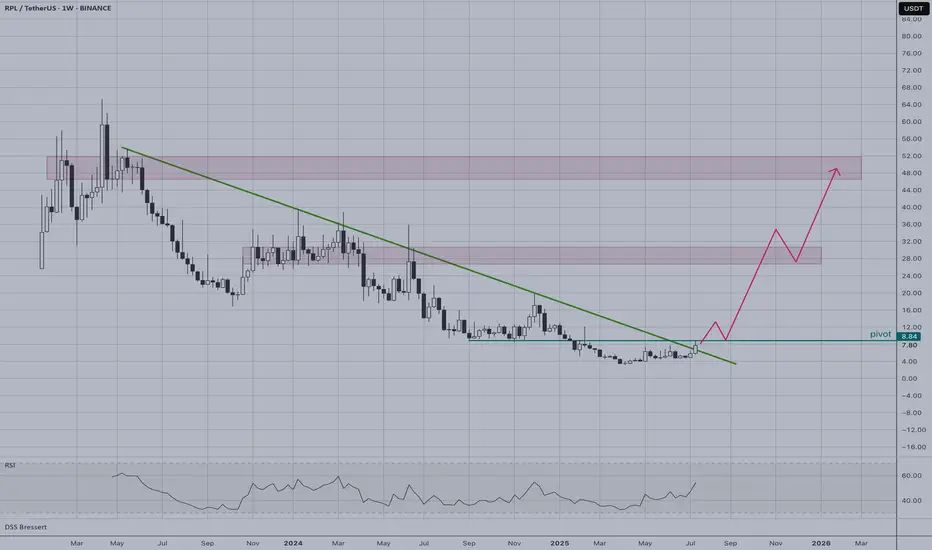
RPL | Waiting to Reclaim PivotRPL appears to be at a critical juncture on the weekly timeframe, having recently broken below its long-term descending trendline. The price is currently consolidating near the pivot level, which represents a key technical inflection point.
Current Setup:
Price trading below descending trendline resistance
RSI showing oversold conditions with potential for bounce
Critical pivot level at acting as immediate resistance
Bullish Scenario:
Reclaim of the pivot could trigger the projected upward path
Target the resistance zone around $28-32 (marked in red)
A break above the descending trendline would confirm trend reversal
Risk Factors:
Failure to reclaim pivot could lead to further downside
Overall crypto market sentiment remains a key factor
The setup suggests RPL is waiting for a decisive move above the pivot to initiate the bullish trajectory outlined in the chart projection.
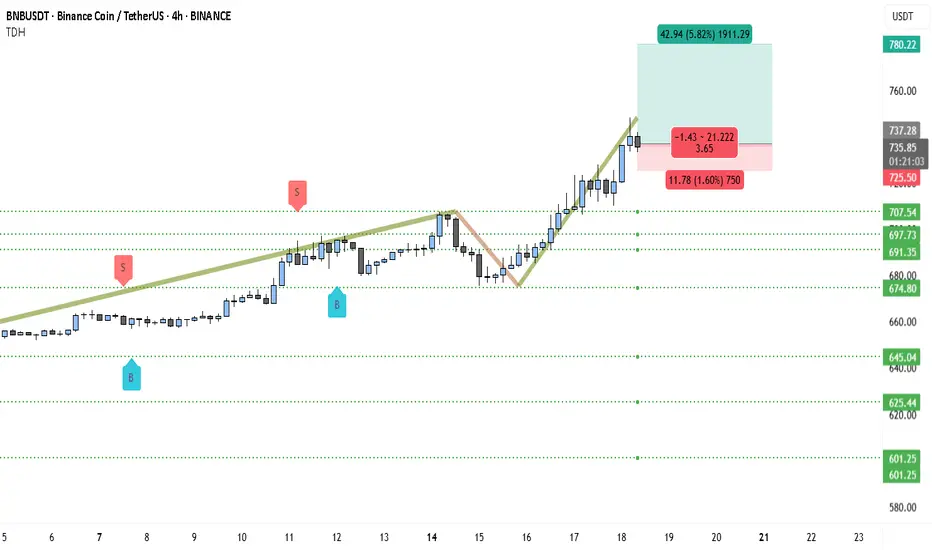
Binance Coin (BNB) to $780? Chart Says 5.8% Rally Incoming!BNBUSDT is currently showcasing a clear bullish structure, supported by consistent demand and a strong breakout beyond previous resistance zones. The price action has steadily evolved into higher highs and higher lows since July 10, confirming bullish market control.
After consolidating around the 707–710 USDT range, the pair decisively broke out, flipping this level into support. The price is now hovering near 736.50 USDT, holding its gains despite brief intraday corrections.
The ascending pattern that started from mid-July saw a short-term dip toward 675 USDT, but strong buying interest quickly stepped in. This bounce marked the formation of a new swing low, followed by a powerful rally above the previous resistance.
The recent long-bodied bullish candles reflect strong momentum and possible accumulation by larger players. Buy and sell signals shown on the chart further validate the demand zone around 674–691 USDT, where bulls aggressively defended support.
The breakout structure is now entering a price discovery phase, with room for a measured move toward the upper resistance near 780 USDT, which is both a psychological round number and the projected Fibonacci extension zone.
________________________________________
📍 Trading Setup (Based on Chart)
• Entry Price: 736.50 USDT (current market price)
• Stop-Loss: 725.00 USDT (just below the recent structure low and horizontal support)
• Take-Profit: 780.22 USDT (Fibonacci target + psychological resistance)
• Risk: 11.78 USDT (~1.60%)
• Reward: 42.94 USDT (~5.82%)
• Risk-Reward Ratio: ~3.65 — favorable for swing-long positions
________________________________________
🧭 Key Zones to Watch
The support zone between 707.54 and 691.35 USDT is now the major demand base. As long as BNBUSDT holds above this area, the bullish thesis remains intact. A retest of this level followed by a bounce would further strengthen the ongoing uptrend.
Immediate resistance is at 737.28 USDT, but the market is attempting to flip this level. If it holds as support on the next retest, upside continuation to 780.22 USDT becomes highly probable.
If bulls fail to defend the 725 USDT level, we could see a deeper retracement toward 707 or 691 USDT, but currently that risk remains low given the strength of the latest breakout.
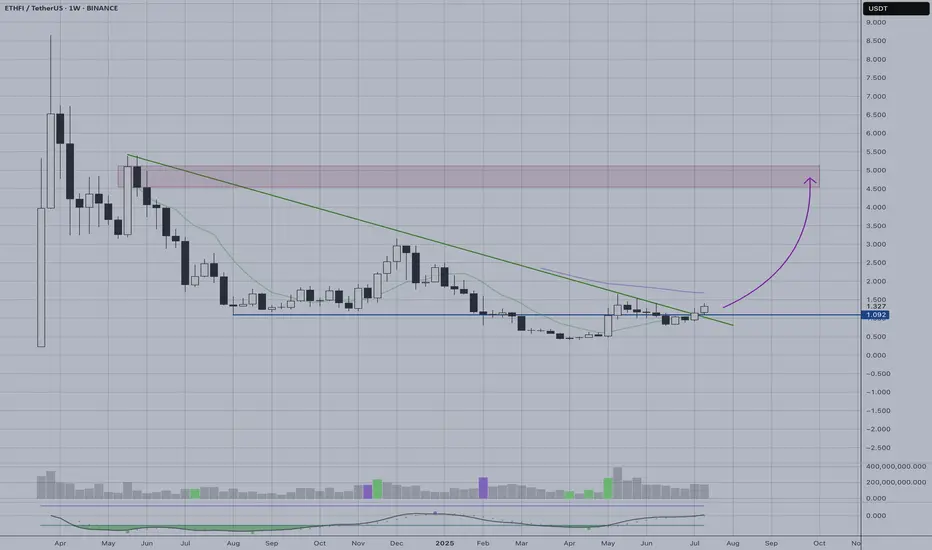
ETHFI | Trendline BreakoutETHFI on the weekly timeframe shows a significant bullish breakout after successfully breaking above the long-term descending trendline resistance that had been capping price action for months. This breakout represents a major shift in market structure and suggests the extended downtrend may be ending.
Key Technical Points:
Clean break above descending trendline resistance
Volume appears supportive of the breakout move
Potential Targets:
Initial resistance zone around $4.5 (red shaded area)
Higher targets possible if momentum sustains
Risk Considerations:
Weekly timeframe moves take time to develop
A false breakout could see price return below trendline
Overall crypto market sentiment remains crucial
The breakout setup offers favorable risk-to-reward for longer-term positioning, though traders should monitor for sustained momentum above the trendline to confirm the reversal.
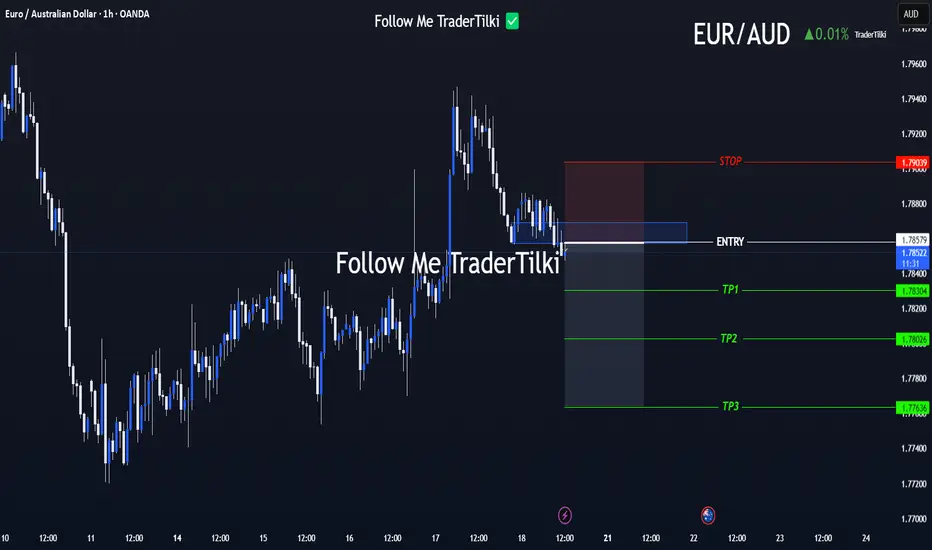
FX Setup of the Day: EURAUD SELL ZONEHey traders 👋
📌 SELL / EURAUD – Technical Breakdown
🟢 Entry: 1.78579
🎯 Target 1: 1.78304
🎯 Target 2: 1.78026
🎯 Target 3: 1.77636
🔴 Stop Loss: 1.79039
📈 Risk/Reward Ratio: 2.00
I’ve carefully validated these levels and crafted a clean, focused analysis for you.
Every like seriously fuels my drive to produce more top-tier content 📈
Your support genuinely means a lot to me.
Thanks from the heart to everyone showing love 💙
🎯 Clear targets, solid strategy.
🤝 Let’s move forward with logic and discipline.