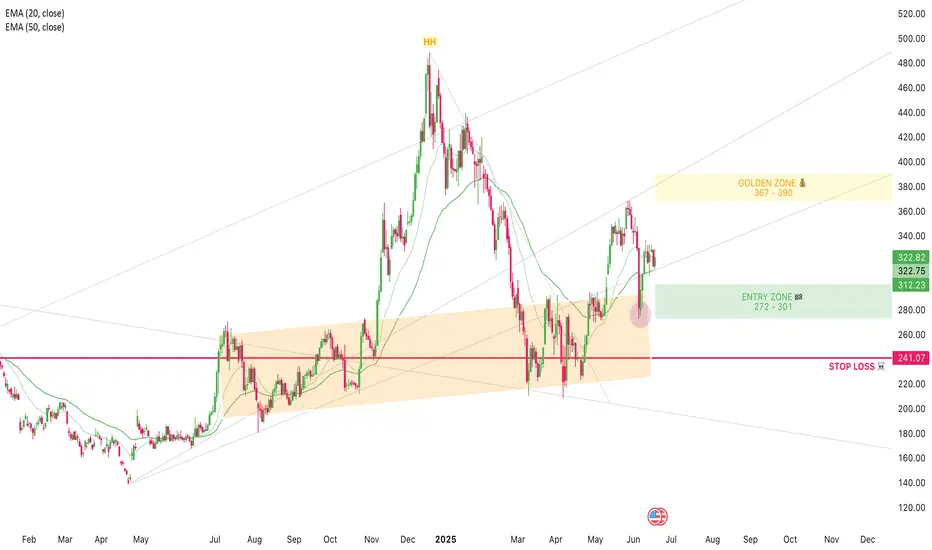
TSLA: Don't Sleep on the PullbackTesla’s bullish momentum is still in control – the weekly chart shows we’re still in an uptrend, and the trend is still our best friend. After a strong bounce from support a couple weeks ago, price is now rejecting off a weak resistance zone. Ideally, this pulls it back into my entry zone to retest the bottom or the 50% mark of the current swing. I’m using trend lines for guidance and expecting the next swing to push up into that confluence area. My golden zone is set between $367–$390, with partial profits be taken at $367 (top of the channel) and the rest near $390, where we meet the trend line. Stop loss is placed at $241, just below the level where momentum would likely shift.
Trend Lines
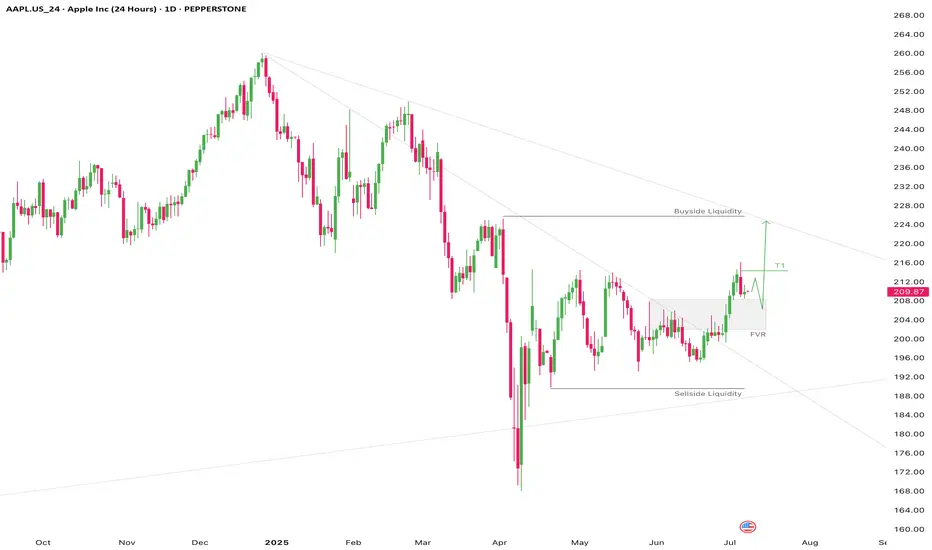
AAPL Short Term Highs IncomingAAPL 1D
Apple looks good from here.
Target 1 @ 214.30
Target 2 @ anywhere from 218 to buyside liquidity
Retest of the former high then a pullback to fair value region is possible before continuation to the next short term high.
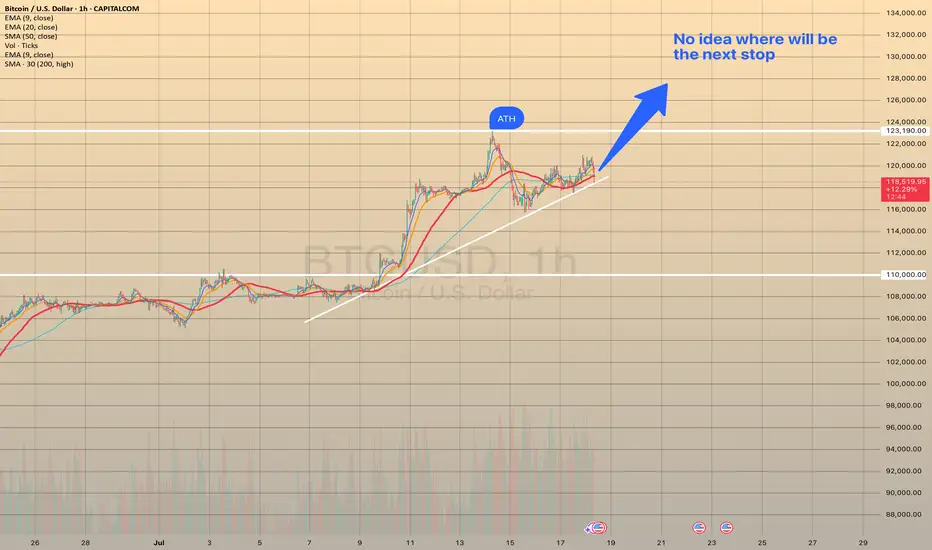
BTCUSD - GOOD SUPPORT ESTABLISHED?BTCUSD - GOOD SUPPORT ESTABLISHED?📈
Yesterday, after a record-breaking nine-hour House session, U.S. lawmakers passed three major crypto bills: CLARITY Act (294-134), which establishes a market structure for cryptocurrencies, GENIUS Act (308-122) that supports U.S. stablecoin innovation and an Anti-CBDC Surveillance State Act (219-210) that opposes central bank digital currencies. All of this supports crypto and especially Bitcoin.
Technically, BTCUSD looks bullish also, establishing a new bullish trend. I expect the ATH at 123,190.30 will be rewritten soon. Where will be the next stop, I've got no idea. To my mind, the best strategy here will be to buy on trend support, then transfer the stop loss at your entry point and sell o local hikes.
Stay tuned for the next report! 🔔
BRENT CRUDE OIL FORMED A BEARISH WEDGE. ANOTHER POSSIBLE DECLINEBRENT CRUDE OIL FORMED A BEARISH WEDGE. ANOTHER POSSIBLE DECLINE?📉
USOIL has been trading bullish within the last couple of days, supported by prospects of tighter supply and an improved demand outlook. US crude inventories dropped last week, which indicates firm demand despite the rising output.
Still, technically, oil looks bearish. It has formed a bearish wedge and is currently testing the former trendline from below. The most probable scenario is that wee see the bearish impulse towards 6,500.00 with further decline. Another option is that the rise will continue towards 6,900.00 level.

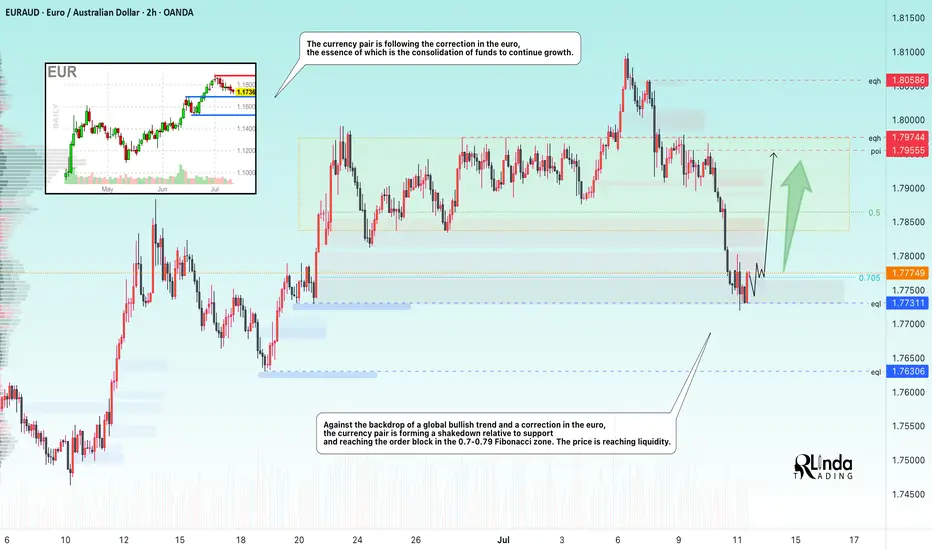
EURAUD → Correction for accumulation before growthFX:EURAUD reaches the zone of interest during a correction and forms a false breakdown of local support. Traders can switch to the buy side to support the trend.
Against the backdrop of a global bullish trend and a correction in the euro, the currency pair is following this movement, the essence of which is to consolidate funds for further growth. Liquidation is forming in relation to the liquidity zones of 1.785, 1.78, and 1.773, and the market imbalance is changing. The current movement is bringing the price to the zone of interest: the liquidity area of 1.773 and the order block. The capture of liquidity relative to 1.773 leads to the formation of a false breakdown and a pullback to the area of interest for buyers. Accordingly, price consolidation above 1.776 and 0.7 Fibonacci could support the main trend and allow the price to strengthen.
Support levels: 1.776, 1.773, 1.763
Resistance levels: 1.786, 1.795
The euro clearly demonstrates an upward trend, the structure of which has not been broken during the correction. Correction is a perfectly healthy movement within a trend, allowing positions to be opened at more favorable prices. If the bulls hold their defense above 1.776, momentum towards the specified targets may form.
Best regards, R. Linda!
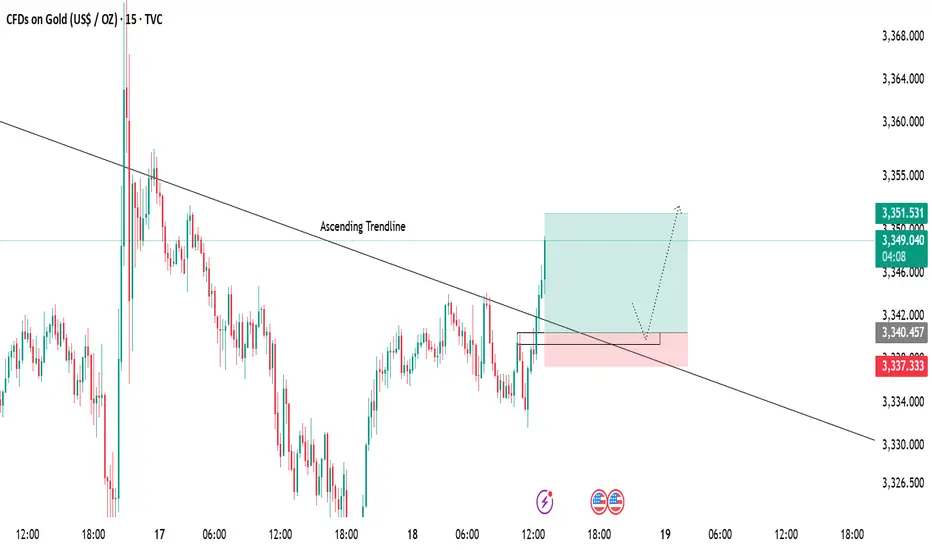
Gold 15-Min Chart Analysis Alert!Gold has successfully broken above the descending trendline, showing early signs of bullish momentum. Price has reclaimed structure and is now trading above the breakout level.
📌 Retest Zone:
We can expect a possible pullback towards the marked zone for a healthy retest before continuing the upward move.
🎯 Bullish Target:
As long as price holds above the support area, the bullish bias remains intact with targets around 3351+.
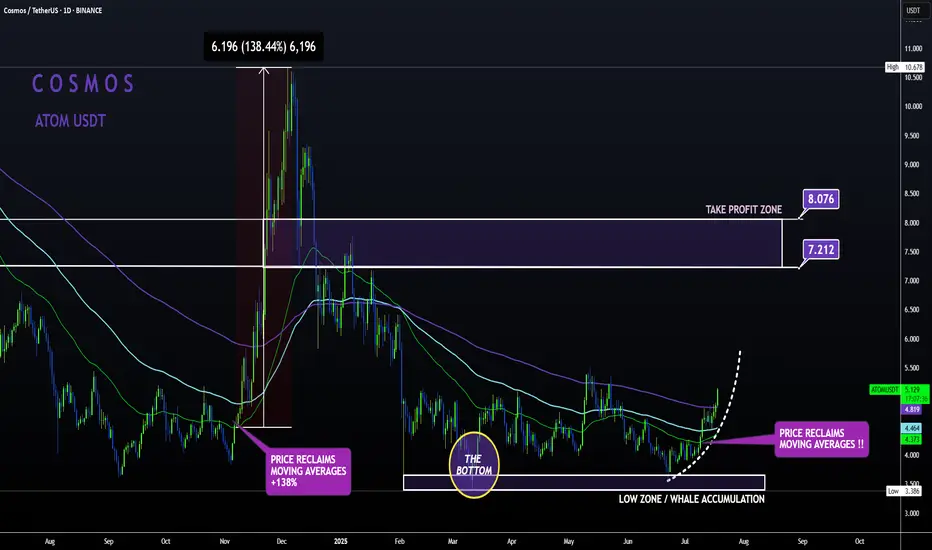
ATOM Sleeping GIANT ALT | Moving Averages BULLISH like NOV24'ATOM is slowly but surely making a turn up towards the first Take Profit point.
From the bottom, Cosmos has already increased a whopping 52% , with even more room to grow:
In my previous update, the 4 was still bearish when looking at trend lines and moving averages.
However, this has flipped to bullish from the 4h upward, with the price trading high above the moving averages in the 4h and in the daily timeframe:
4H:
Daily:
Note how previously, the big increases started as soon as the price regained the moving averages as support.
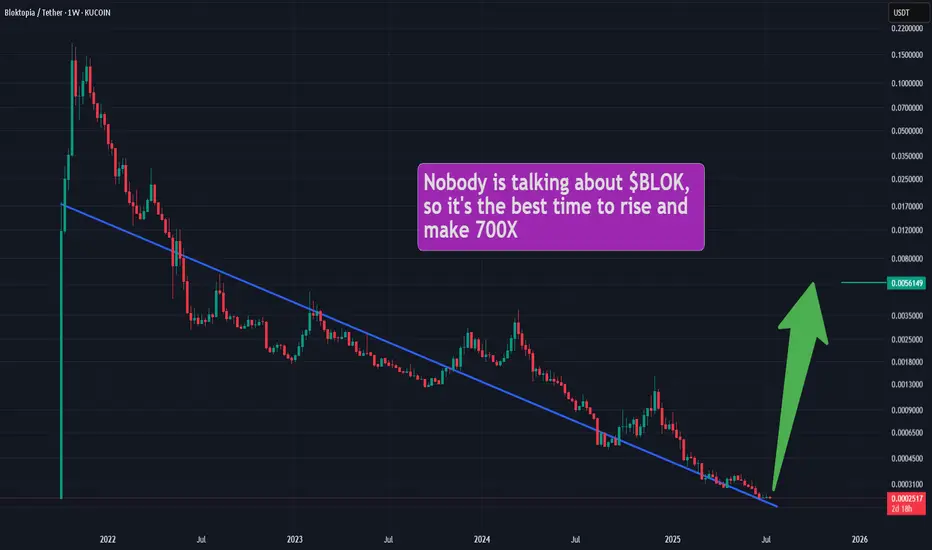
Bloktopia OutlookNobody is talking about #BLOK, so it's the best time to rise. It's like #SAND and #MANA when nobody knew them. 700X possible!
EURJPY ANALYSISAfter seeing that the previous daily candle could not trade below the moving averages and had a retracement to the upside it will be a good idea to wait and see how the pair trades before executing in a specific direction

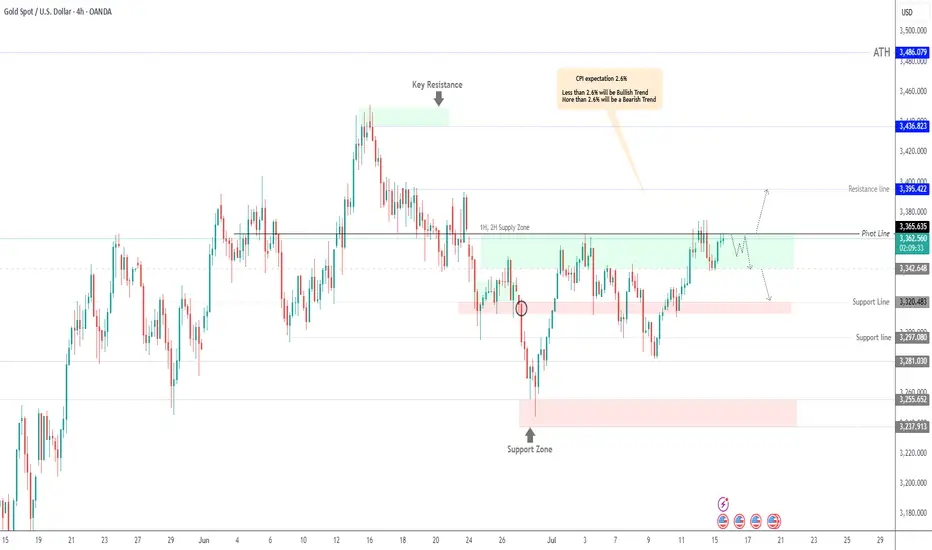
GOLD Under Pressure – CPI to Drive the Next MoveGOLD Outlook – Bearish Below 3365, CPI in Focus
Gold is showing bearish momentum while trading below 3365, with a likely move toward 3342.
However, if the price closes a 1H or 4H candle above 3365, it may shift to a bullish trend targeting 3395.
CPI data will be the key factor in determining the next move.
The market expects a print of 2.6%, which would signal no Fed rate cuts this year due to rising tariff pressures.
That said, we expect a 2.7% release, which would likely support a bearish trend for gold.
But if the release is less than 2.6% that will support the bullish trend.
Pivot Line: 3365
Support: 3342 – 3320
Resistance: 3375 – 3395
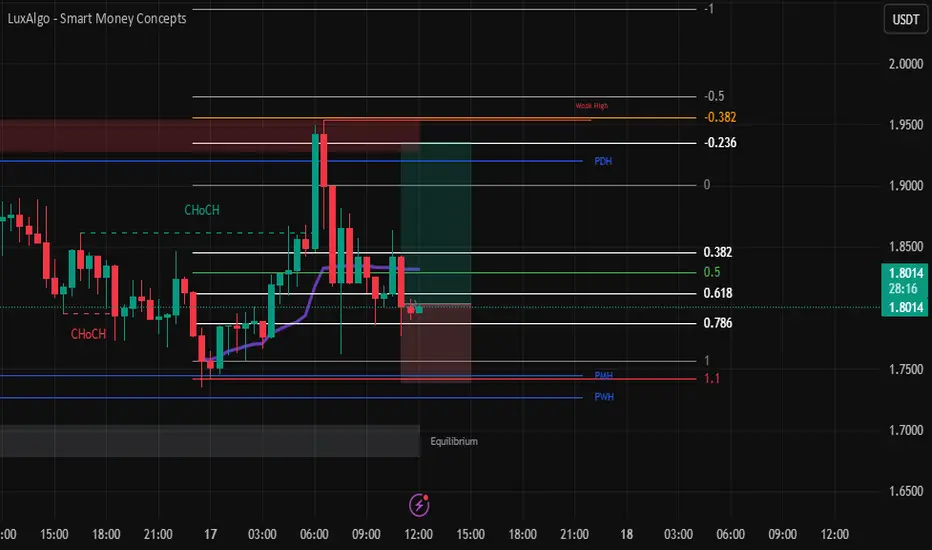
SPX LONG📘 Daily Trade Journal – Thursday, July 17
1. Trade Overview
- Asset:-SPX - Direction:** Long
- Entry Time:** After 10:00 p.m. (Vietnam Time)
- Timeframes Used:** 1H, 30m
- Bias Origin:** Bullish market structure continuation with recent change of character
---
2. Trade Idea (Before Entry)
I came to the charts shortly after 10:00 p.m. PopCat had just wicked into the 0.618 Fibonacci level. I considered it a chase, so I passed on it—didn’t get the retracement I wanted.
ETH and Solana were not retracing into the OTE zones either.
Pengu appeared more bearish—potentially forming a daily lower high, indicating slowing upside momentum. I ruled that one out too.
I ended up selecting **SPX**, trading it for the first time. Despite that, I stayed focused on structure and levels:
1H timeframe had a bullish **external break of structure.
30m timeframe showed a temporary bearish retracement, but then a bullish change of character followed.
This change of character swept the previous day’s high, which was a concern since that level was also my target, and it had already been touched—possibly by London.
Despite this, I decided to take the trade based on:
* Anchored Fibonacci from today's early session low to the current high
* Overall structure still being bullish
* Expecting a possible sweep of today’s **intraday high** and maybe even another test above **yesterday’s high**
---
### 3. **Entry Details**
* **Entry Price:** \
* **Risk Taken:** \
* **Stop Loss Placement:** Below the retracement swing low / point of invalidation
* **Confluences Used:**
* ✅ Fibonacci retracement
* ✅ Change of Character
* ❌ No AVWAP, trendlines, or order blocks used
---
### 4. **Exit Details**
*(To be completed when the trade closes)*
* **Exit Time:** \
* **Exit Price:** \
* **Reason for Exit:** \
---
### 5. **Outcome**
*(To be completed when the trade closes)*
* **P\&L:** \
* **Partial or Full Exit:** \
* **Session of Exit:** \
---
### 6. **Self-Assessment**
* ✅ **What went right?**
* Didn’t force a trade on assets that didn’t return to key levels.
* Stayed open to switching assets when familiar names didn’t provide ideal setups.
* Executed a setup based on structure, not emotional attachment.
* ❌ **What could be improved?**
* SPX target had already been swept—may need to reevaluate entering **after** key liquidity has already been taken.
* More clarity needed when trading unfamiliar assets for the first time (like SPX).
* 📋 **Did I follow my trading plan?**
* Yes. I stayed within my timeframe, followed structure, used Fibonacci, respected the process.
* 📈 **Would I take this trade again, exactly the same way?**
* Yes, with caution. Would want stronger confirmation if the target liquidity has already been touched. Otherwise, setup fits criteria.
* 🔎 **How would I rate this trade out of 10?**
* \
---
🧠 Notes for Improvement
Today, I didn’t fixate on one asset, which may be a strength.
Need to define a clearer protocol for **target levels that have already been swept**—whether to stand aside or expect continuation.
Emotionally balanced today. No FOMO trades. If this one plays out, great. If not, it’s still within plan.
---
💤 Closing Note
This is Day 3 of live journaling and publishing. One clean setup executed. No overtrading. I’ll let the market decide the outcome and stick to my commitment: one session, one plan, one trade idea. Back tomorrow—same window.
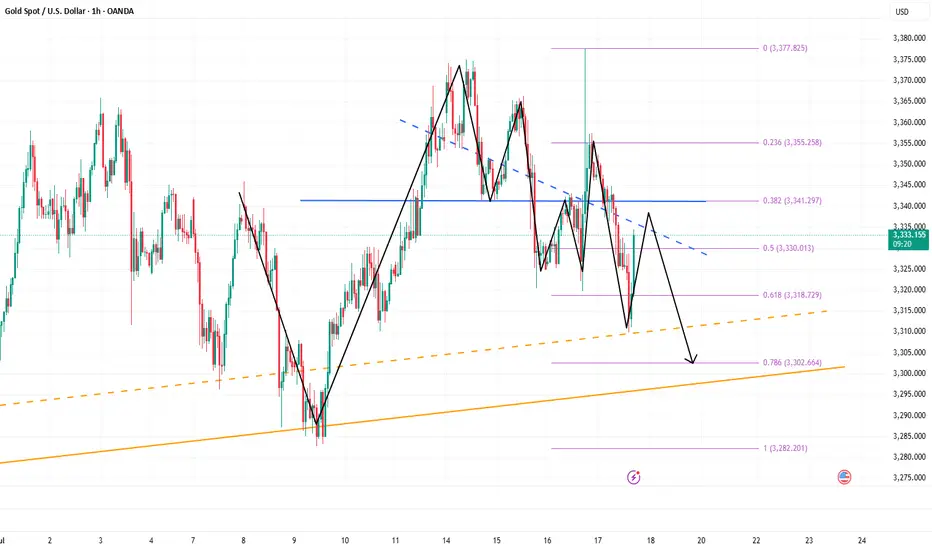
Gold’s Last Stand? Major Retest at 3310–3300 Under the influence of negative news, gold today fell below the recent low of 3320 and continued to fall to around 3310. The current gold structure looks particularly obvious, the center of gravity of gold gradually moves downward, and the short trend is extremely obvious; however, as gold repeatedly probes the 3320-3310 area, we can clearly see the resistance of gold to falling, and multiple structural supports are concentrated in the 3320-3300 area. So as long as gold does not fall below this area, gold bulls still have the potential to rebound.
However, for now, after experiencing discontinuous sharp rises and falls, gold needs to undergo a short-term technical repair, so it may be difficult for a unilateral trend to appear in the short term. So I have reason to believe that gold will focus on rectification and repair next. The important resistance area we have to pay attention to above is in the 3340-3350 area; and the important support below is in the 3310-3300 area.
Currently, gold is fluctuating in a narrow range around 3340, and the short-term rebound momentum is sufficient, but I still believe that gold will fall back again and test the support of 3320-3300 area after consuming the bullish energy. So for short-term trading, first of all, I advocate shorting gold in the 3340-3350 area, and expect gold to retreat to the 3320-3300 area during the consolidation process.
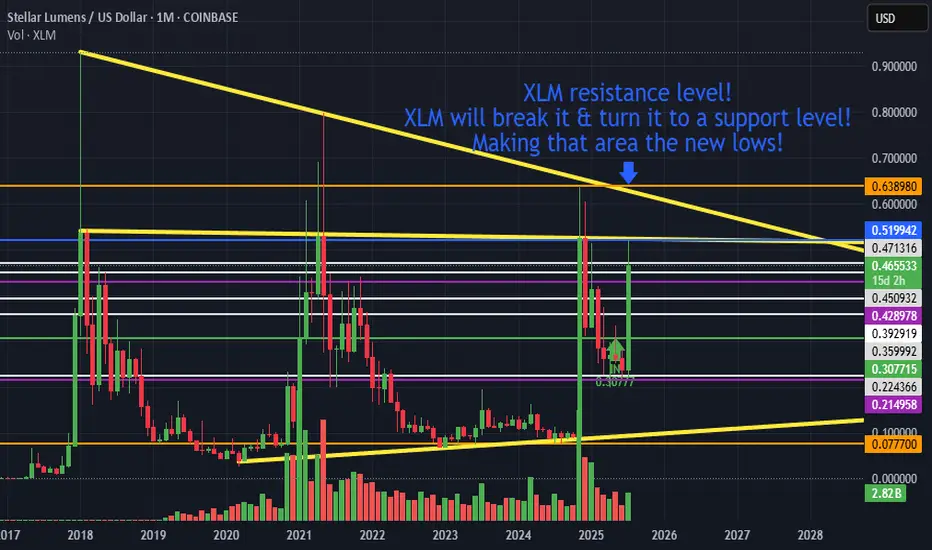
XLM new lows!XLM resistance level!
XLM will break it & turn it to a support level!
Making that area the new lows!
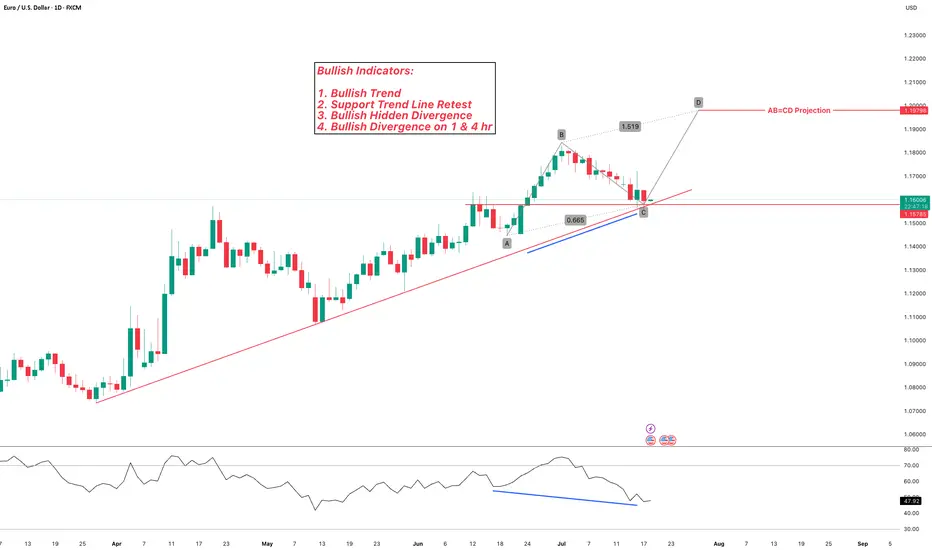
EURUSD Bullish Continuation OutlookFX:EURUSD has been trading in a bullish trend. Currently price is retesting the previous resistance level, as well as 0.618 fib. Hidden bullish divergence can be observed on the chart, in addition to regular bullish divergence on lower timeframes (1 & 4 hour).
I am expecting bullish continuation from here to complete the price projections!
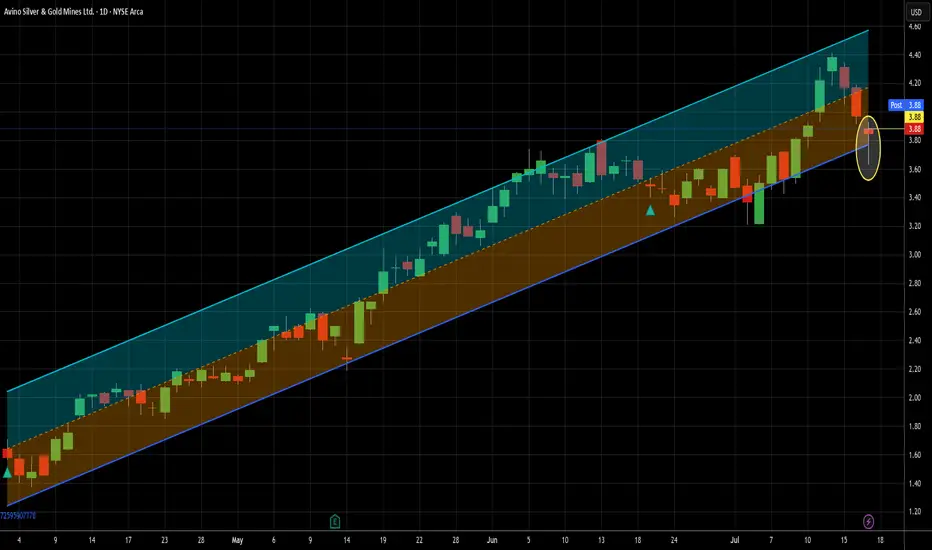
I'm just going to keep putting the hammer down - Long at 3.88I've done two other ideas for ASM in the last 3-1/2 months, so I'm not gonna rehash all those details here. If you are new to me or to my ideas for this ticker, just look at those. In them, I make a fairly compelling argument for short term trading this name. I'll sum it up quickly here - it's been extremely profitable. I'm expecting no different this time.
Since my last idea on June 20th, there has been only one buy signal on this name until this week, but that one paid 9.5% in two trading days. Today's signal is actually the 3rd in a row (not uncommon for this ticker) and full disclosure, I traded the other two so I'm in this already. That said, today's signal is extra spicy, thanks to that pretty little hammer of a candlestick that printed today. For those unfamiliar, it is often a sign of a bullish reversal. It requires confirmation, but given the perfect record my signals have provided to this point on ASM, I can justify not waiting for that confirmation as it can cause missed trades if the stock jumps 4 or 5% the next day, as it is fond of doing. But if someone were to jump in on this trade but wanted to wait for confirmation, I believe that the move here would last more than one day, should it happen.
I also have been increasing my exposure to inflation-related trades lately and why not get that from something that bumps like this does?
The solid uptrend that goes back well farther than this chart shows sweetens the deal even more. Given that my first recent signal clicked at the 4.17 level two days ago, I'm expecting a move to and beyond that level in the relatively near term, though that's obviously not a guarantee. I will likely get out of this leg of the trade before it gets there, unless it does it in one move, which isn't out of the question at all. That's only about 7.5% above the current price and this stock moves that much in a day semi-frequently. Twice in the last 7 trading days, in fact.
So that's my case. If the market stays semi-strong, this will likely stay weak until the market cools off some. This is my second add to my real life position, so I'm certainly not shy about adding more if my signals warrant it.
As always - this is intended as "edutainment" and my perspective on what I am or would be doing, not a recommendation for you to buy or sell. Act accordingly and invest at your own risk. DYOR and only make investments that make good financial sense for you in your current situation.
3340-3300: Lock in the buy high and sell low in this area!Under the influence of unemployment benefits and zero monthly sales data, gold fell sharply in the short term, but it did not effectively fall below 3310 during multiple tests, effectively curbing the further downward space of the shorts. Multiple structural supports are also concentrated in the 3310-3300 area, so as long as gold does not fall below this area, gold bulls still have the potential to rebound.
However, for the current gold market, it may be difficult to see a unilateral trend in the short term. After experiencing discontinuous surges and plunges, gold may focus on consolidation and repair, and the consolidation range may be limited to the 3340-3300 area.
So for short-term trading, first of all, I advocate going long on gold in the 3320-3310 area, and expect gold to rebound and reach the 3330-3340 area;
If gold reaches the 3335-3345 area as expected, we can start to consider shorting gold, and expect gold to step back to the 3320-3310 area during the shock and rectification process.
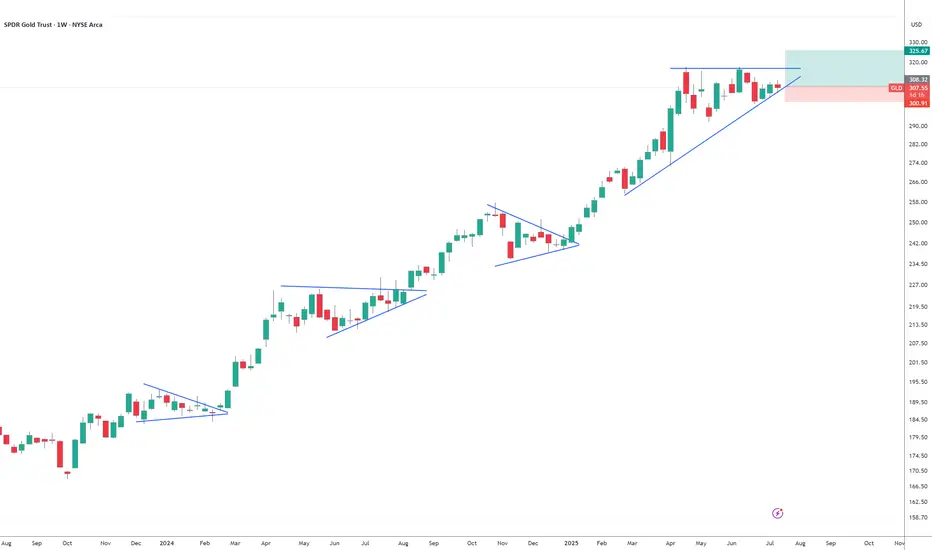
Gold!!!!!Looks like GLD is setting up for a big move to the upside. It likes to consolidate for a few weeks before a massive breakout. I have some GLD calls strike 310 for September 19. My SL triggers if a weekly candle closes under trendline. TP 325 ish.
Gold. Swing Signal ONLY no detail. 17/July/25XAUSD.. For the past I try to give as detailed as possible on my chart for learning purpose BUT end up fewer likes and "complicated" to understand comments.. I hope this time you are not getting signals only But nothings to learn...
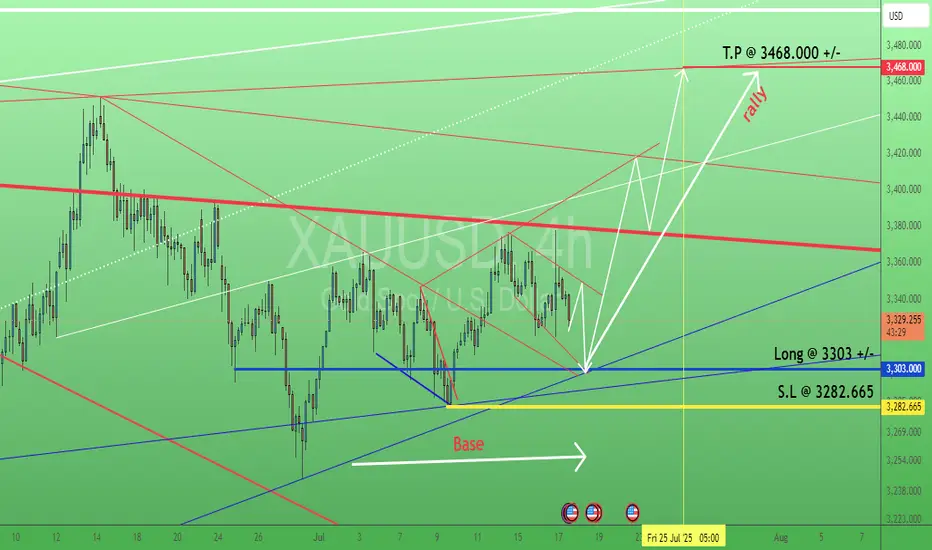
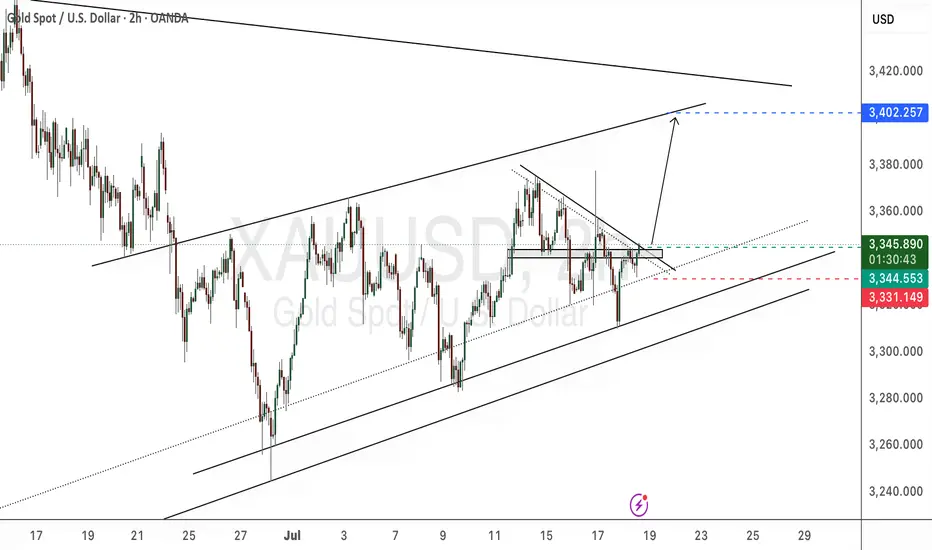
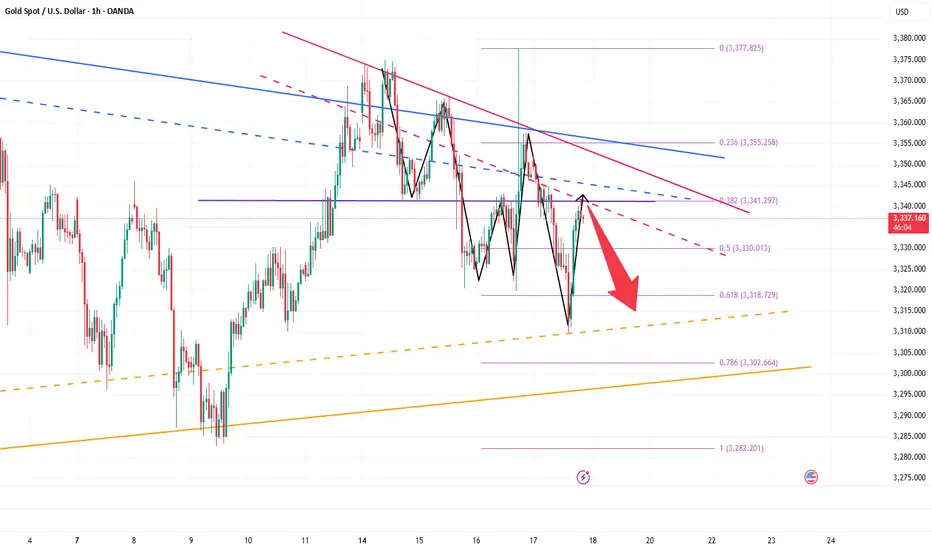
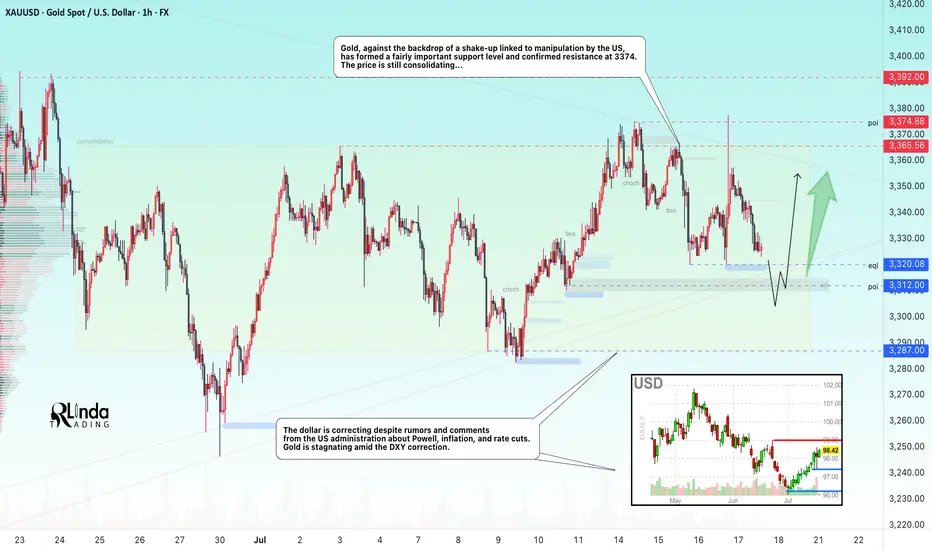
GOLD → The triangle is contracting. Retest of support...FX:XAUUSD tested a local high of 3375 but quickly returned to consolidation. The reason is manipulation by the US administration related to Powell, inflation, and interest rates...
Demand for gold has risen sharply amid global risks: Trump's aggressive tariff plans, strong inflation, and uncertainty about the Fed's actions have increased interest in defensive assets. Despite the temporary strengthening of the dollar, gold remains a popular hedging instrument. Technical analysis also points to a bullish outlook. However, growth potential is limited until the Fed clarifies its interest rate policy
Technically, on the D1 chart, it is clear that the price is consolidating, with the range continuing to narrow. Due to the bullish factors listed above, we can expect growth to continue. However, it is difficult to say where and when the growth will begin due to the uncertainty factor. All attention is on the support at 3320-3312, the triangle support, as well as the consolidation support at 3287.
Resistance levels: 3365, 3375
Support levels: 3320, 3312, 3287
Since the opening of the session, the price has spent part of its daily range, so there may not be enough potential for the decline to continue. A false breakdown of support and consolidation of the price above the key zone may attract buyers, which will trigger growth towards resistance.
Best regards, R. Linda!
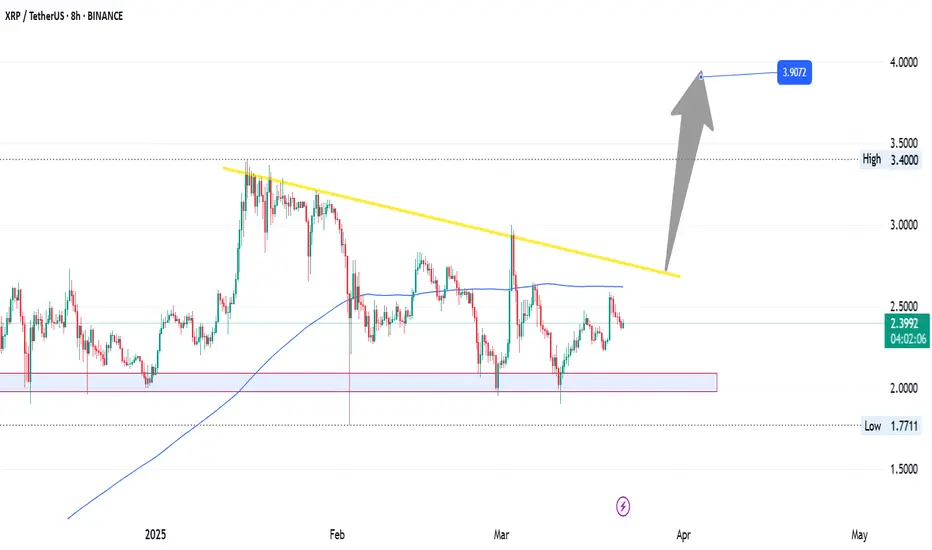
XRP’s Descending Trendline Showdown: Is a Breakout Toward $4From a purely technical‐analysis standpoint (not financial advice), here are a few observations and ideas you can take into xrp/usdt
1. Descending Trendline Resistance
- Price has been making lower highs, forming that yellow descending trendline. A sustained break and close above it (on higher‐than‐average volume) would be a strong bullish signal.
- If price rejects at the trendline again, that often implies more consolidation or another leg downward, so watch how price reacts if/when it retests that line.
2. Moving Average Context
- It looks like the market is hovering near or just below a key moving average (blue line). If the price can reclaim that moving average and stay above it, it typically signals renewed bullish momentum. Conversely, continued closes below it can cap upside.
3. Key Support Zones
- The pink/gray box in the chart (roughly the 2.0–2.1 area) seems to be an important support region; buyers have stepped in there before.
- Below that, the 1.77–1.80 area looks like a major support “floor” (dotted line). If price were to break below that, it could trigger a deeper pullback.
4. Potential Upside Targets
- The horizontal level around 3.40 is the next big resistance if price can break out above the descending trendline.
- If bulls really take over and push through that 3.40 zone, a run toward 3.90–4.00 (as shown by the arrow) becomes more plausible.
5. Watch Volume and Momentum**
- Pay attention to volume on any breakout. A low‐volume push above the trendline can be a fakeout, whereas a strong volume surge confirms conviction.
- Oscillators (RSI, MACD, etc.) can help you gauge whether momentum is building or fading as price approaches resistance.
Overall, a breakout above the descending trendline plus a reclaim of the moving average would favor upside toward the mid‐3s or higher. Failure to break out, however, might lead to another test of that 2.0–2.1 support or even the 1.77 floor. Keep risk management in mind either way.
THAT WHAT YOU NEED TO KNOW ABOUT BTC IN 2025Professional Technical Analysis & Trading Plan for BTC/USD (Hypothetical 2025 Data)
---
1. Technical Structure & Key Observations
A. Price Context:
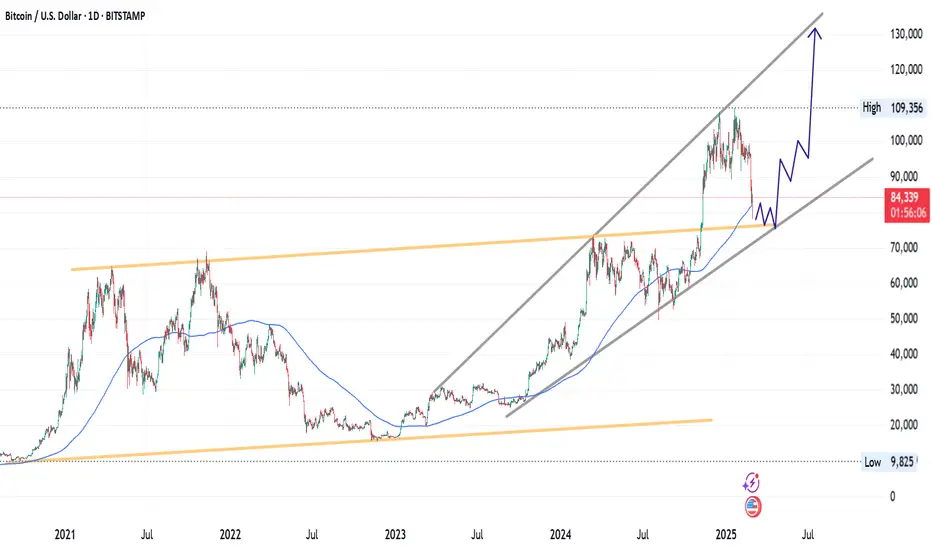
- **Current Price:** ~84,197 (below SMA 81,998).
- **SMA (Simple Moving Average):** 81,998 (likely 200-day SMA, acting as dynamic resistance).
- **Volume:** 52K (low volume suggests consolidation; watch for spikes to confirm breaks).
C. Key Levels (From Data):
- **Resistance:**
- Immediate: 81,998 (SMA).
- Major: 90,000, 100,000, 130,000 (swing highs).
- **Support:**
- Near-term: 74,000 (psychological),
---
2. Advanced Indicator Analysis
A. Momentum (RSI & MACD):**
- **RSI (14):** Likely near 40–45 (neutral-bearish zone). A break below 30 signals oversold; above 55 confirms bullish momentum.
- **MACD:** Bearish crossover possible (signal line above MACD line). Watch for reversal above SMA.
B. Volume Profile:
- **Low Volume (52K):** Indicates weak participation. A surge above 100K on a breakout/breakdown would validate direction.
- **Volume-Weighted Average Price (VWAP):** If price trades above VWAP, bullish bias strengthens.
---
3. Trading Strategies
Scenario : Bullish Reversal (30% Probability)
- **Trigger:** Daily close above SMA (81,998) with volume >100K.
- **Entry:** Long at 74,500 (confirmation of strength).
- **Targets:**
- TP1: 90,000 (8.5% move).
- TP2: 100,000 (19% move).
- **Stop Loss:** 71,500
---
5. Sentiment & Catalyst Watch
- **Bullish Catalysts:** Institutional ETF inflows, Fed rate cuts, Bitcoin halving momentum.
- **Bearish Risks:** Regulatory crackdowns, exchange hacks, macro recession.
-Conclusion
BTC/USD is at a critical juncture. *Trade the SMA break/breakdown with volume confirmation*, and prioritize risk-reward ratios. Always cross-verify with real-time data and news.
Disclaimer: Hypothetical analysis for educational purposes. Not financial advice.* 🚀
BONKUSDT: The Meme Coin Ready to Bounce! 📊 Key Stats (Live Update)
- Current Price: $0.000022
- Volume: $1.33M (Accumulation phase)
📈 Critical Levels
- Strong Support: $0.0000192
- Immediate Resistance: $0.000027
- Breakout Target: $0.00004 (+85% upside)
🔥 Why BONK Could Moon
1. Extreme Discount: 92% below ATH ($0.00003275)
2. Meme Coin Rally: WIF +12% today showing sector strength
3. Technical Setup: Bullish divergence forming
🎯 Trading Plan (Updated)
- Ideal Entry: $0.000019-$0.000020 zone 🚀
- Scalp Targets:
→ $0.000025 (+13.2%)
→ $0.000027 (+22.2%)
- Swing Targets:
→ $0.000028 (+40%)
→ $0.000035 (+75%)
- Risk Management:
→ Stop Loss: $0.000018
→ Position Size: 1-3% of portfolio
⚠️ Crucial Notes
1. High volatility expected - set alerts
2. Watch BTC dominance for market direction
3. Smaller exchanges may have price discrepancies
📌 Unique Opportunity
At current levels, BONK offers one of the highest risk/reward ratios in meme coins with:
- 80%+ upside potential to ATH
- Limited downside to strong support
🔍 Live Metrics to Watch
1. 4H RSI: 52 (neutral)
2. Volume Spike: $2M+ needed for breakout
3. Exchange inflows/outflows
---
NOT FINANCE ADVICE | DYOR always 💡 Visual Enhancements
Ready for the BONK resurgence? Would you like me to adjust the entry strategy for more conservative traders? 🐶
