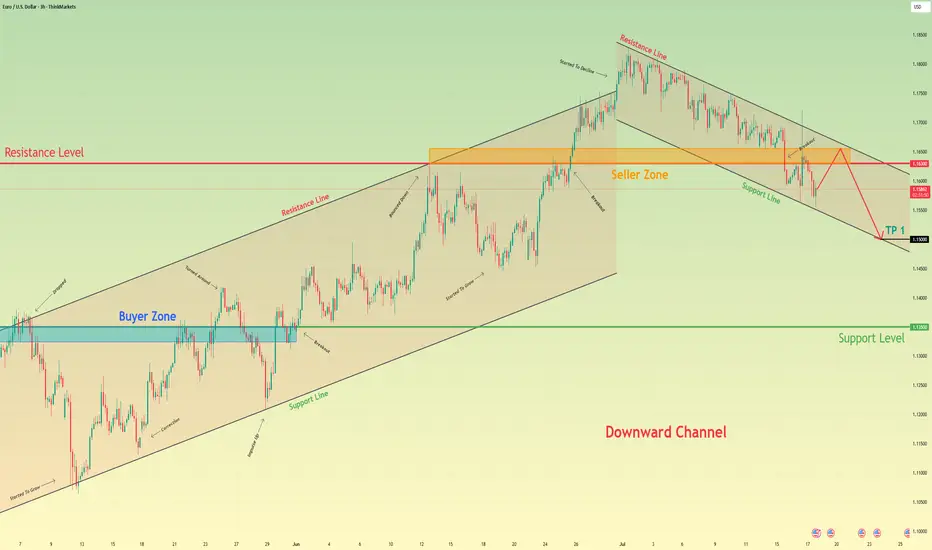
Euro may reach seller zone and then continue to fall in channelHello traders, I want share with you my opinion about Euro. The price pair has recently shifted its market structure, establishing a clear downward channel after breaking its previous uptrend. Before this breakdown, the price was consistently trading within an Upward Channel, repeatedly finding support in the buyer zone (1.1325–1.1350) and reversing upward. The bullish momentum eventually faded when the price failed to break the major horizontal resistance level at 1.1630. This failure triggered a strong bearish impulse, leading to a decisive breakout below the channel's support line and confirming a trend reversal. Currently, the price is making a corrective move up inside the newly formed downward channel, which appears to be a classic retest of the broken structure from below. I expect this upward move to stall as it approaches the heavy confluence of resistance formed by the channel's upper Resistance Line and the horizontal seller zone at 1.1630–1.1655. After testing this area, I anticipate a rejection and the beginning of a new bearish leg down. That's why I've set my TP at the 1.1500 level — it aligns perfectly with the support line of the current downward channel, making it a logical target for sellers. Please share this idea with your friends and click Boost 🚀
Disclaimer: As part of ThinkMarkets’ Influencer Program, I am sponsored to share and publish their charts in my analysis.
Trend Lines
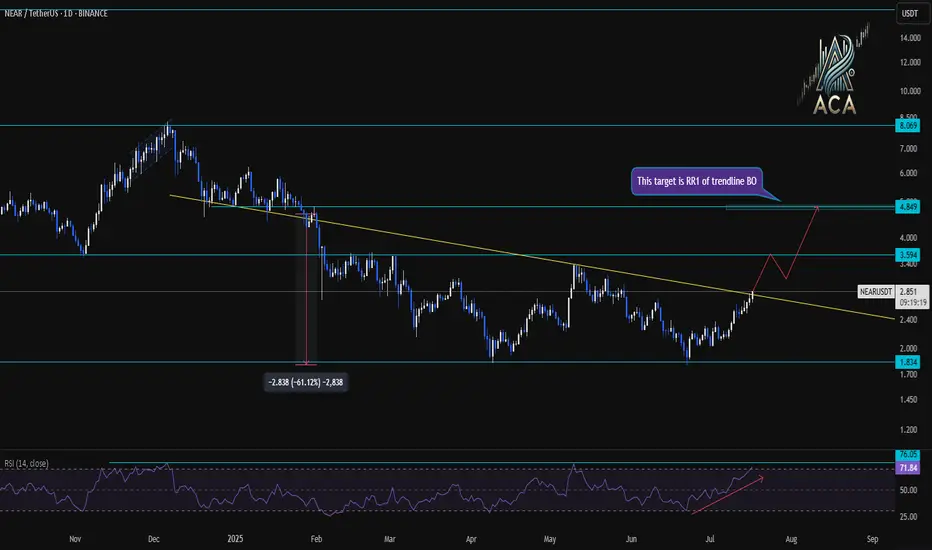
NEARUSDT Daily Chart Analysis|Strong Breakout & RSI ConfirmationNEARUSDT Daily Chart Analysis | Strong Breakout & RSI Confirmation
🔍 Let’s break down the latest NEAR/USDT daily chart, spotlighting critical resistance, target levels, and momentum signals.
⏳ Daily Overview
NEAR has confirmed a bullish breakout above its long-term descending trendline. This move comes with a surge in price and a strong daily candle—clear evidence of renewed bullish momentum.
📊 Momentum & RSI
RSI has surged to 76 (overbought zone), higher than the typical overbought level of 70. This spike reflects strong buying pressure, but also signals the possibility of near-term pullback or consolidation.
RSI-Momentum Convergence: The RSI uptrend is in lockstep with price action, confirming that bullish momentum is genuine and backed by increasing strength—not a divergence.
🔑 Key Levels
- First Resistance: $3.59—watch this closely as the next hurdle for bulls.
- Breakout Target: $4.85, which corresponds to the measured move (RR1) from the trendline breakout and aligns with the next horizontal resistance.
- Extension Target: $8.01 if momentum persists and price sustains above $4.85 in the coming weeks.
📌 Highlights
- Clear trendline breakout validated by strong RSI convergence.
- RSI has entered the overbought zone (76), backing momentum—watch for either breakout follow-through or brief cooling.
- Key levels: $3.59 (first resistance), $4.85 (breakout target).
🚨 Conclusion
Momentum is with the bulls after the breakout. Eyes on $3.59 as the near-term test; a clean move above opens up $4.85 and potentially $8.01 if momentum continues.
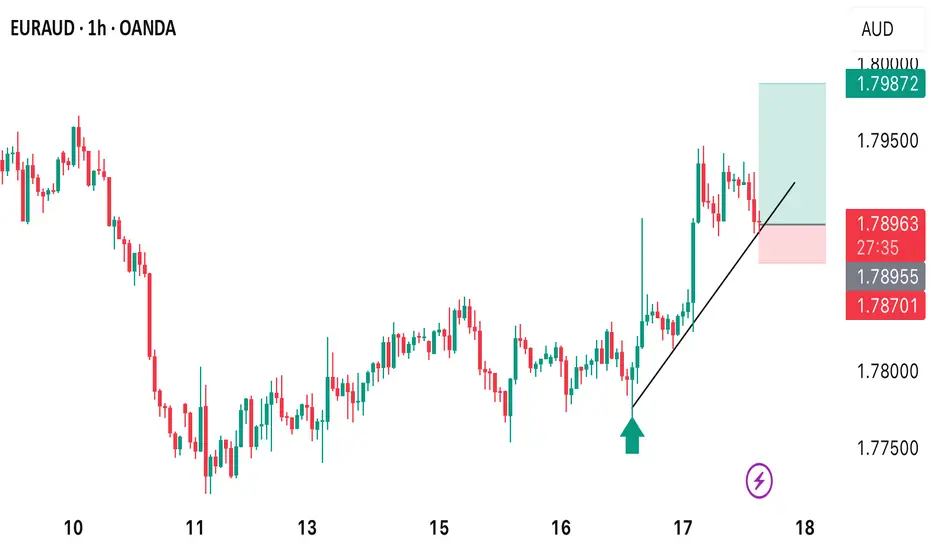
EURAUD BUY OPPORTUNITY Buying from the current market gives an edge to capitalise on the bullish trend that’s developing after a major pullback that happed in the H4 timeframe.
Our target is at 1.79872
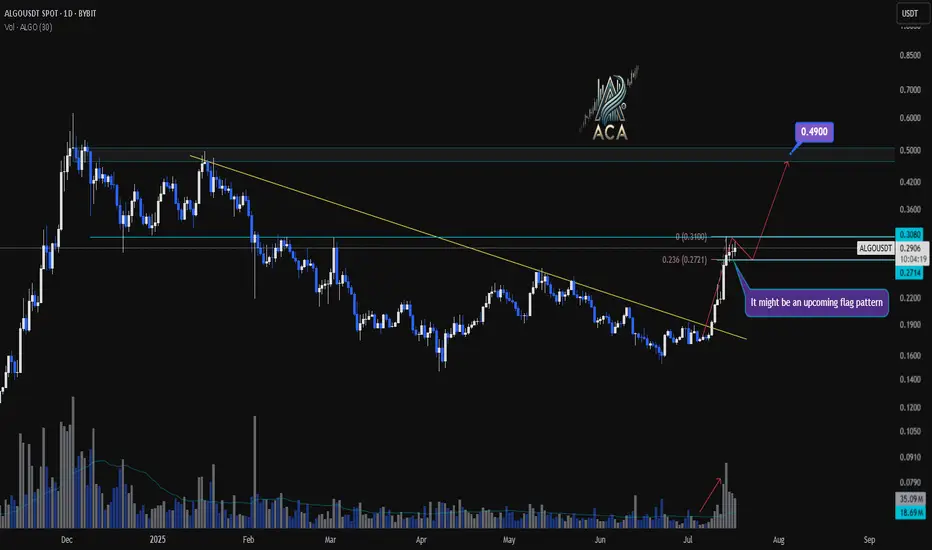
ALGOUSDT Daily Chart Analysis | Continuational patternsALGOUSDT Daily Chart Analysis | Momentum Picks Up on Higher Timeframe
🔍 Let’s break down the latest ALGO/USDT daily chart, highlighting a shift in market structure and key bullish signals.
⏳ Daily Overview
A decisive breakout above the long-standing descending trendline has flipped the narrative for ALGOUSDT. Increased volume during the breakout points to robust bullish momentum, suggesting buyers are regaining control at this multi-month inflection point.
🔔 Flag Pattern & Chart Structure
- Bullish flag pattern is emerging after the recent breakout, as price consolidates in a tight range—a classic continuation formation.
- Former trendline resistance is now acting as support, confirming a notable shift on the higher timeframe.
📐 Fibonacci & Target Levels
- The 0.236 Fibonacci retracement at $0.2771 is providing immediate support, with price consolidating above this anchor level.
- Upside targets:
- First resistance at $0.3080, which aligns with horizontal supply and previous pivot highs.
- If the flag pattern resolves upward, the next Fibonacci extension points to $0.4900, marking a significant confluence and potential for further gains.
📊 Key Highlights
- Strong daily candle and surging volume confirm momentum shift.
- Watch the developing flag pattern for breakout confirmation.
- Major trendline break on the daily signals structural reversal.
- $0.3080 is the immediate target; $0.4900 is the extended objective from the flag/Fibonacci alignment.
🚨 Conclusion
ALGOUSDT is setting up a compelling bullish scenario—keep a close eye on price behavior at the flag and $0.3080 level. A breakout may trigger the next impulsive move toward $0.4900.
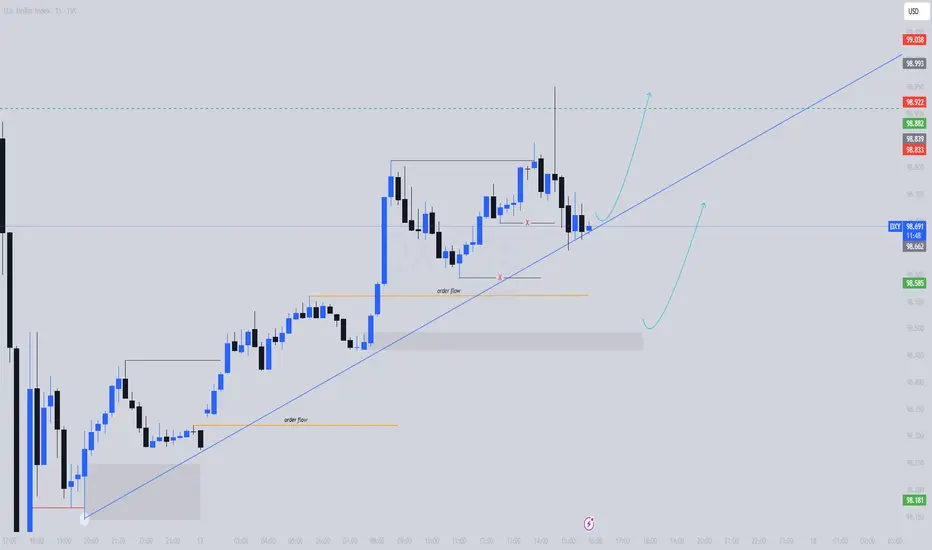
DXY Trade Bias | Bullish Continuation Structure🔍 Chart Breakdown:
Trendline support respected
Order flow blocks (OBs) unbroken — confirming demand
Minor liquidity grabs without breaking bullish structure
Double mitigation of intraday OB, implying potential bullish continuation
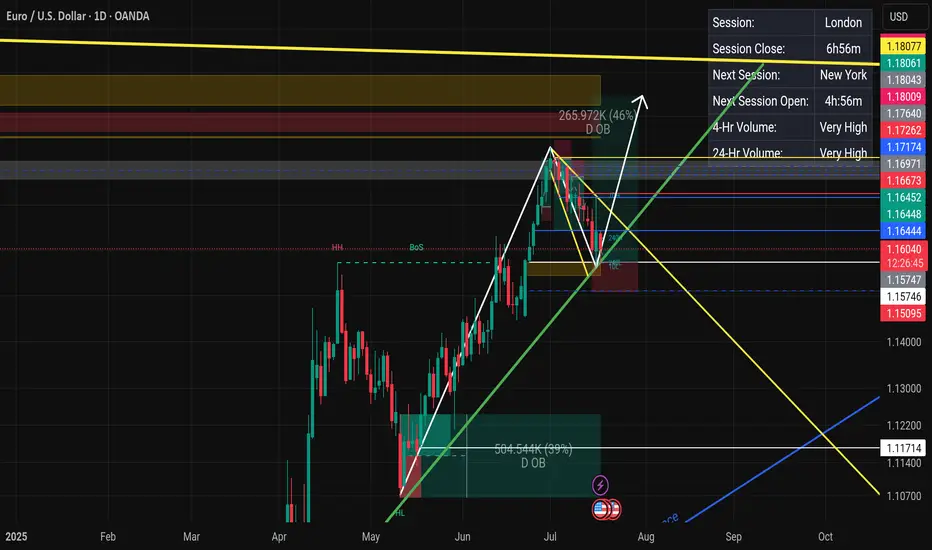
EURUSD: Support & Resistance Analysis 🇪🇺🇺🇸
Here is my fresh support & resistance analysis for EURUSD.
Vertical Structures
Vertical Support 1: Rising trend line
Vertical Support 2: Falling trend line
Vertical Resistance 1: Falling trend line
Horizontal Structures
Support 1: 1.1577 - 1.1600 area
Support 2: 1.1445 - 1.1458 area
Support 3: 1.1356 - 1.1373 area
Support 4: 1.1190 - 1.1280 area
Resistance 1: 1.1682 - 1.1766 area
Resistance 2: 1.1807 - 1.1830 area
Consider these structures for pullback/breakout trading.
❤️Please, support my work with like, thank you!❤️
I am part of Trade Nation's Influencer program and receive a monthly fee for using their TradingView charts in my analysis.

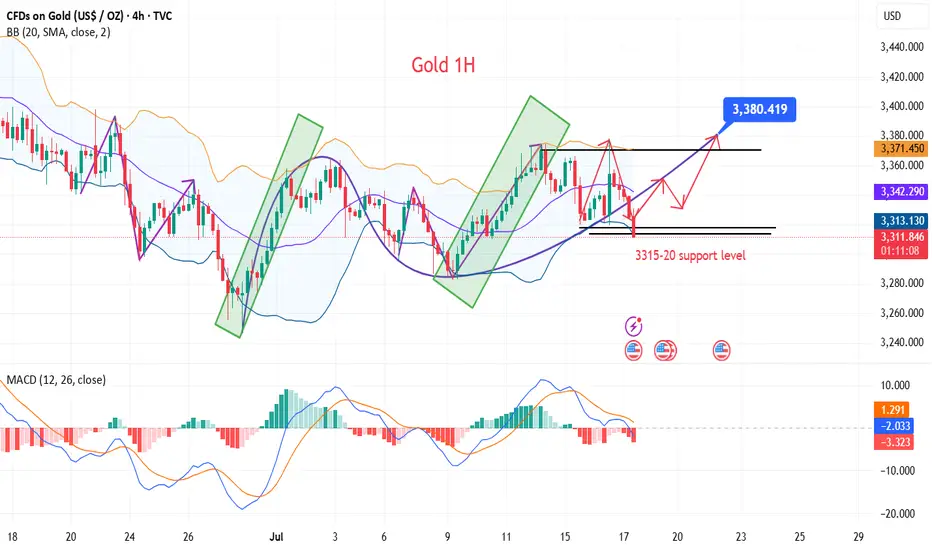
Gold pullback bulls are a winning streak strategy
💡Message Strategy
Gold prices experienced a roller coaster ride on Wednesday, mainly due to a Bloomberg report that Trump was considering firing Federal Reserve Chairman Powell (Trump wants to cut interest rates as soon as possible and the Fed is cautious). This quickly ignited the market's risk aversion sentiment, pushing gold prices up quickly by $50. However, after the rise, gold soon encountered resistance and gave up nearly $40 in gains, as Trump quickly denied the plan and the market's risk aversion sentiment cooled.
Gold prices fluctuated and fell on Thursday as Trump denied plans to fire Powell. Due to the rise in US CPI data released earlier, investors' expectations for the Fed's interest rate cuts cooled, which began to affect the market again. Looking ahead, investors still need to pay attention to the impact of Trump's tariff remarks and the Fed's monetary policy outlook on gold prices.
📊Technical aspects
After hitting a three-week high, gold prices fell back and continued to fluctuate in a wide range.
Gold is still in a bullish pattern. The support below focuses on Tuesday's low of $3,320, which is near the position where gold prices stabilized and rose in the Asian and European sessions on Wednesday, and near the position where gold prices fell and stabilized and rose in the US session on Wednesday. This is also the core position of our trading this week.
Gold's upper pressure focuses on the downward breakthrough of gold prices in the Asian and European sessions at $3,345, which is also the low point where gold prices quickly fell after rising on Wednesday. Secondly, focus on the intraday high of $3,375. The 5-day moving average slowed down after a slight golden cross, the MACD indicator slightly crossed upward, and the KDJ and RSI indicators formed a dead cross. The short-term technical aspect suggests that gold prices have a short-term upward trend.
💰Strategy Package
Long Position:3300-3315,SL:3280,Target: 3360-3370
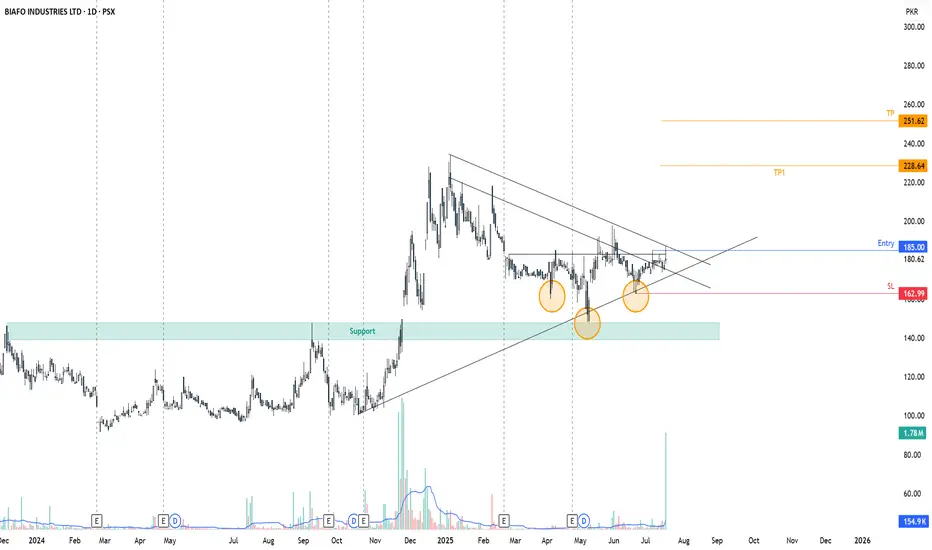
Are you seeing BIFO next Upper cap?BIFO has already shown bullish divergence and formed an Inverted Head and shoulder pattern. On the breakout of Resistance, it can make a fine move.
Are you seeing it next Upper cap?
Gold Ranging Between HTF Zones — Buy Setup FormingHello everybody!
Price is fluctuating between two higher timeframe supply and demand areas.
The market structure on the lower timeframes changed yesterday, and now we’re watching to see if the newly formed small demand zone will hold.
The break of the downward trendline is our signal to enter a buy position.

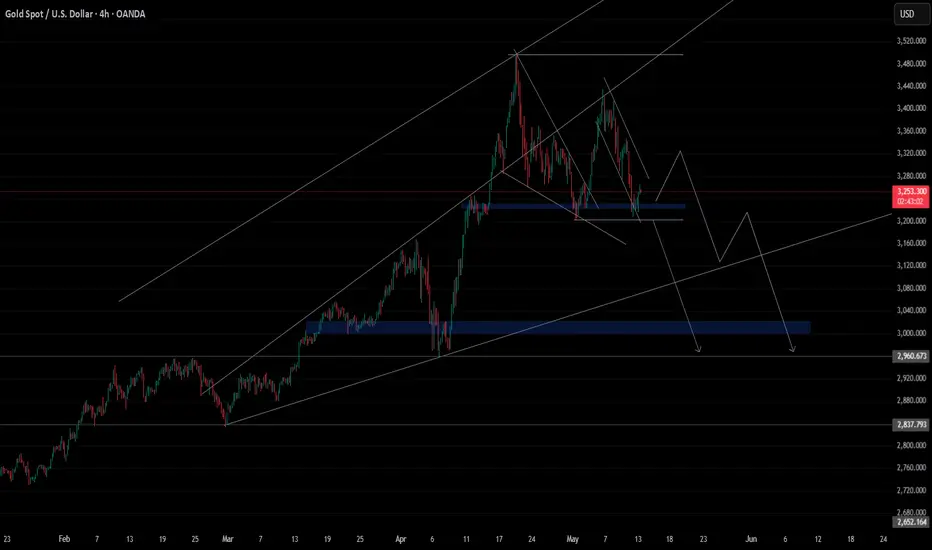
Gold Setup. Midas losing his touch.TVC:GOLD has reached an all time high of $3500. It further created a LH @ $3435 in the daily TF. This signals the beginning of a possible down trend of the commodity with the current fundamentals as confluence.
Furthermore, TVC:GOLD is likely to reach level $3160 and possibly test levels as low as $2960, below the much acclaimed $3000 support structure.
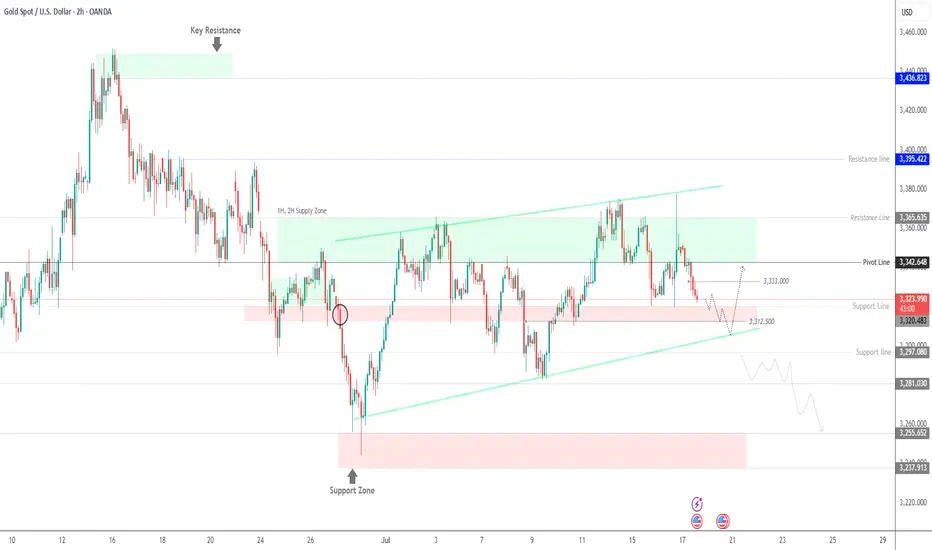
GOLD | Testing Key Support at 3320 — Breakdown or Rebound Ahead?GOLD: Futures Dip as Dollar Strengthens, Eyes on 3320 Support
Gold futures declined as the U.S. dollar gained strength following President Trump’s denial of plans to fire Fed Chair Jerome Powell. While concerns over central bank independence persist, gold remains up over 26% YTD, supported by strong central bank demand and ongoing macro uncertainty.
Technical Outlook:
The price is now approaching the 3320–3312 zone.
A break below 3312 would trigger a bearish move from 3315 toward 3297 and 3281.
However, if the price stabilizes above 3320 on a 4H close, a bullish rebound may follow toward 3333 and 3342.
Key Levels:
Support: 3312, 3297, 3281
Resistance: 3333, 3342, 3363
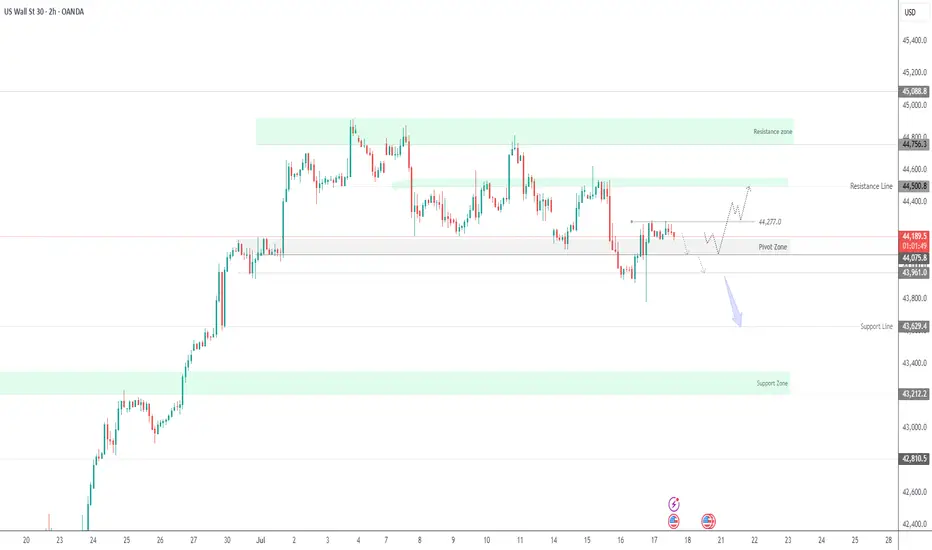
US30 | Bearish Pressure Builds Below 44,170 — Breakout or BounceUS30: Eyes on Earnings and News
US stocks edged higher pre-market after Trump denied plans to fire Fed Chair Powell, easing market concerns. With corporate earnings in focus, sentiment remains cautiously optimistic.
Technical View:
The price holds bullish momentum above 44170, targeting 44280 and 44500.
A 1H close below 44170 may lead to a drop toward 44075, and breaking below that would open the path to 43960 and 43630.
A 1H close above 44280 strengthens the bullish case toward 44500.
Key Levels:
Resistance: 44280, 44410, 44500
Support: 44075, 43960, 43630
previous idea:
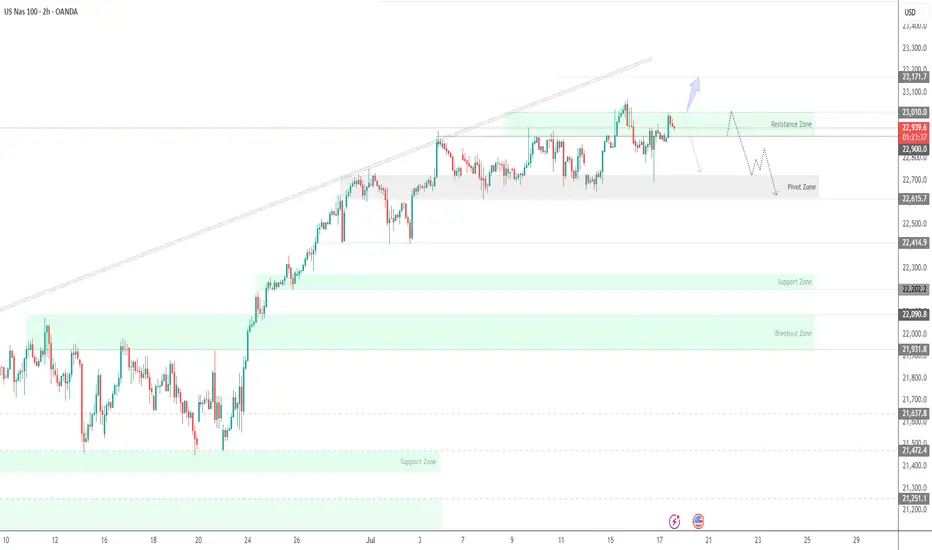
USNAS100 | Consolidation 23010 - 22900, Bearish or Not Yet...USNAS100: Cautious Consolidation as Powell Uncertainty Lingers
Following political noise around Fed Chair Powell — with Trump admitting he floated the idea of replacing him — tech markets have entered a cautious consolidation. While no immediate action was taken, the underlying uncertainty continues to weigh on sentiment, especially in rate-sensitive sectors like tech.
Technically: Consolidation Before the Break
The price is currently consolidating between 22900 and 23010.
A confirmed 1H close below 22900 would signal the start of a bearish trend, targeting 22700 and 22615.
Conversely, a close above 23010 would open the path toward a new all-time high (ATH) at 23170.
Key Levels:
Support: 22700, 22615
Resistance: 23010, 23170
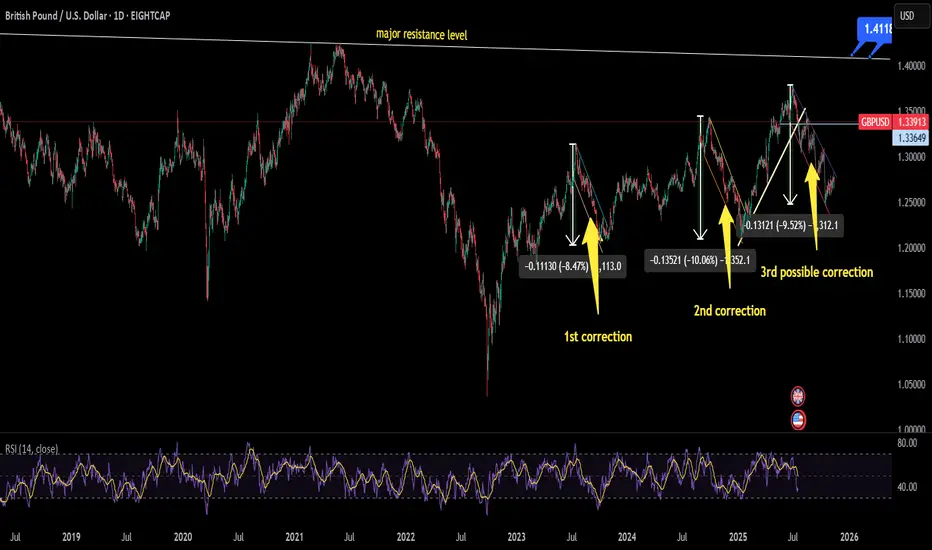
will GBPUSD make its 3rd correction???currently price is testing marked trendline which is acting as support level for a decent time if this level price will reverse its trend from here and will hit major resistance level which also has been drawn but if price action follows what it has done twice in the past then chances are that trend will enter in correction phase which is 3rd phase. In all this movement of DXY will play major role if DXY will continue to move upward pair will follow bearish trend and vice versa
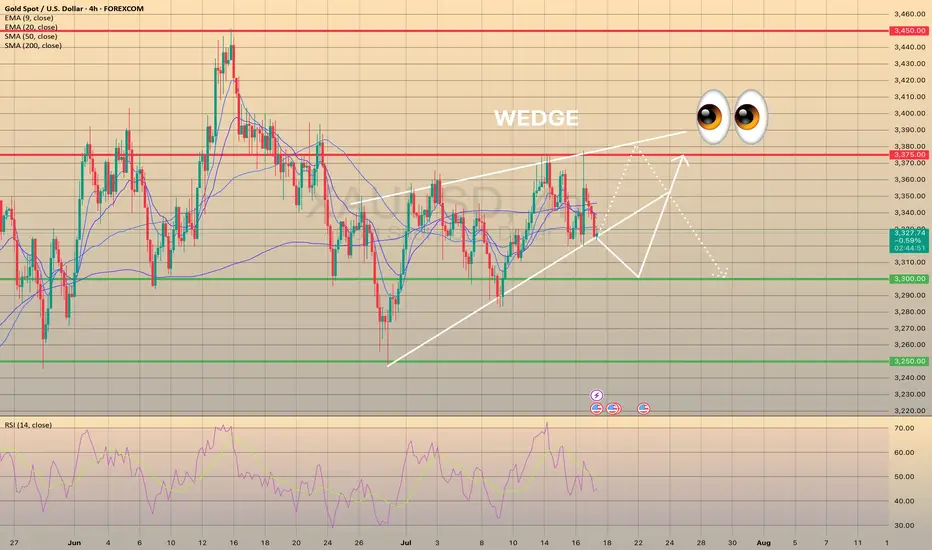
WEDGE IN XAUUSD, POSSIBLE OUTCOMESWEDGE IN XAUUSD, POSSIBLE OUTCOMES👀
Since the fundamentals didn't influence this asset (I mean yesterdays U.S. PPI report, escalation in the Middle East and Trump's hint on Powell's resignation), let's talk about technicals in gold.
XAUUSD primarily trades sideways since the beginning of June. Main support levels are 3,250.00 and 3,300.00. Main resistant levels are 3,375.00 and 3,450.00. Currently the asset trades within a range of 3,300.00 - 3,375.00. Additionally, bullion has formed a bearish wedge since the beginning of July. Right now the price is heading towards lower border of this wedge, where the SMA50 is situated and may act as an additional support here.
I see 2 main scenarios for a mid-term here:
1) Break below the wedge, rebound from 3,300.00 support, targeting 3,375.00.
2) Rebound from the wedge’s lower border, show a bearish move to 3,375.00, then drop to 3,300.00.
In both cases, I assume the price to stay sideways for a long period of time.
SPX500: Calm Returns, But Bearish Pressure Lingers Below 6283SPX500 OVERVIEW
Markets Calm After Powell Drama
Markets steadied Thursday following Wall Street's volatile reaction to uncertainty over Fed Chair Powell’s future. While President Trump denied plans to fire Powell, he admitted discussing the idea with lawmakers and hinted he'd prefer a resignation. For now, earnings and data are back in focus.
Technical View:
SPX500 is consolidating between 6283 and 6223.
A 1H close above 6283 may trigger a bullish move toward 6341.
Remaining below 6283 keeps bearish momentum intact toward 6223, and a break below that could start a deeper downtrend.
Key Levels:
Support: 6243, 6223, 6195
Resistance: 6305, 6341

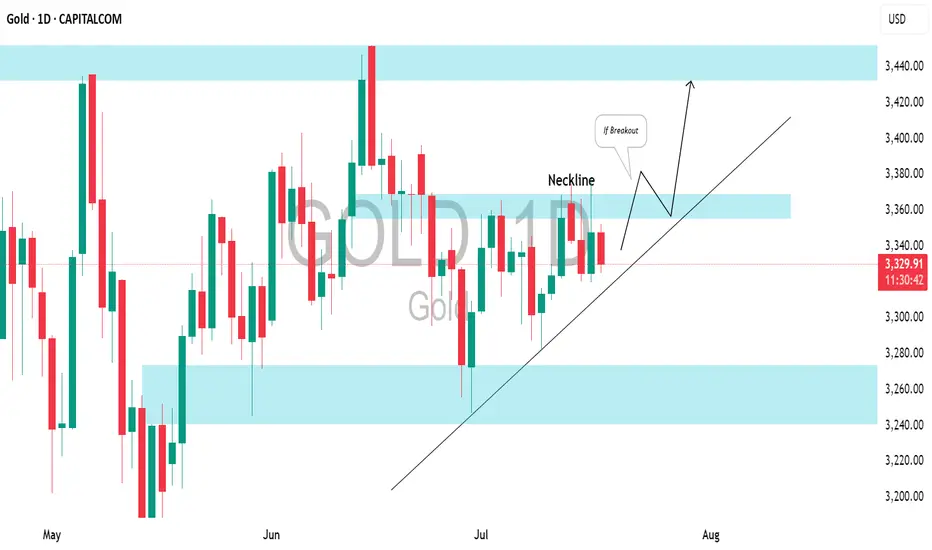
GOLD (XAUUSD): Bullish Accumulation PatternI spotted a clear ascending triangle pattern on a daily time frame.
To validate a bullish continuation, we need a breakout above the neckline.
A daily candle close above 3370 will serve as a strong confirmation, and we can expect a move up to at least the 3440 resistance level.
The firing of Powell set off the market, don't chase the longsTrump showed a draft of the letter to fire Powell, but whether Powell will be fired in the end remains to be seen, but the impact on the gold market is undoubtedly huge. The wolves have now smelled a very dangerous scent. Don’t chase high prices. Don’t chase high prices! ! ! After all, the impact of the news comes and goes quickly, and there is a high possibility of a reversal later in the evening. The final suppression position of the current gold daily line is 3340. If the closing line today can maintain above 3340, then gold will usher in a real bullish trend in the future.
OANDA:XAUUSD
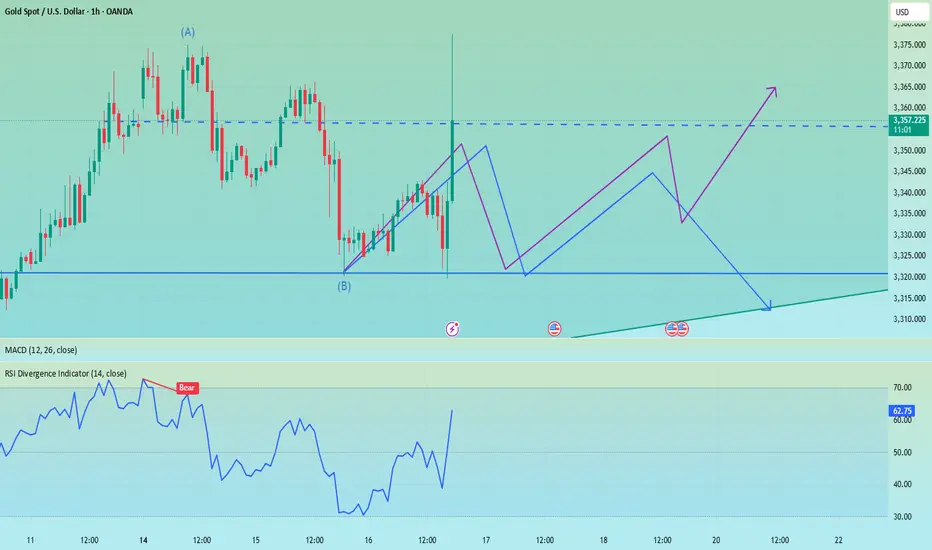
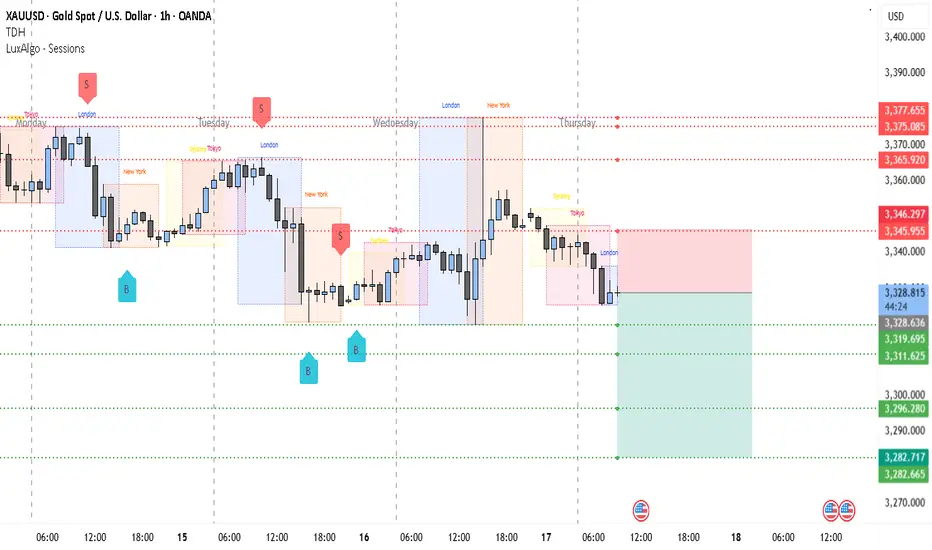
Gold Slips in London – $3,296 Incoming?📉 XAUUSD 1H Bearish Analysis – July 17, 2025
Gold (XAUUSD) is showing clear signs of bearish momentum on the 1-hour chart. After forming a local high around the $3,346–$3,347 region, price was sharply rejected and has since maintained a lower high structure. This rejection came right after the London session began, confirming that institutional volume is likely favoring the downside for now.
The previous few sessions show multiple failed attempts to break above the $3,346–$3,365 range. Sellers are consistently stepping in near those zones, marking a strong supply area. Meanwhile, recent candles have broken below the intraday support around $3,327.74, showing bearish continuation is underway.
Session activity is also in favor of the bears. The current London session opened weak, following a failure to hold above the previous session highs. Typically, gold experiences volatility during London and New York overlaps, and given the current structure, the pressure seems tilted to the downside.
From a broader perspective, the lower highs and lower lows on the 1-hour chart confirm a short-term downtrend. Price is now hovering just above $3,319 support—if this level is taken out cleanly with volume, it opens the path to deeper targets.
________________________________________
📌 Trading Setup (Short Bias)
• Entry: $3,327.74 (breakdown zone)
• Stop-loss: $3,346.29 (above last supply rejection)
• Take-Profit 1: $3,319.69
• Take-Profit 2: $3,311.62
• Take-Profit 3: $3,296.28
• Take-Profit 4 (extended): $3,282.66
________________________________________
If price manages to hold below $3,328 with consecutive rejections on any pullback, this bearish thesis remains valid. A breakdown below $3,311 would likely trigger momentum-driven selling toward $3,296 and potentially $3,282. However, any 1H close back above $3,346 would invalidate the current setup and favor a temporary bullish retracement.
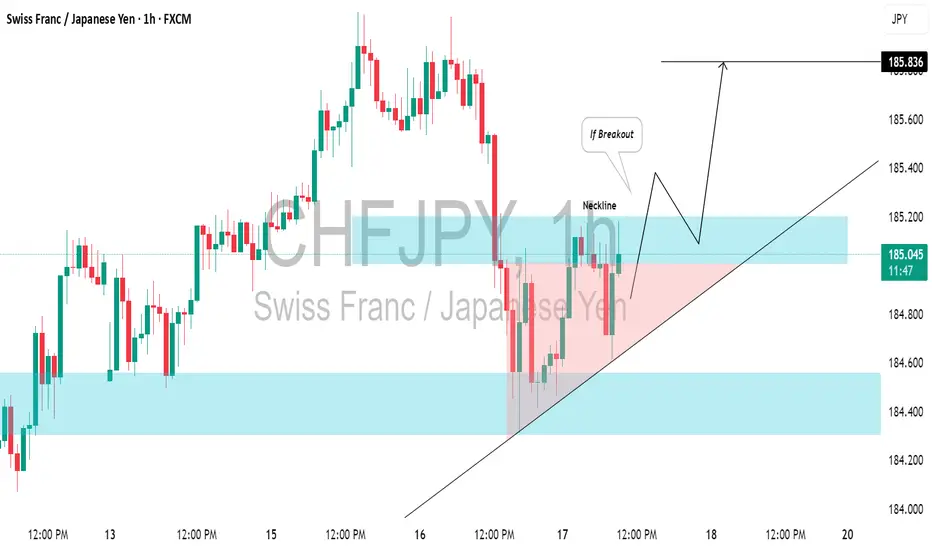
CHFJPY: Your Trading Plan For Today⚠️CHFJPY is currently testing a recently breached key daily/intraday resistance level, which is likely to have become support.
We will look for a confirmation to buy when there is a bullish breakout above the neckline of an ascending triangle pattern on the 1-hour chart.
A close above 185.20 will validate this breakout, and we anticipate a bullish continuation towards at least 185.83.
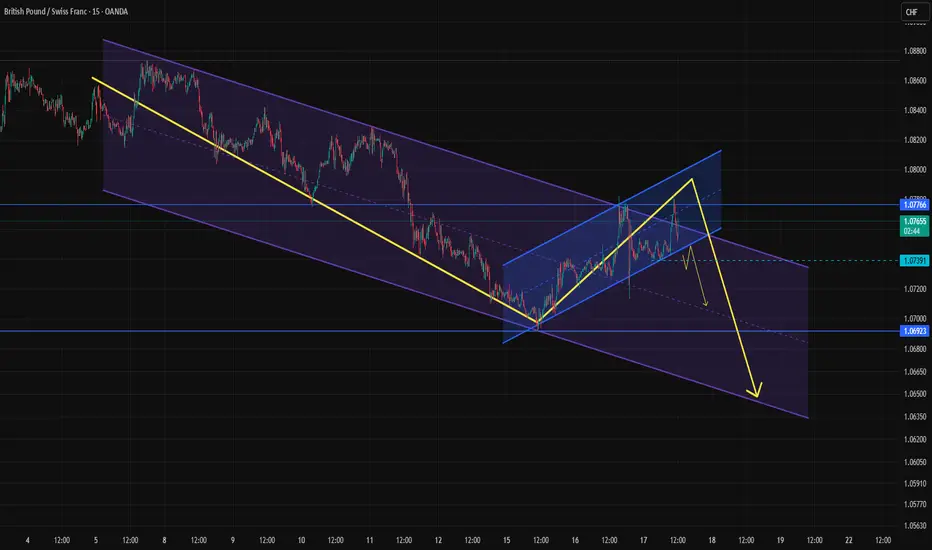
Analysis based on a channel within two cyclesWe have a large descending channel, which appears to be forming a smaller ascending channel as part of a correction.
Once the correction is confirmed and completed, it could provide a good opportunity for a short position.
However, if the lower boundary isn't broken and the price moves higher, we’ll hold off and wait for a new structure to form.
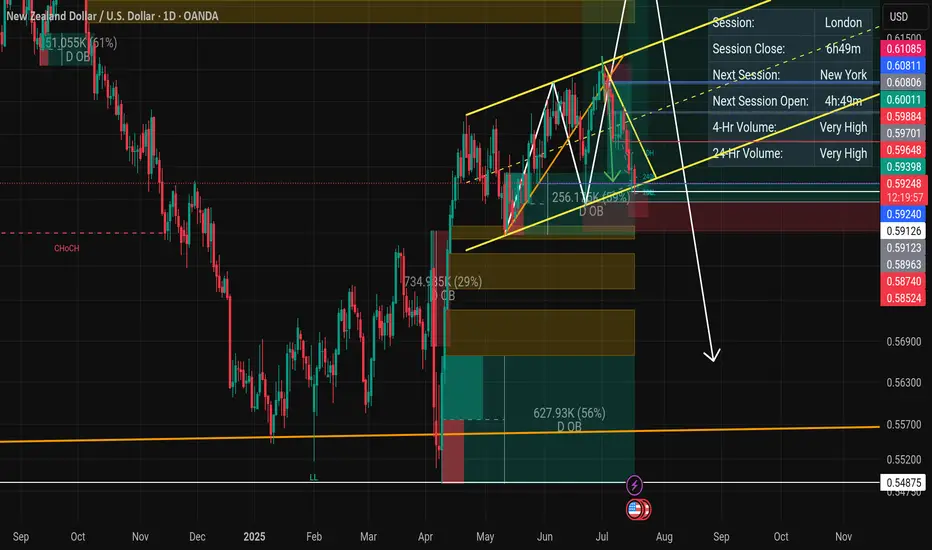
NZDUSDSince March we have been trading NZDUSD inside a chanell and after catching the sells we now look into maximising the buys as well with 0.61775 as our main target before we consider changing biase to bear.
A colure below the channel will invalidate this analysis and will target 0.57646 - 0.55404
BullsHaving in mind that the have been in buys through the year so far. This would be a flag formation and we currently on the daily FVG which provides an entry to continuation in buys.
NB we have a resistance line and that would be iur target before EURUSD starts to dunp massively. Closure below the FVG will result in closure of the buys.