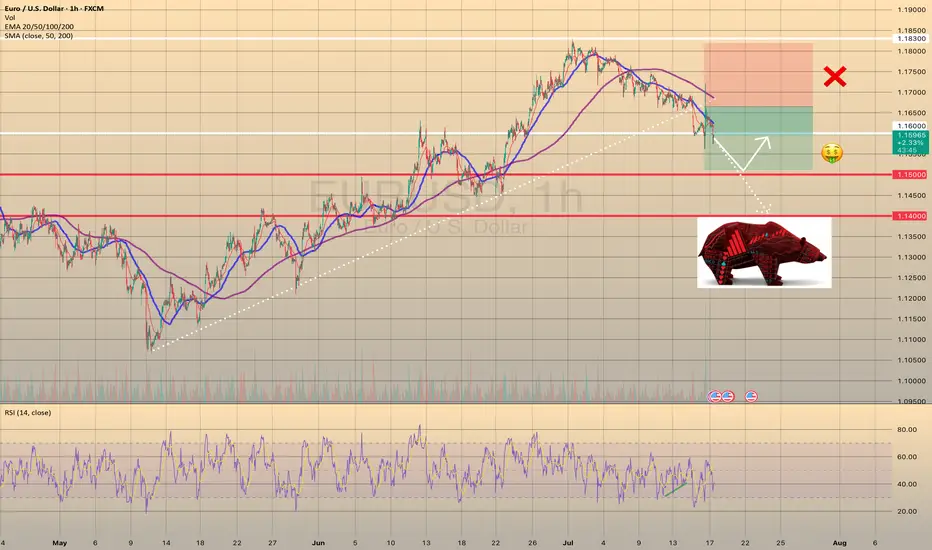
EURUSD - BEARISH TREND CONTINUESEURUSD - BEARISH TREND CONTINUES📉
On Tuesday, despite the bullish divergence (highlighted as green on RSI), the price broke through the trendline, formed since the beginning of May. Yesterday this trendline got retested on Bloomberg's rumor that Powell may resign. Currently the price is going through the support level of 1.16000.
I see the major way is to go towards 1.15000 support level with a further rebound and possible target of 1.16000. Another option is to go straight towards 1.14000. Will see.
Trend Lines
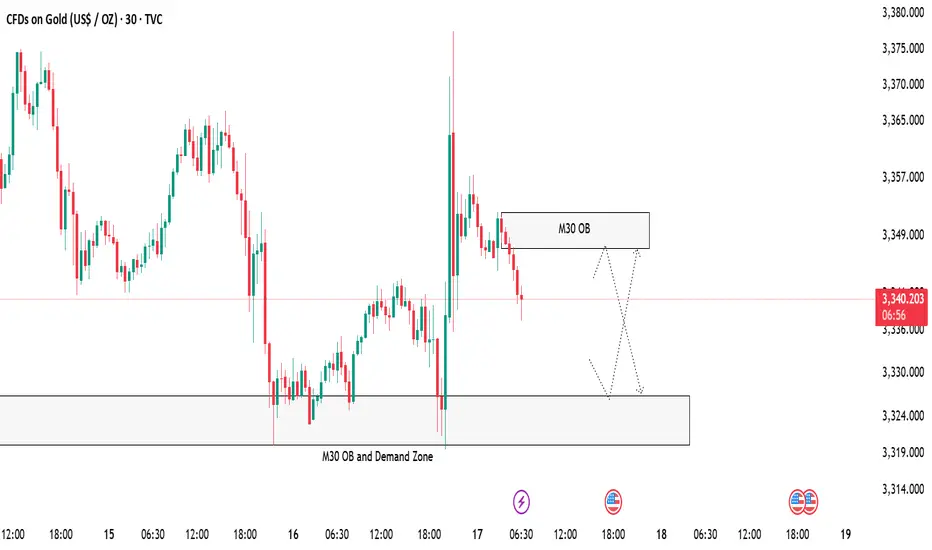
Gold 30-Minute OB and Demand Zone SetupGold is now approaching a 30-Minute Order Block along with a strong demand zone 🟢. We are expecting some clean reactions from these areas.
📌 Plan:
Scenario 1:
👉 If price respects the M30 OB and Demand zone area at 3327 -3320, we can look for bullish signs like rejection wicks or bullish candles to enter buy positions 📈, targeting the upper zone M30 OB zone near 3347 🎯.
Scenario 2:
👉 If price tap the above 30 min OB near 3347 we take our sell or short side entries for a reaction from there entering short ✅.
Both scenarios are possible, so we will watch the price action closely 🧐 and only trade with confirmation!
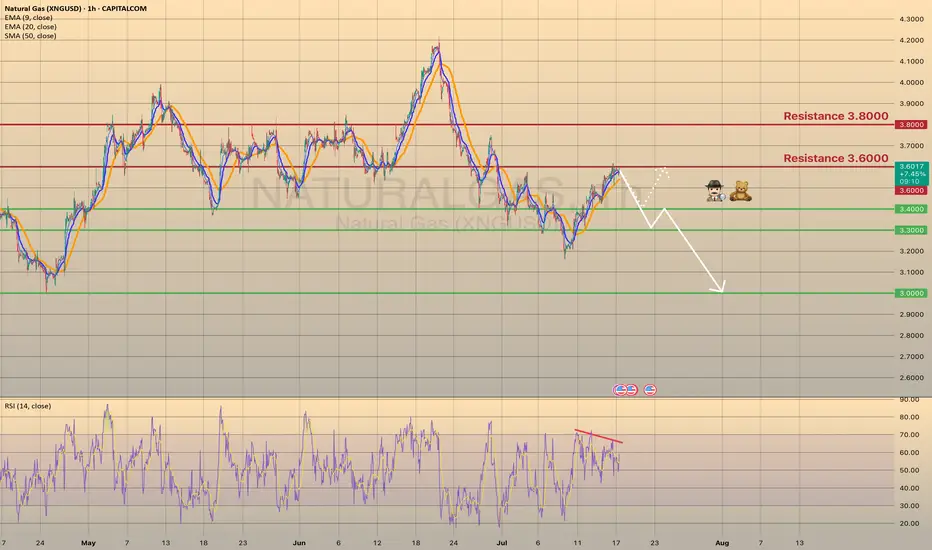
U.S. NATURAL GAS - BEARISH DIVERGENCE DETECTED
U.S. NATURAL GAS - BEARISH DIVERGENCE DETECTED🕵🏻♂️
The Natural gas has been trading bullish for 7 days in a row since last Wednesday, reaching the 3.6000 resistance level. Primarily this happened due to a warm weather in the U.S. states, that supports the demand on gas. Despite warmer-than-normal summer weather, analysts expect energy firms to inject more gas into storage than usual in coming weeks. Record-high output in June, likely to be surpassed in July, and reduced gas flows to LNG export plants since April's peak, support this trend.
Technically chart shows us a bearish divergence on 1-h timeframe. I suppose the price to slowly decline towards major support level of 3.0000 with minor rebounds. The 2nd option is the rebound from 3.4000 support level with a first target of 3.6000.
MarketBreakdown | EURAUD, GBPJPY, WTI CRUDE OIL, SILVER
Here are the updates & outlook for multiple instruments in my watch list.
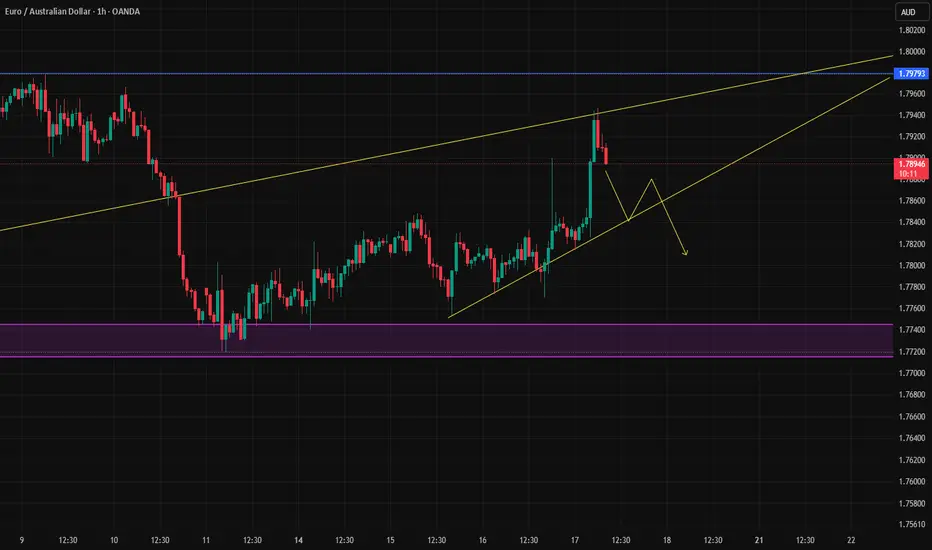
1️⃣ #EURAUD daily time frame 🇪🇺🇦🇺
The market is trading in a bullish trend.
The price is steadily growing within a rising parallel channel.
A recent test of its support triggered a strong bullish reaction.
I think that a rise may continue at least to a current high - 1.8035
2️⃣ #GBPJPY daily time frame 🇬🇧🇯🇵
The market is consolidating within a narrow horizontal
parallel channel.
Consider consolidation, trading within its boundaries.
The next bullish wave will be confirmed with a breakout and a
daily candle close above its resistance.
3️⃣ CRUDE OIL #WTI daily time frame 🛢️
The market remains weak and consolidation continues.
I see a wide horizontal range where the price is now stuck.
I think that we may see a pullback from its support.
4️⃣ #SILVER #XAGUSD daily time frame 🪙
The market is retracing after a formation of a new higher high.
I see a strong demand zone ahead: it is based on a rising trend line
and a recently broken horizontal resistance.
The next trend following movement will most likely initiate from there.
Do you agree with my market breakdown?
❤️Please, support my work with like, thank you!❤️
I am part of Trade Nation's Influencer program and receive a monthly fee for using their TradingView charts in my analysis.

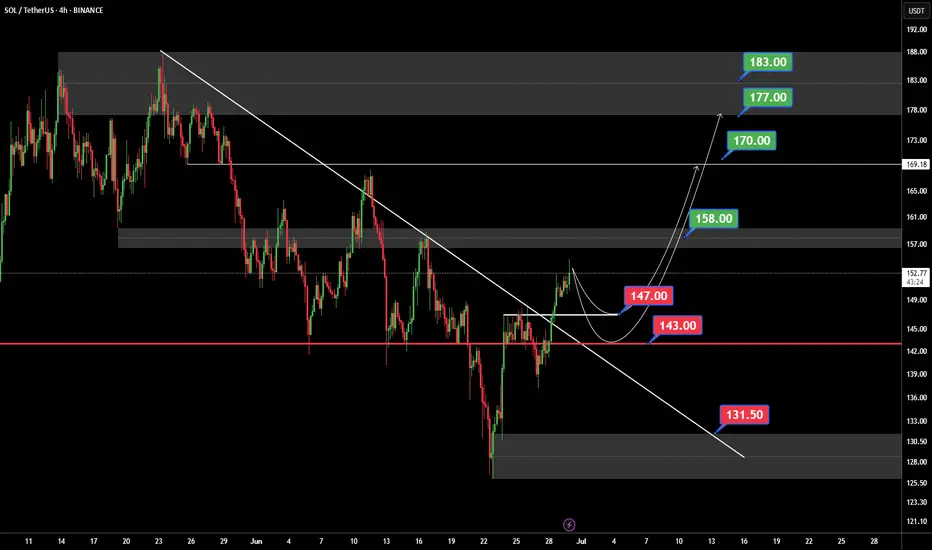
SOLUSDTThis chart BINANCE:SOLUSDT say to me that change of character. But we need to best confirmations for buy for example: pollback to 143 - 147 $ and higher high next pollback to level.
Support: 147 - 143 - 131.50
Resistance: 158 - 170 - 177 - 183
⚠️Please Control Risk Management in trades.
Bitcoin Buy analysis/ideaThis analysis is based on the 4-hour and 1-hour timeframes and executed using Supply and Demand trading and trend formation. Complete explanation in the video!

If confirmed, this could be a strong trigger to enter shortIf the euro is indeed set to weaken — as we anticipate based on the current signs of trend exhaustion — this could be a solid trigger for a short position.
However, if the breakout fails to confirm, it may turn out to be a fakeout, potentially leading to a bullish reversal instead
GBPUSD InsightWelcome to all our subscribers.
Please feel free to share your personal thoughts in the comments.
Don't forget to like and subscribe!
Key Points
- According to CBS and other U.S. media outlets, former President Trump asked Republican lawmakers during a closed-door meeting whether they supported removing Federal Reserve Chair Jerome Powell. It was reported that many lawmakers showed support for the idea. However, in a meeting with the Prime Minister of Bahrain, Trump stated that unless Powell is involved in a scandal related to renovations of the Federal Reserve building, the likelihood of his dismissal is very low.
- President Trump is actively lobbying lawmakers to pass three stalled cryptocurrency bills in the House of Representatives. Optimism about the bills' passage has resurfaced. In particular, the potential strategic use of stablecoins to strengthen the dominance of the U.S. dollar and boost demand for U.S. Treasuries has brought renewed attention to these legislative efforts.
- The U.K.’s Consumer Price Index (CPI) for June came in at 3.6%, exceeding the market expectation of 3.4%. As a result, the possibility of a Bank of England rate cut in July has significantly diminished.
Key Economic Schedule This Week
+ July 17: Eurozone June Consumer Price Index (CPI)
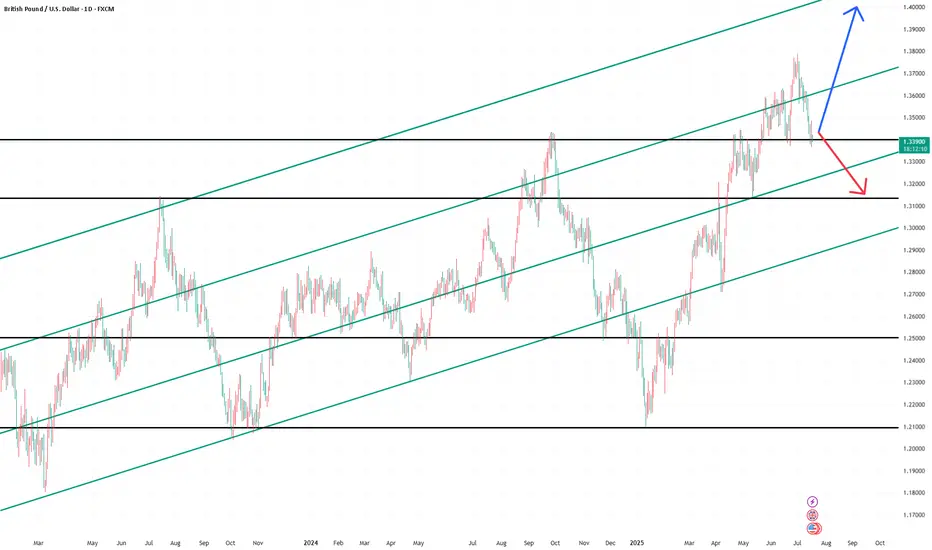
GBPUSD Chart Analysis
The GBPUSD pair failed to break above the 1.38000 level and fell through the trendline after facing resistance in that zone. Currently, it is testing support near the 1.34000 level. If the pair successfully rebounds from this area, we could expect another potential rally toward the 1.40000 level. However, if the support is broken, a further decline toward the 1.31500–1.32000 range is likely.
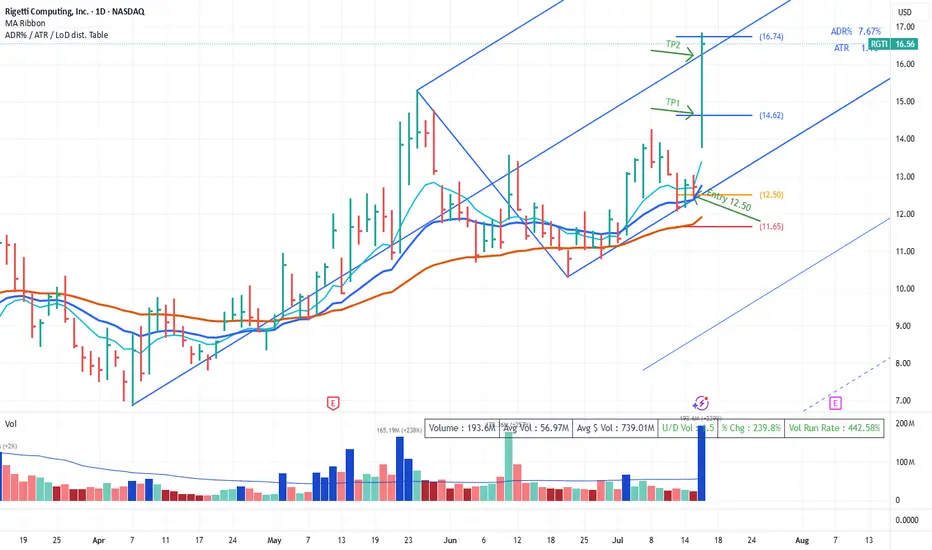
Median Line Trade RGTIPrice tests the LMH and rejects it. Look for a long at the retest. We get set at 12.50.
TP1 is logical at 2.5R and just before the prior top in case we fail to follow through
TP2 is at the median line. As Dr Andrews says "Price makes it to the Median Line 80% of the time".
Ok 'we got lucky' on some news for such a quick set of T/P's. Price definitely moved quicker than expected. However it wasn't luck that put us in the position.
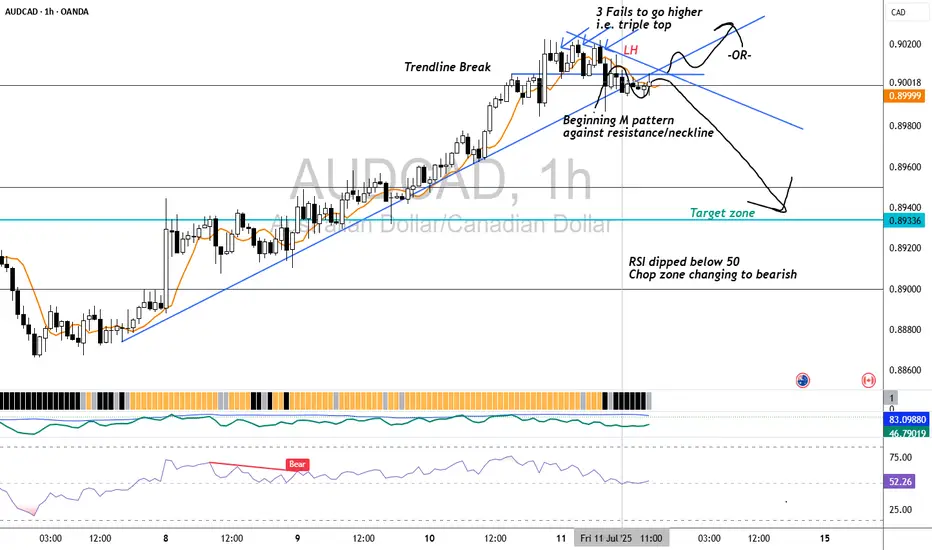
AUDCAD H1 BearishFactors of confluence in favor of short
1. Daily resistance zone 0.90432
2. Triple top
3. M pattern against resistance
4. RSI dipped below 50
5. Chop Zone change to bearish
6. Break of trendline
7. 3.5 R/R
8. Removal of liquidity zone on daily chart(prior high)
Risks
1. No LL yet
2. 2nd time back to daily resistance zone- may break through to upside
3. Price to return to congestion zone above for more consolidation before choosing a direction
4. Possibility to resume upwards momentum
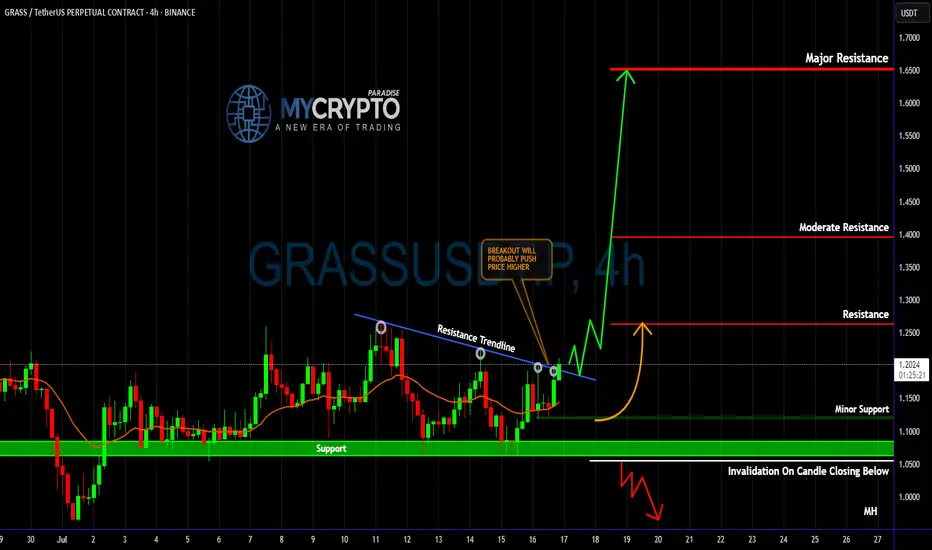
GRASS About to EXPLODE or COLLAPSE? Traders Could Get Trapped inYello, Paradisers! Are you ready for what could be one of the most deceptive breakouts we’ve seen this week? #GRASSUSDT is showing signs of strength, but as always, we need to stay sharp and look beneath the surface to avoid getting trapped like 90% of the herd.
💎#GRASS is knocking on the door of a key descending resistance trendline that has been respected multiple times this month. The current price action is attempting to break above it with momentum, and a confirmed breakout could trigger a strong probable impulsive move toward the next resistance levels at $1.2630, $1.3959, and eventually even $1.6512.
💎But what gives this setup its real probability strength is what most retail traders are overlooking: the confluence between minor support at $1.10–$1.15 and the short-term EMAs on the 4H timeframe. The 50 EMA and 100 EMA are starting to curve upward and align just above this support range, offering a strong dynamic base. This zone isn’t just visual support anymore—it’s turning into a technical launchpad.
💎From a technical standpoint, any clean 4H candle close above the trendline and $1.2630 resistance will increase the probability of continuation toward the mid-range resistance near $1.3959. However, failure to break above this zone convincingly or a rejection back into the previous range could signal that market makers are just pushing price up to trap breakout traders before dumping it again.
💎Support remains firm in the $1.10–$1.15 zone, but invalidation is crystal clear — any 4H candle close below $1.0549 would negate this bullish outlook entirely and suggest a deeper move is coming. That level has held well so far, but remember: one quick breakdown can wipe out many weak hands.
💎This is exactly the kind of setup that separates emotional traders from strategic ones. Many will FOMO in right at the breakout without considering the higher timeframes or waiting for confirmation.
Strive for consistency, not quick profits, Paradisers. Treat the market as a businessman, not as a gambler. Only the patient and prepared will survive and profit from these types of traps. Let’s continue to stay smart, strategic, and wait for the best high-probability opportunities.
MyCryptoParadise
iFeel the success🌴
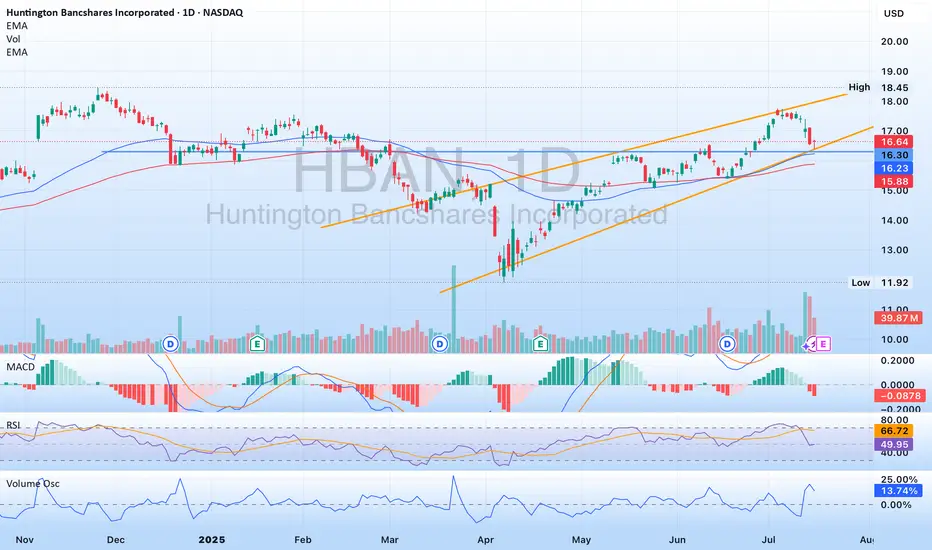
$HBAN - well positioned to continue on its pathNASDAQ:HBAN has been in a rising channel since April, and is no touching the lower band of the channel. His area also includes some previous resistance turned support, as well as some movement paces. NASDAQ:HBAN recently announced they are acquiring Veritex ( NASDAQ:VBTX ) which will strengthen their mark in Texas. Please note NASDAQ:HBAN is releasing earnings July 18th. A good report should see the stock moving towards the upper band of the channel, maybe break through it.
Fake news stirs up the market, market trend analysis📰 News information:
1. Beige Book of Federal Reserve's economic situation
2. European and American tariff trade negotiations
📈 Technical Analysis:
Today, our overall trading can be said to have accurately grasped the trading points, and both long and short positions have earned us good profits.The gold market surged due to Trump's intention to fire Powell. Trump then denied the plan, which dissipated the risk aversion in the gold market and the overall rhythm fell back to a volatile pattern. The current market price of gold closed with a long upper shadow line, indicating that there is a certain need for adjustment in the market. Although the news stimulus has pushed it up to 3377, we need to be vigilant against the risk of a decline after a high rise. Pay attention to today's closing. If it closes below 3345, the bearish trend may continue in the future.
OANDA:XAUUSD PEPPERSTONE:XAUUSD FOREXCOM:XAUUSD FX:XAUUSD OANDA:XAUUSD FXOPEN:XAUUSD
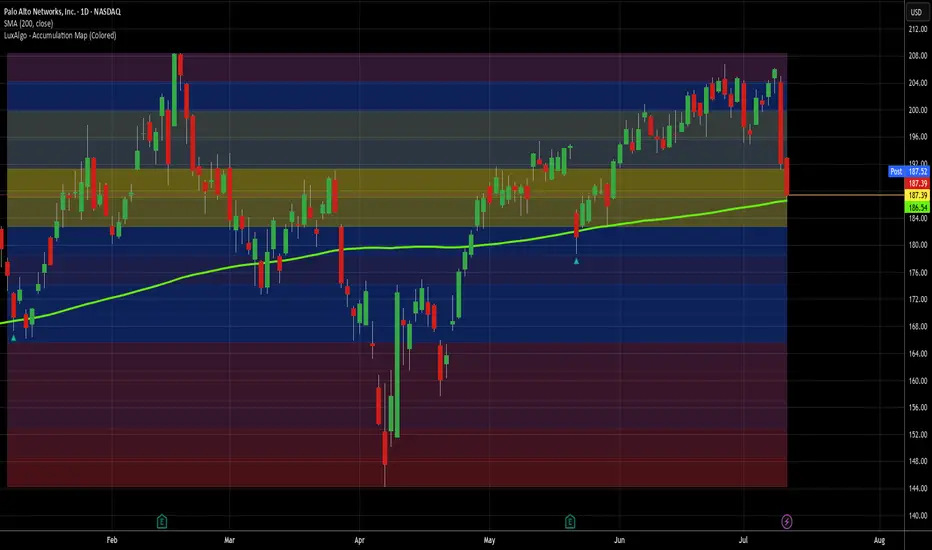
Taking another trip to Palo Alto for a quick flip If you want all the details on why I'm taking this trade, refer back to my Palo Alto ideas from Jan 8th and May 21st of this year. The only thing that has changed since May is 4 more profitable trades on PANW, so it's now 25-0. The longest of those 4 has taken 4 days and the average return on them has been 2.16%. So I'm going to Palo Alto again.
The entire cybersecurity sector took it on the chin yesterday, with NET, CRWD, ZS and others all down big and it continued today for them. I know PANW the best, so that's why I'm choosing it, but I think any of them could do well here. PANW is right on its 200d MA and has been above it for the better part of the last 3 years. Even if this trade takes longer than expected to produce, PANW and cybersecurity are not going anywhere. If I had to hold this one for years, I'd be happy to. Well, not "HAPPY" happy, but you get the point.
My exit is signal-based rather than price level based, but I'm targeting under a week for a return of 1-3% on average. Let's hope PANW keeps its record intact and makes this my best trade of the day.
As always - this is intended as "edutainment" and my perspective on what I am or would be doing, not a recommendation for you to buy or sell. Act accordingly and invest at your own risk. DYOR and only make investments that make good financial sense for you in your current situation.
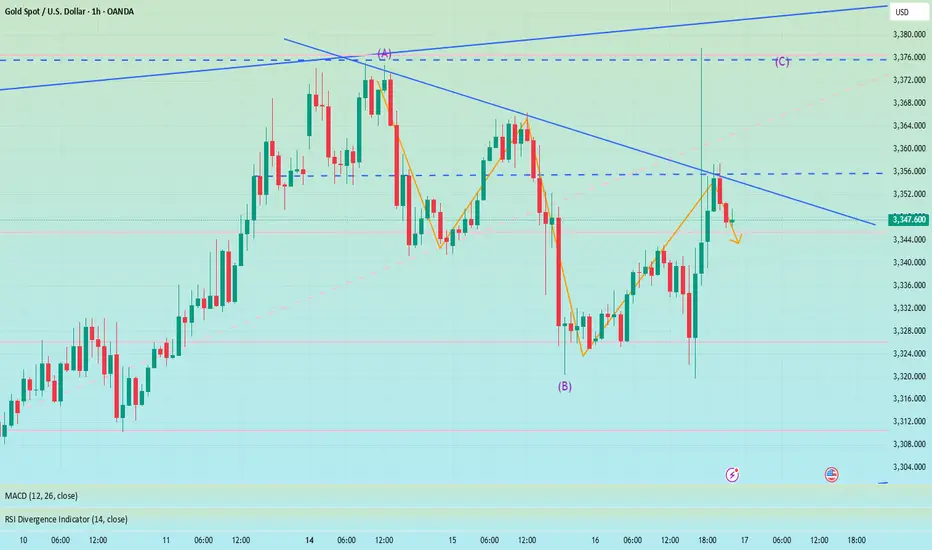
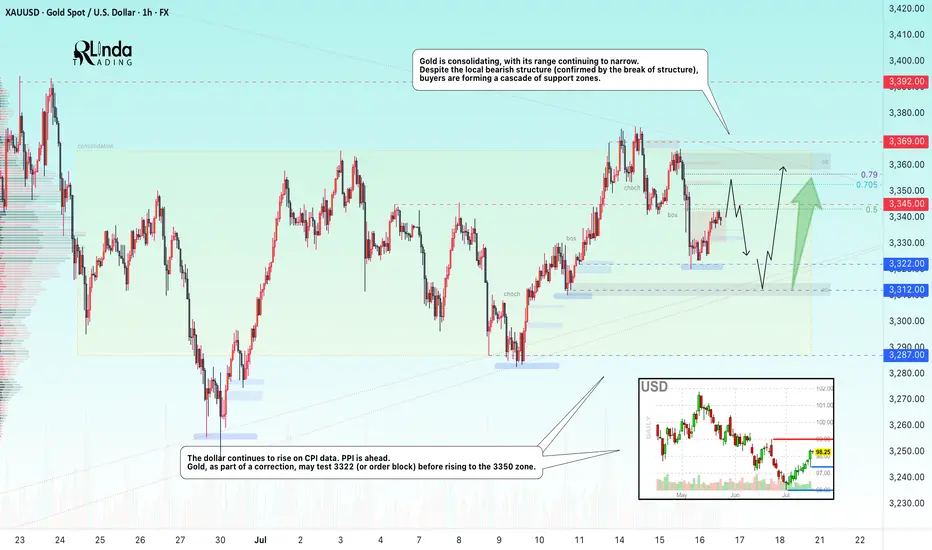
GOLD → Borders are shrinking. Consolidation continues...FX:XAUUSD is adjusting amid controversial CPI data and confirming the local bearish market structure. The PPI is ahead, and gold is consolidating, with its boundaries continuing to narrow...
Gold is recovering slightly but remains under pressure amid rising bond yields and a stronger US dollar. Higher inflation in the US reduces the chances of a quick Fed rate cut. Traders are cautious ahead of the PPI data release. If producer inflation exceeds forecasts, the dollar may rise again, putting further pressure on gold
Technically, we see consolidation in a symmetrical triangle pattern. Trading within the consolidation has a negative side - low volatility and unpredictable movements. The purpose of such movements is accumulation. However, decisions can be made based on relatively strong levels. In the current situation, we are seeing a rebound from 0.5 Fibonacci (I do not rule out a retest of the 0.7 zone before correction). The price may head towards the liquidity zone of 3322 before rising to the upper boundary of the consolidation and the zone of interest of 3350-3360.
Resistance levels: 3345, 3353, 3369
Support levels: 3322, 3312, 3287
The problem is that the price is in a consolidation phase. That is, technically, it is standing still and moving between local levels. You can trade relative to the indicated levels. Focus on PPI data. At the moment, gold is in the middle of a triangle and is likely to continue trading within the boundaries of a narrowing channel due to uncertainty...
Best regards, R. Linda!
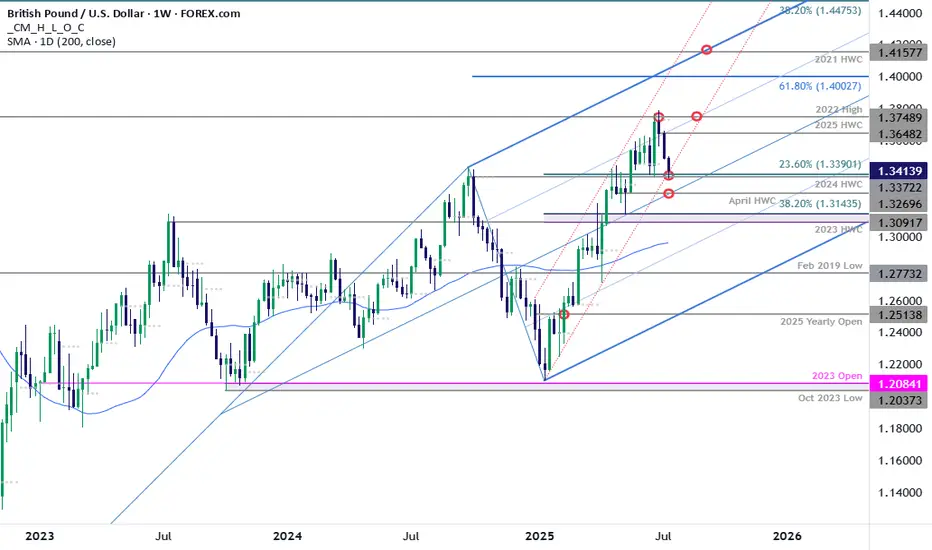
GBP/USD Plunges to Make-or-Break SupportSterling is poised to mark a third consecutive weekly decline after turning from resistance at multi-year highs. The decline takes price into critical support at the yearly trendline- this is a make-or-break level for the bulls.
GBP/USD is testing confluent support today at 1.3372/90- a region defined by the 2024 high-week close (HWC) and the 23.6% retracement of the yearly range. Looking for a reaction off this mark with a weekly close below the April HWC / median-line at 1.3270 ultimately needed to suggest a more significant high is in place / invalidate the yearly uptrend. Subsequent support rests with the 2023 HWC / 38.2% retracement at 1.3091-1.3143 and the 52-week moving average, currently near ~1.2980.
Weekly resistance now eyed at the yearly high-week reversal close at 1.3648 with a breach / close above the 2022 high at 1.3749 still needed to mark resumption of the broader Sterling up trend. Subsequent resistance objectives eyed at the 61.8% extension of the 2022 advance at 1.4003 and the 2021 HWC at 1.4158.
Bottom line: Sterling is attempting to break below the yearly uptrend and the focus is on the weekly close with respect to 1.3372/90- risk for price inflection here. From a trading standpoint, a good zone to reduce portions of short-exposure / lower protective stops- rallies should be limited to 1.3648 IF price is heading lower on this stretch with a close below 1.3270 needed to suggest a reversal is underway.
-MB
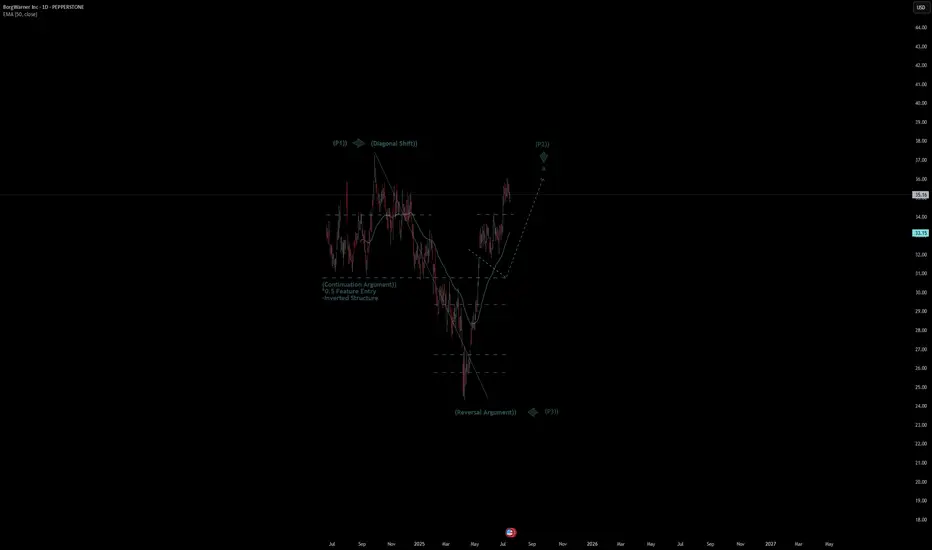
BorgWarner Inc Quote | Chart & Forecast SummaryKey Indicators On Trade Set Up In General
1. Push Set Up
2. Range Set Up
3. Break & Retest Set Up
Notes On Session
# BorgWarner Inc Quote
- Double Formation
* (Diagonal Shift)) At 38.00 USD | Completed Survey
* 0.5 Feature Entry | Subdivision 1
- Triple Formation
* (P1)) / (P2)) & (P3)) | Subdivision 2
* (TP1) = a / Long Consecutive Range | Subdivision 3
* Daily Time Frame | Trend Settings Condition
- (Hypothesis On Entry Bias)) | Regular Settings
- Position On A 1.5RR
* Stop Loss At 32.00 USD
* Entry At 35.00 USD
* Take Profit At 39.00 USD
* (Uptrend Argument)) & No Pattern Confirmation
- Continuation Pattern | Not Valid
- Reversal Pattern | Not Valid
* Ongoing Entry & (Neutral Area))
Active Sessions On Relevant Range & Elemented Probabilities;
European-Session(Upwards) - East Coast-Session(Downwards) - Asian-Session(Ranging)
Conclusion | Trade Plan Execution & Risk Management On Demand;
Overall Consensus | Buy
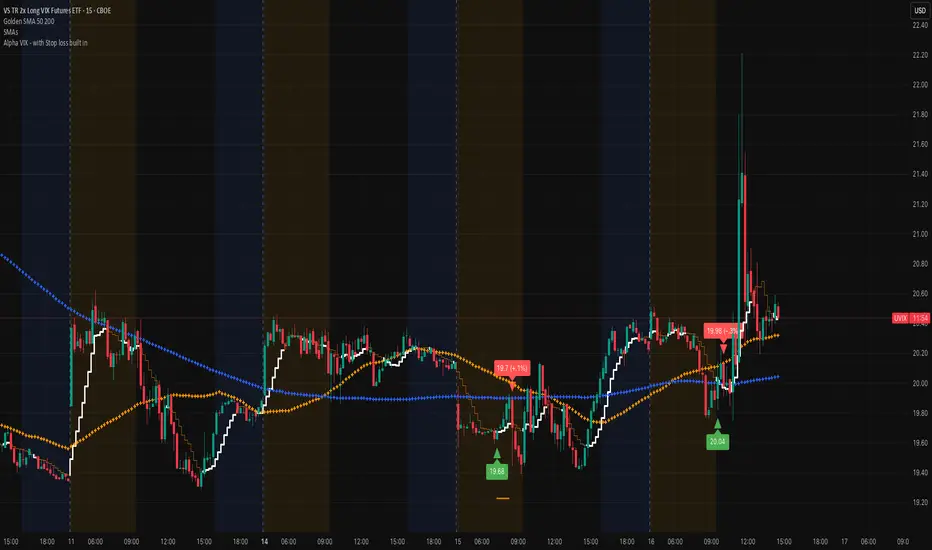
UVIX marching on (VIX proxy)Very nice spike this morning, that's typically a sign that there's more volatility in the works. Remember that we are at record lows on the VIX and that doesn't stay in this region for a long time. Add the Alpha VIX indicator to help you get an entry. The economy is brittle and staying focused on the VIX is a very nice play!
Best of luck and DM if you have any questions.....
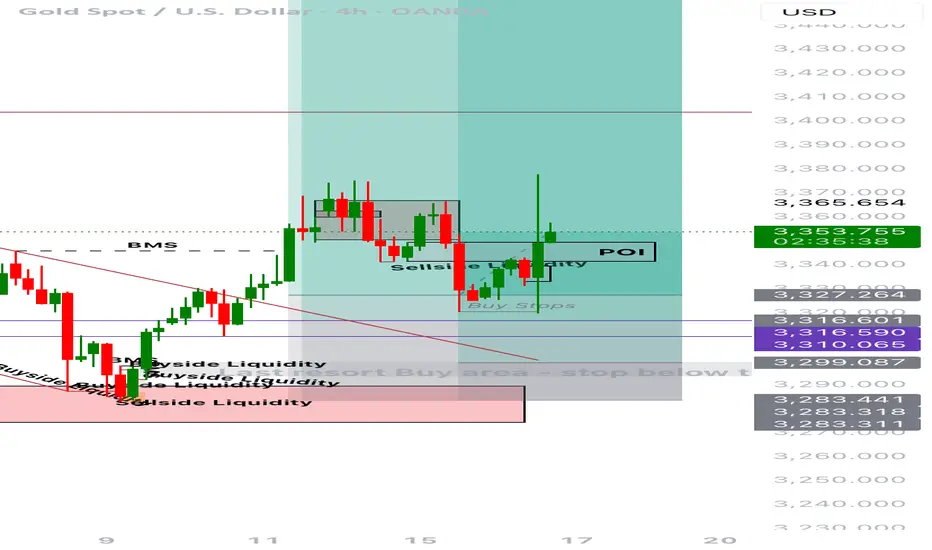
Potential buys?Trade Journal Entry – XAUUSD (Gold Spot)
Date: July 16, 2025
Platform: TradingView (Demo Account)
Timeframe: 4H
Direction: Long
Status: Active, In Profit
Unrealized Profit: +301.54 GBP
Entry: ~3,327
Stop Loss: Below 3,316 zone
Take Profit (TP): ~3,492
Risk:Reward Estimate: ~1:4 or better
Market Context
Previous pullback into the sell-side liquidity and POI zone held firmly.
Price rejected from POI and aggressively moved upward, confirming bullish order flow.
POI (Point of Interest) is marked intentionally — awaiting a return to the zone after price closes above the wick.
A full buy confirmation is expected only upon a bullish close above the wick, followed by a retest into the POI.
Trade Logic
Trade was initiated based on:
- Break of market structure (BMS)
- Sweep of sell-side liquidity
- Bullish intent shown via momentum candles
- Expectation: price returns to POI after wick close for full confirmation
Management Plan
- Consider partial TP at 3,365–3,375 zone.
- Trail SL below latest higher low on lower TF.
- Wait for price to revisit POI after close above wick before scaling in full size.
Emotional Reflection
Feeling composed. The trade plan is well-structured with a POI-based confirmation strategy. No rush to fully size until POI is respected post-wick close.
Reflection Questions
- Did I stick to my POI confirmation logic?
- Am I patient enough to wait for a close above the wick?
- Is my entry risk properly managed while awaiting confirmation?
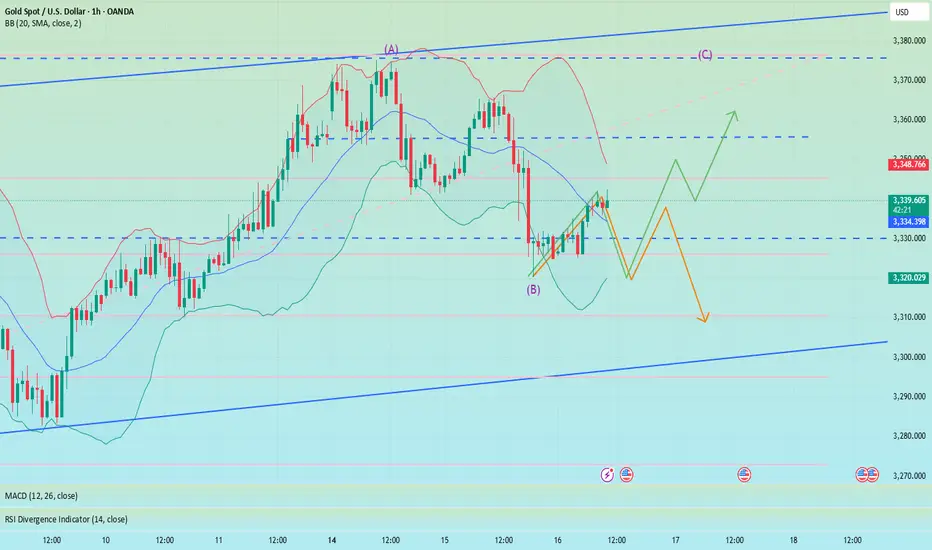
Falling correction, shorting in European session📰 News information:
1. Beige Book of Federal Reserve's economic situation
2. European and American tariff trade negotiations
📈 Technical Analysis:
Currently, gold continues to consolidate around 3340, and the daily MACD indicator is stuck to the zero axis. Two consecutive days of negative bars also indicate that the overall trend of gold is weak and volatile. The hourly Bollinger Bands are closing, with the upper band located near 3352. The corresponding positions of the upper pressure middle band and SMA60 are basically at 3335-3350, but it is expected to gradually decline over time. On the whole, there are no particularly clear trading signals at present. Both bulls and bears have certain opportunities. It is recommended to wait and see for the time being. Pay attention to the 3342-3352 area above. If the bearish trend is confirmed in the future, you can consider shorting when it rebounds here, with the target at 3330-3325. If gold retreats directly to 3325-3320 and gains effective support again, you can consider going long.
🎯 Trading Points:
SELL 3342-3352
TP 3330-3325
BUY 3325-3320
TP 3340-3350
In addition to investment, life also includes poetry, distant places, and Allen. Facing the market is actually facing yourself, correcting your shortcomings, facing your mistakes, and exercising strict self-discipline. I share free trading strategies and analysis ideas every day for reference by brothers. I hope my analysis can help you.
FXOPEN:XAUUSD TVC:GOLD FX:XAUUSD FOREXCOM:XAUUSD PEPPERSTONE:XAUUSD OANDA:XAUUSD
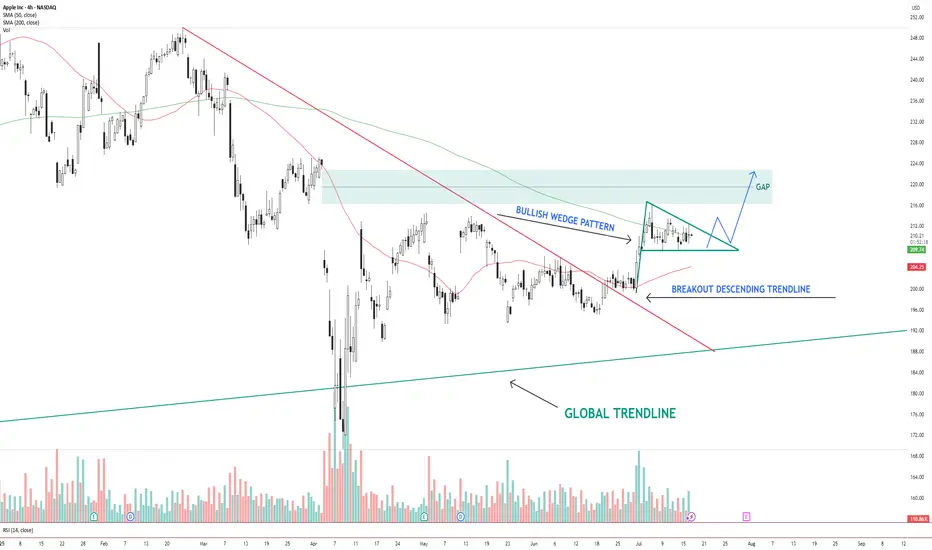
AAPL – Bullish Wedge Breakout Setup Toward Gap FillAAPL NASDAQ:AAPL has broken out of a descending trendline and is now consolidating inside a bullish wedge pattern . Price is holding above the 200 SMA and hovering near the 50 SMA.
The structure suggests a potential breakout above the wedge, with a clear gap area between $216–$224 acting as the next upside target.
Key levels:
Support: $206 (wedge base / 50 SMA)
Resistance: $216–$224 (gap zone)
Trend structure: Bullish consolidation after breakout
A clean breakout from the wedge with volume could trigger a continuation move toward the gap zone.
📌 Watching for confirmation and potential entry on a breakout + retest.
This is not financial advice. Always do your own research.
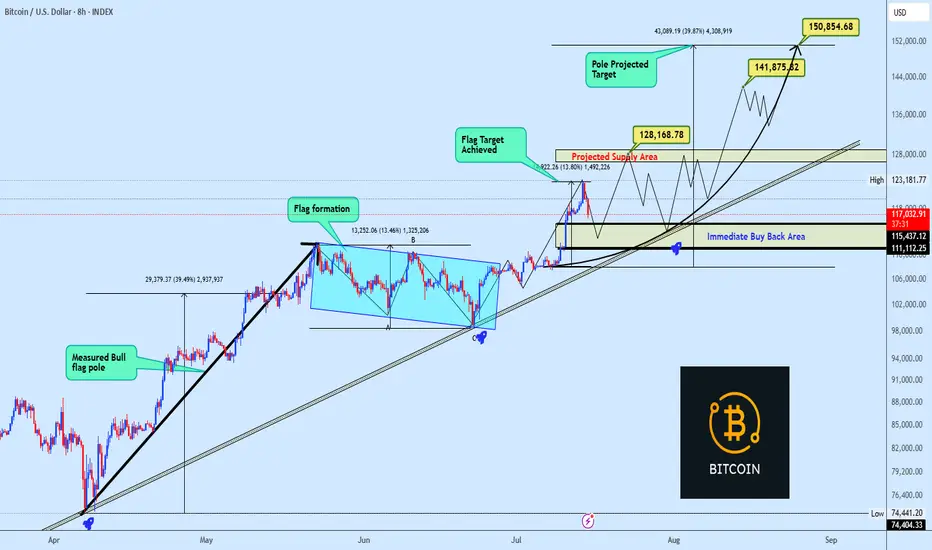
BTC Bull Flag Target Hit Is $150K Now on the Table?Bitcoin continues to deliver with precision. If you’ve been following the structure, this breakout is no surprise. We had a textbook bullish flag setup earlier in the cycle clean pole, sideways consolidation, and a sharp breakout. That initial flag target has now been achieved.
But here’s where it gets interesting: price didn’t just hit the flag projection it shows a good potential for a test towards the projected supply zone just beneath $128K. A short-term rejection here is completely normal and even healthy. The current pullback appears corrective, and the $115K–$111K region (our immediate buy-back zone) remains a critical area to watch for a potential base.
The structure so far has respected its levels cleanly. The pole projection landed almost perfectly, which builds confidence in how this setup is unfolding. A retest of the demand block offers a decent long opportunity, especially with trendline confluence and horizontal support lining up in that zone.
If BTC continues to respect the broader trend and finds strength off this pullback, the path toward $128k, $141K and even $150K remains valid. Those targets are measured extensions based on the original flag pole, and given how price is behaving, they’re not unrealistic.
Momentum is strong, but rallies like this often pause before the next move. I’ll be watching how price behaves if it dips into the demand zone. Clean volume and rejection candles there could offer solid re-entry setups for the next leg higher.
Are you riding this wave, trimming profits, or waiting for the dip reload? Drop your thoughts below. Let’s see how everyone’s navigating this phase.
📌 Follow for more clean, structured setups no hype, just charts.
Hidden Support on RIG: Next Big Move?🔹 Trade Summary
Setup:
Price pulling back to ascending trendline support
Testing major support near $2.58
Analyst 1-year target: $3.76
Entry:
Above today's high of $2.64 (on confirmation of bounce from trendline)
Stop-loss:
Below $2.40 (clear break of trendline)
Targets:
$3.76 (analyst price target / major resistance)
Risk/Reward:
Approx. 1:4 (risking ~$0.25 for ~$1.10 gain)
🔹 Technical Rationale
🔹 Ascending trendline holding as key support since April
🔹 Oversold bounce potential at this zone
🔹 Daily timeframe shows structure for a trend reversal if support holds
🔹 Catalysts & Context
🏦 Strong analyst “Buy” rating; 1-year target at $3.76 (+45%)
🛢️ Oil sector volatility—any rally could boost offshore drillers
🌍 Macro: Global energy demand headlines could trigger momentum
🔹 Trade Management Plan
Entry: Wait for daily close above $2.65 to confirm support
Stop-loss: Move to breakeven if price closes above $3.00
Scaling: Trim partial at $3.20, rest at $3.76 (analyst target)
What’s your view? Are you watching NYSE:RIG ? Comment below:
🔼 Bullish
🔽 Bearish
🔄 Waiting for confirmation
🔹 Disclaimer
Not financial advice. Trade at your own risk.
*** Don't forget to follow us for more trade setups ***
