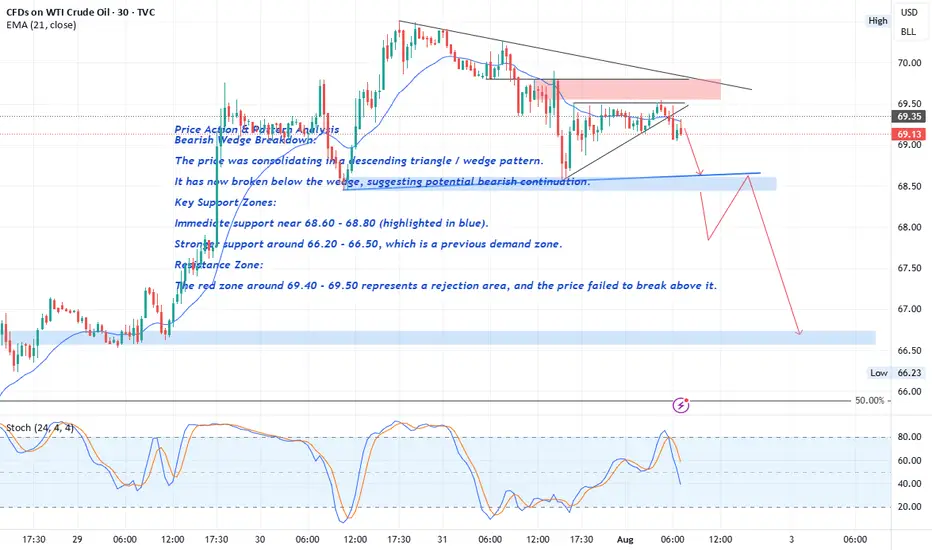
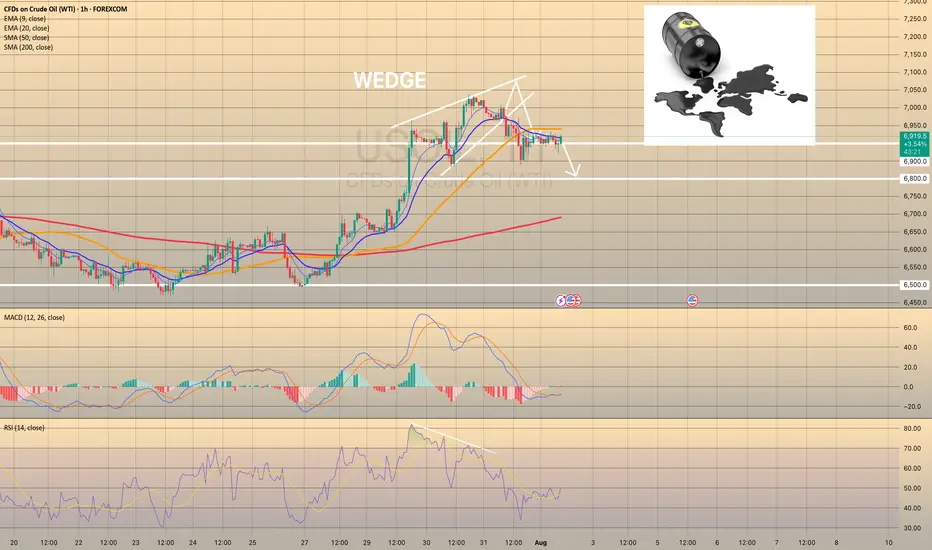
Crude Oil Price Action & Pattern Analysis
Bearish Wedge Breakdown:
The price was consolidating in a descending triangle / wedge pattern.
It has now broken below the wedge, suggesting potential bearish continuation.
Key Support Zones:
Immediate support near 68.60 - 68.80 (highlighted in blue).
FOREXCOM:USOIL
The break of the 68.60 level with a strong bearish candle would serve as confirmation of a Head and Shoulders (H&S) pattern , with solid bearish implications.
Stronger support around 66.20 - 66.50 , which is a previous demand zone.
Resistance Zone:
The red zone around 69.40 - 69.50 represents a rejection area , and the price failed to break above it.
Trend Lines
The next levels for Solana coinIn this video I recap the previous video and discuss what may be next after the current retracement .
I reveal some important levels that sit below as well as the relationship with the Eth/Btc chart.
Tools used vwap, Fibs and volume profile .

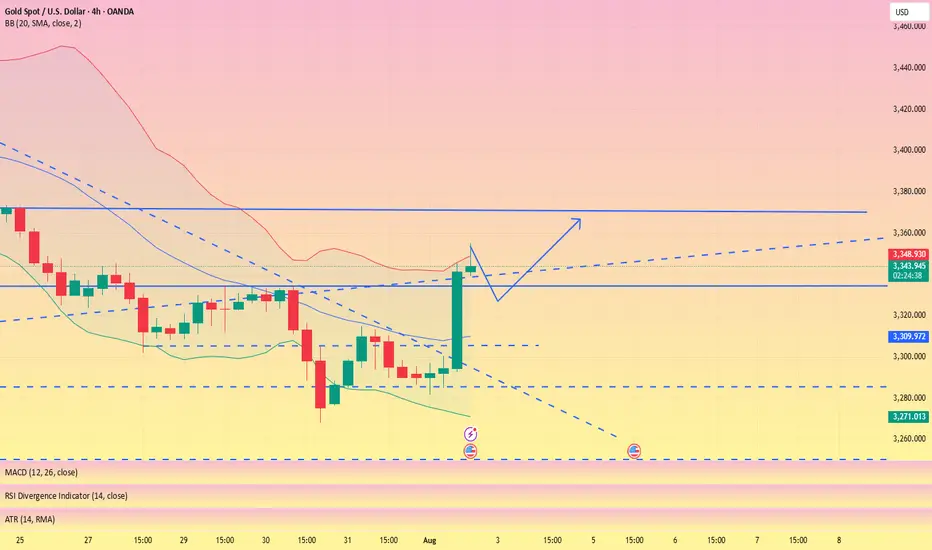
NFP data is positive, the bullish trend remains unchanged#XAUUSD
The current market, influenced by data such as NFP, remains bullish, even briefly pushing towards the 4H upper limit of 3350, reaching a high near 3354.📈
In the short term, gold still has upward momentum and could even reach the previous high resistance level near 3375.🐂
Currently, gold is undergoing a technical correction and needs to begin a pullback to accumulate more bullish momentum, giving traders who previously missed the opportunity to get on board.🚀
As resistance continues to rise, support below will also rise. 📊If gold retreats below 3335-3315, consider going long.📈
🚀 SELL 3335-3315
🚀 TP 3350-3375
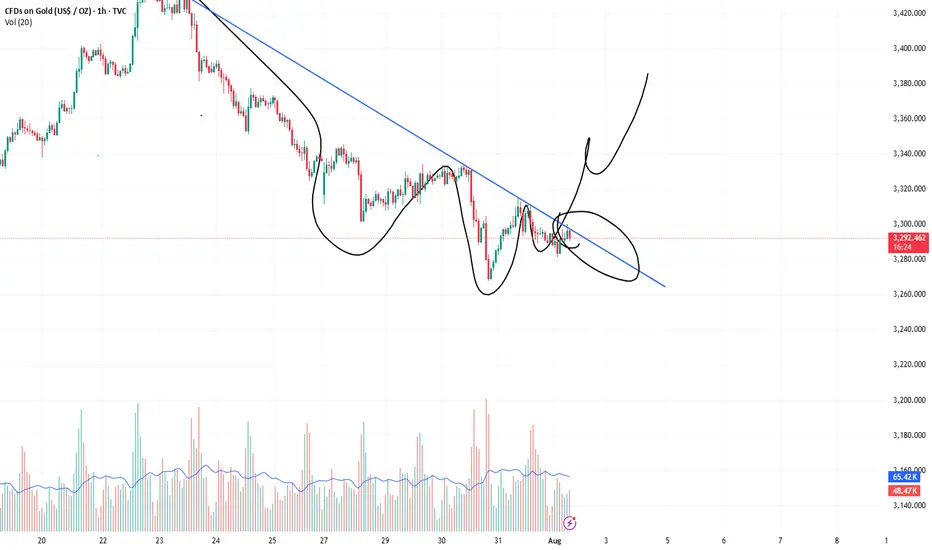
XAUUSD ultra-short-term sell trade.The hourly chart still shows a downward trend. Short-term downward pressure will continue. If you want to trade in the London market, consider selling at high levels and pursuing short-term trend trading.
3300-3295 SELL
TP3285-3280
ETHUSD BROKE THE LOWER BORDER OF THE WEDGE. PRICE IS MOVING TOWAETHUSD BROKE THE LOWER BORDER OF THE WEDGE. PRICE IS MOVING TOWARDS THE LOCAL SUPPORT.
Yesterday, Ethereum saw its largest monthly increase since July 2022, thanks to strong inflows into exchange-traded funds and increased activity in the Ethereum treasury. US exchanges are working to obtain regulatory approval for a standardized framework for listing crypto funds. Coinbase and JPMorgan have joined forces to provide Chase customers with access to crypto products.
Despite these positive developments, the short-term outlook does not indicate a bullish setup. It appears that all the information has already been factored into the price. The pair moves towards the local support of 3,500.00. However, in the long term, these developments are favorable for investment.

USOIL REACHED THE 6,900.00 SUPPORT LEVEL. WHAT'S NEXT?USOIL REACHED THE 6,900.00 SUPPORT LEVEL. WHAT'S NEXT?
As we told July 31, the price got reversed towards first support level of 6,900.00. Market participants are waiting for the OPEC+ meeting this week, expecting a significant output hike. Currently, the price sits slightly above the support level. Although, the asset trades above this level, considering the current weakness of the asset, further decline is expected. The 6,800.00 support level is the next target here.
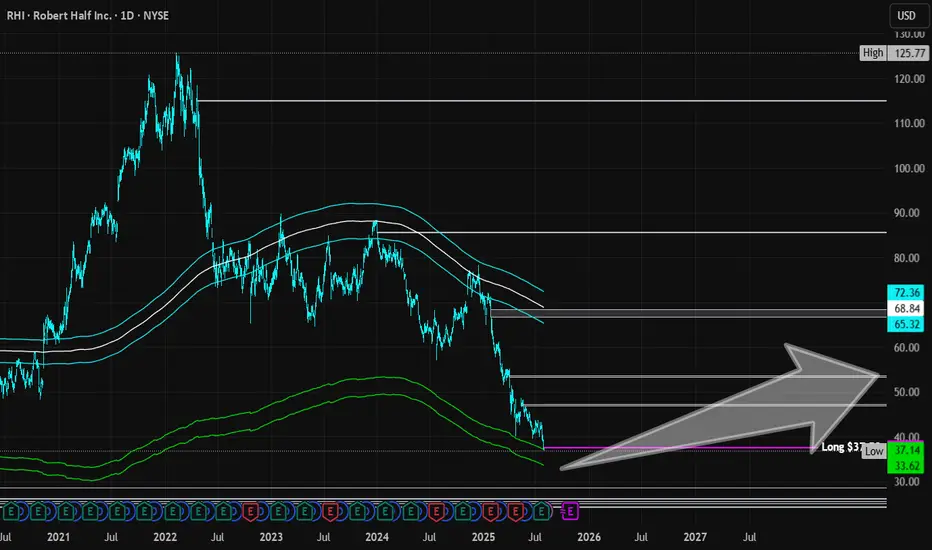
Robert Half | RHI | Long at $37.58Robert Half NYSE:RHI is a company that provides talent solutions and business consulting services in the US and internationally. It's a cyclical stock. Currently, the price has entered my "crash" simple moving average zone ($37-$33) and has historical bounced from this area. This doesn't mean the "major crash" area won't be reached ($26-$21 or below), but the company has been around since 1948 and survived many hurdles along the way.
Earnings are forecast to grow 8% annually and it has a 6.3% dividend. P/E = 21x and financially healthy (low debt-to-equity: .2x, low bankruptcy risk/Altmans Z Score: 5; and enough cash to pay current bills/quick ratio: 1.6).
Regardless of bottom predictions, I think there is a high chance the stock may reach $33 before a slight bounce. If the market flips for a bit, that "major crash" area ($20s) may be hit.
So, a starter position for NYSE:RHI has been created at $37.58 with additional entries near $33 and $25-$26.
Targets into 2028:
$46.00 (+22.4%)
$53.00 (+41.0%)
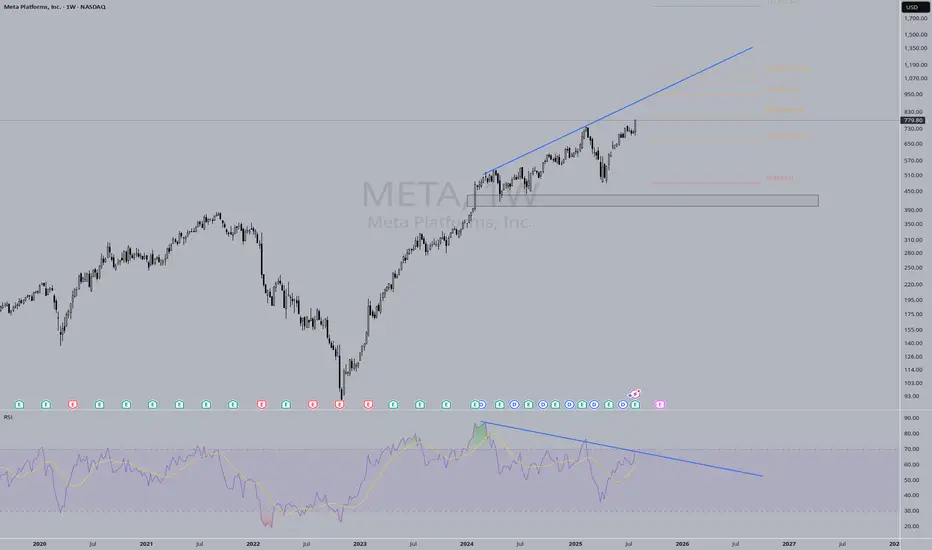
META Bearish RSI Divergence?RSI bearish divergence occurs when price makes a higher high, but the Relative Strength Index (RSI) forms a lower high. This mismatch signals weakening bullish momentum and hints at a potential trend reversal to the downside
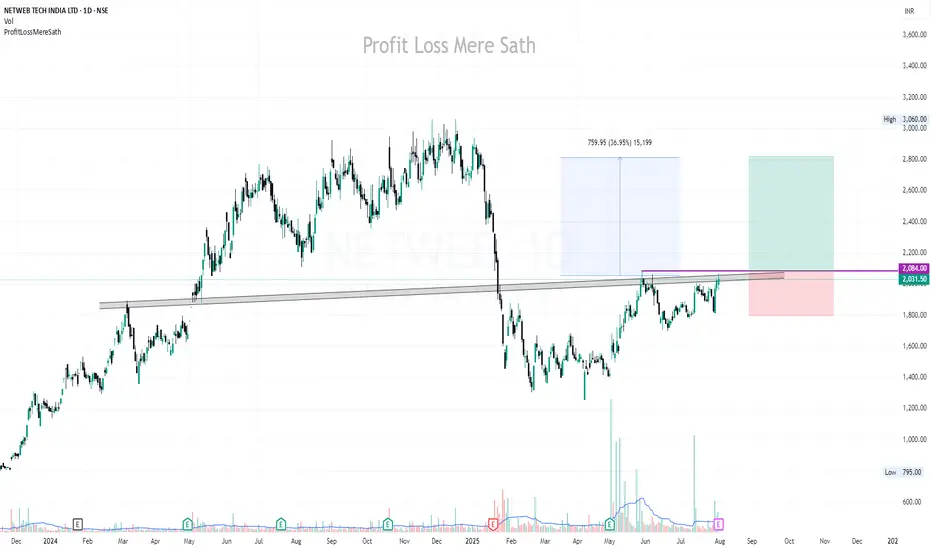
NETWEB | Buy above 2085 | Strict SL below 1800 | Target 2830Disclaimer:
This is not financial advice. Please do your own research or consult with a financial advisor before making any investment decisions. Investments in stocks can be risky and may result in loss of capital.
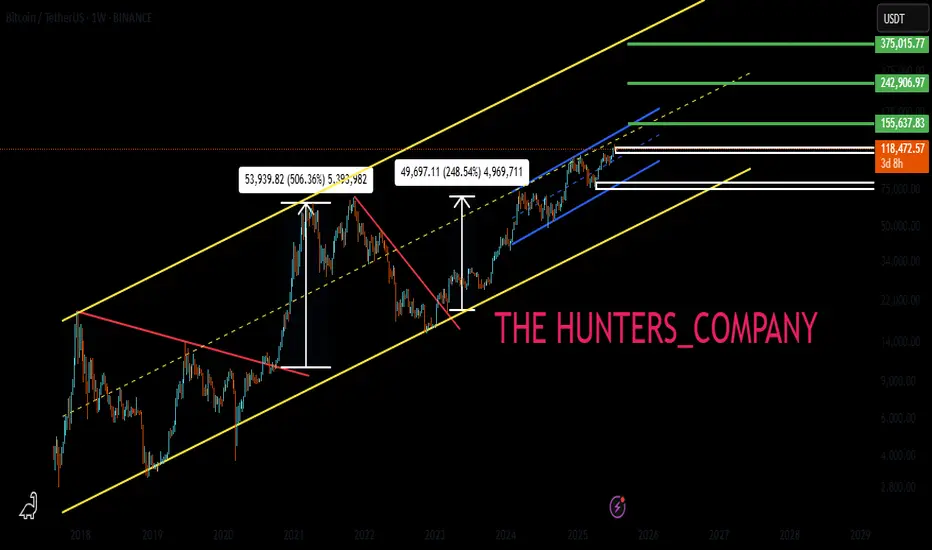
BTC : The future of Bitcoin...Hello friends🙌
👀According to the price history, the price has always been bullish and is in a long-term bullish channel.
📈Now that the price is struggling in the middle of the channel and is gathering strength for a big move, which is expected to break the middle of the channel in the form of a resistance or middle channel, the price will move to the ceiling of the channel.
⚠Don't forget risk and capital management.
🔥Follow us for more signals🔥
*Trade safely with us*
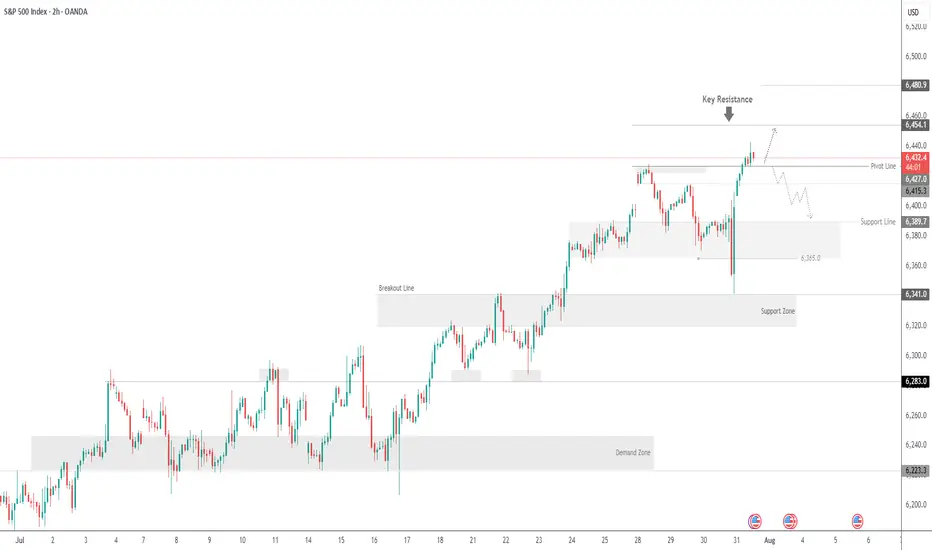
SPX500 Hits New Highs but Fed Caution Limits MomentumSPX500 Overview
Market Context:
The Fed's reluctance to commit to a rate cut in the upcoming September meeting has forced markets to reassess their outlook. This hesitation pushed Treasury yields and the US dollar higher in late trading, weighing on equities.
As it stands, the probability of a rate cut appears to be pushed further out on the timeline, introducing short-term headwinds for risk assets.
Technical Outlook:
SPX500 printed a new all-time high and maintains bullish momentum after stabilizing above the previous ATH at 6427. As long as the price holds above this level, the bullish continuation toward 6454 remains likely, with a further extension to 6480 possible.
A bearish correction would only be confirmed by a break below 6415.
Resistance Levels: 6454, 6480
Support Levels: 6415, 6389
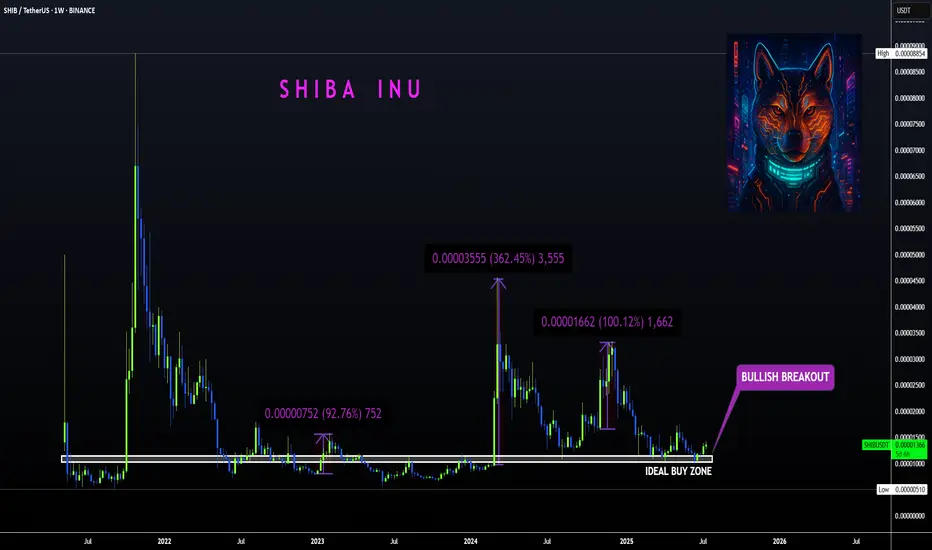
SHIBA | Bullish Breakout ABOVE Ideal Buy ZoneBINANCE:SHIBUSDT
Shiba is know to make big increases in short periods of time... that's why we love it!
The tricky thing about SHIBA is that the pumps can be unpredictable so the best way to ensure a position is to buy as low as possible to the ideal buy zone.
In the weekly timeframe, the technical indicators are not quite bullish yet. The moving averages is still above the price, meaning the bulls have yet to take full control of the price in lower timeframes.
The same can be said for the daily, although we are seeing progress as the 200d moving averages have been reclaimed:
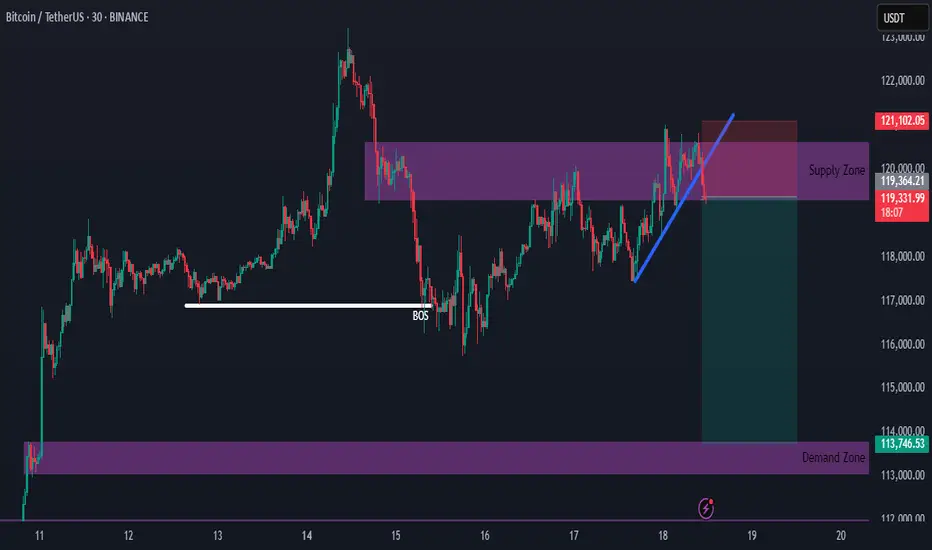
Bitcoin Supply Zone Intact — New Short Setup DevelopingHello everybody!
The supply zone we discussed in the previous idea is still holding.
We have a new opportunity to go short upon the break of the upward trendline.
The most likely target is around 114,000.
AUDCADThe price is currently at a key level. We need confirmation on the 15-minute or 5-minute timeframe before considering a long entry.
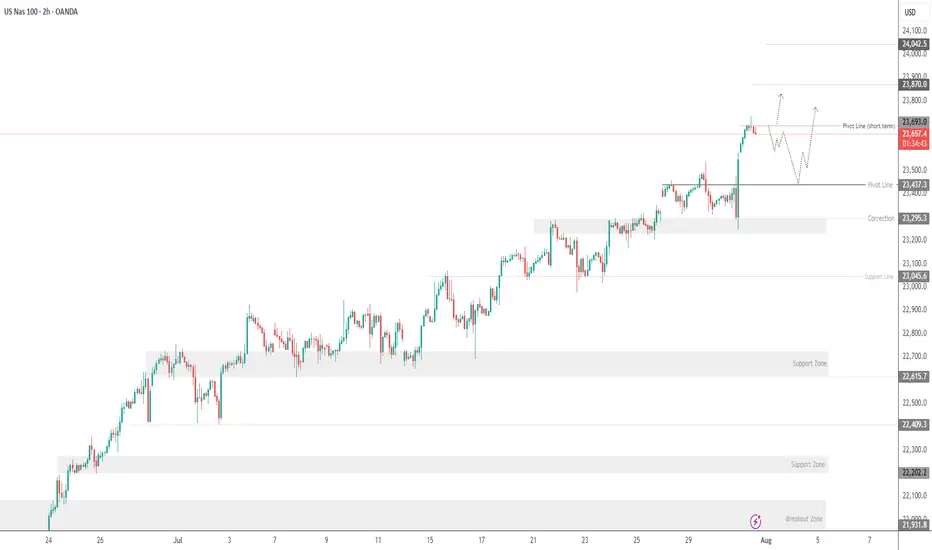
USNAS100 New ATH, looks a Correction...Wall Street Indices Hit Record Highs as AI Momentum Builds
Indices tied to the S&P 500 and Nasdaq reached fresh all-time highs on Thursday, driven by strong earnings reports from Meta and Microsoft. The results reinforced investor optimism that AI investments are delivering tangible returns and fueling future growth.
Meanwhile, Fed Chair Jerome Powell noted it's still too early to predict a rate cut in September, emphasizing that current monetary policy is not constraining economic activity. His comments followed a stronger-than-expected Q2 GDP reading, further supporting the Fed’s cautious stance.
Technical Outlook – USNAS100
After reaching recent highs, the index appears to be entering a corrective phase. A pullback toward 23470 is likely, with bullish momentum expected to resume if the price stabilizes above 23440. A sustained move above that level would target a new ATH near 23870.
However, a break below 23440 could trigger a deeper correction toward 23295.
Support: 23540 • 23440 • 23295
Resistance: 23870 • 24040
XAUUSD: BUYThere are some good trading opportunities in the market. That's when to buy. Gold prices haven't fallen further since falling back to 3390. There's no further negative news. Therefore, there won't be a significant short-term decline. Our focus will be on tomorrow's non-farm payroll data update. This is a crucial factor that can cause gold prices to rise or fall significantly in the short term.
I'll update you with real-time buy and sell opportunities. This is based on research from the Swing Trading Center. It's highly authoritative. Don't miss out! Remember to stay tuned.
XAUUSD: BUY 3292-3282 TP 3320. SL 3265

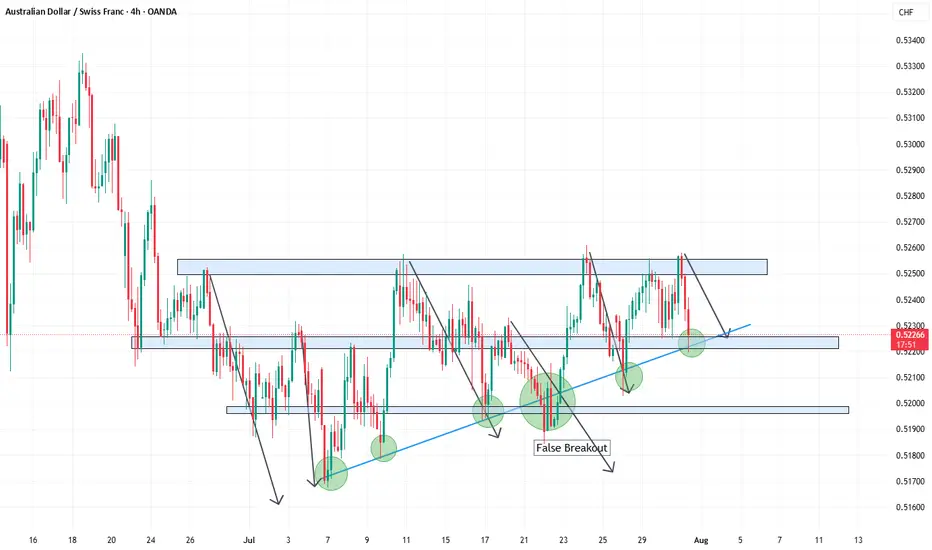
AUD/USD Rejected at Resistance-Fed on TapYesterday’s Fed-induced sell-off broke through the monthly opening-range lows / 52-week moving average with the bears now poised to mark a sixth-consecutive daily decline.
It's worth noting that weekly momentum peaked at 60 on the April advance with RSI now poised to close back below 50. The observation suggests the broader downtrend remains intact and a pivot / break below slope support could mark trend resumption.
Initial weekly support is eyed with the February high at 6408 and is backed by the 38.2% retracement of the yearly range / February high-week close (HWC) at 6354/57. A break / daily close below this region would be required to suggest that a more significant high is in place, potentially signaling a larger reversal underway. In such a scenario, the next downside objectives would be the yearly low-week close and 2023 low-close at 6291/96, followed by the 61.8% retracement and 2022 low-close at 6186–6201. Both of these zones are key areas of interest for potential downside exhaustion / price inflection IF reached.
Look for initial resistance back at the 52-week moving average (currently ~6460) with key resistance now seen back at the 61.8% retracement / yearly high-close at 6550/77. Note that the upper parallel converges on this threshold over the next few weeks and further highlights the technical significance of this zone. Ultimately a breach / weekly close above the 2021 trendline (red) would be needed to validate a breakout of the multi-year downtrend in Aussie.
Bottom line: A reversal off downtrend resistance is now approaching initial support- risk for trend resumption heading into August. From a trading standpoint, the immediate focus is on the weekly close with respect to 6400- rallies should be limited to the 52-week moving average IF Aussie is heading lower on this stretch with a close below needed to keep the immediate short-bias viable heading into the monthly cross.
Keep in mind we get the release of key US employment data tomorrow with Non-Farm Payrolls on tap. Stay nimble into the release and watch the weekly close / August opening-range for guidance for guidance.
-MB

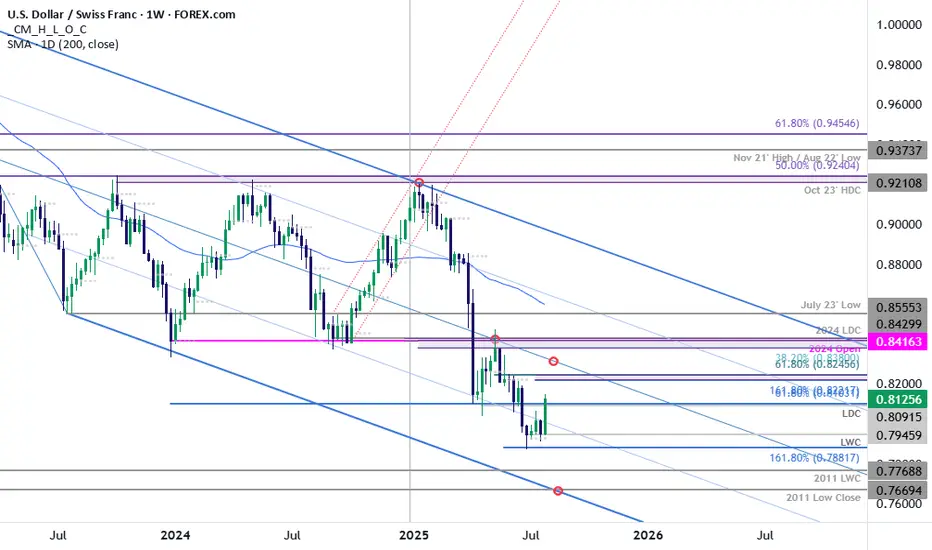
USD/CHF Rally Threatens ReversalThe July opening range broke to the topside on the heels of yesterday’s FOMC rate decision and takes USD/CHF back above the 25% parallel- a weekly close back above the April lows at 8040 tomorrow would suggest a more significant low is in place / a larger reversal is underway. Look for initial support near 8103 today for guidance.
Initial topside resistance objectives eyed at the 1.618% extension of the monthly advance and the 61.8% retracement of the May decline at 8222/46 backed by the median line, currently near the 83-handle. Key lateral resistance stands at 8380-8416- a region defined by the 38.2% retracement of the yearly range, the 2024 low-close, the 2023 low-week close (LWC) and the 2024 yearly open (an area of interest for possible topside exhaustion / price inflection IF reached).
Support rests at the yearly LWC at 7946 with a break / close below 7881 needed to mark resumption of the broader multi-year downtrend. Subsequent support objectives seen at the 2011 LWC at 7769 and the 2011 low-close at 7669.
Bottom line: USD/CHF is threatening a larger reversal within the broader downtrend. From a trading standpoint, losses would need to be limited to 8040 IF price is heading higher on this stretch with weekly close above 8103 on Friday needed to keep the immediate advance viable into the August open.
-MB
BITCOIN & 134KAfter Bitcoin rallied on July 8 and consolidated for two weeks, this bull flag remains valid, targeting $134,000.

The recent uptrend has been decisively broken, with price actionThe currency pair showed sustained bullish momentum over the past weeks, forming higher highs and higher lows. However, recent price action broke below the ascending trendline and failed to retest previous highs, indicating waning bullish strength. The break of support suggests the uptrend has been invalidated, with increasing risk of a bearish reversal or short-term correction.
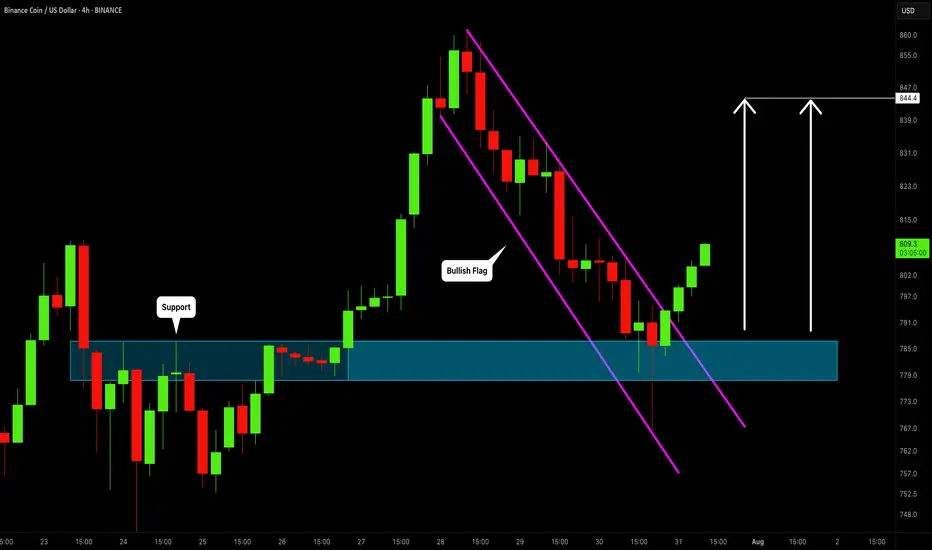
BINANCE COIN (BNBUSD): Bullish Continuation Ahead
BNB is going to resume growth after a retest of a recently broken structure.
A bullish breakout of a resistance line of a bullish flag provides a strong bullish confirmation.
I think that the price will go up to 844 level.
❤️Please, support my work with like, thank you!❤️
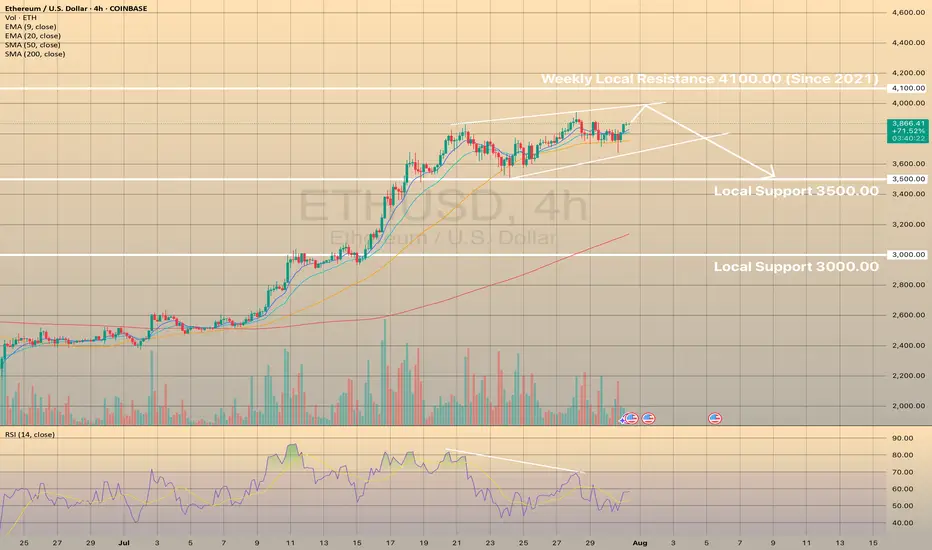
ETHUSD MAY FORM THE BEARISH WEDGE. THE PRICE IS GETTING READY TOETHUSD MAY FORM THE BEARISH WEDGE. THE PRICE IS GETTING READY TO DROP.
ETHUSD has been moving bullish since July 8. However since July 21 the price started to form the bearish wedge with bearish divergence on RSI on 4-h timeframe.
A bearish wedge is a bearish reversal pattern in an uptrend, where the price forms higher highs and higher lows within converging upward trendlines, signaling weakening bullish momentum and a potential downward reversal. To trade, identify the wedge with declining volume and confirm with RSI or divergence. Sell or short on a breakdown below the lower trendline with a volume spike. Set a stop-loss above the recent high or upper trendline. Target the wedge’s height projected downward from the breakdown or the next support level with a 1:2 risk-reward ratio.
We expect that the price will establish another bullish momentum and the price will go towards upper border of the wedge, slightly below the 4,100.00 resistance level and will decline towards 3,500.00 support level afterwards.
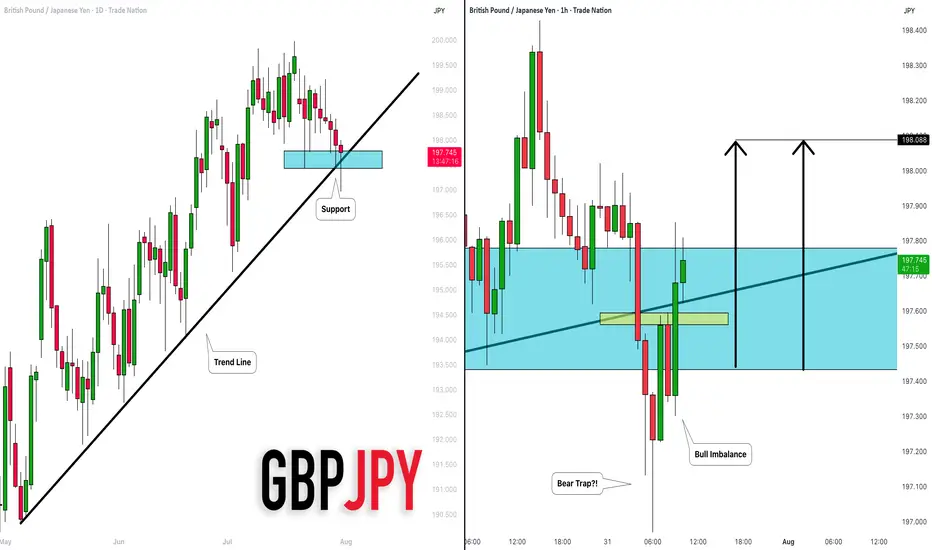
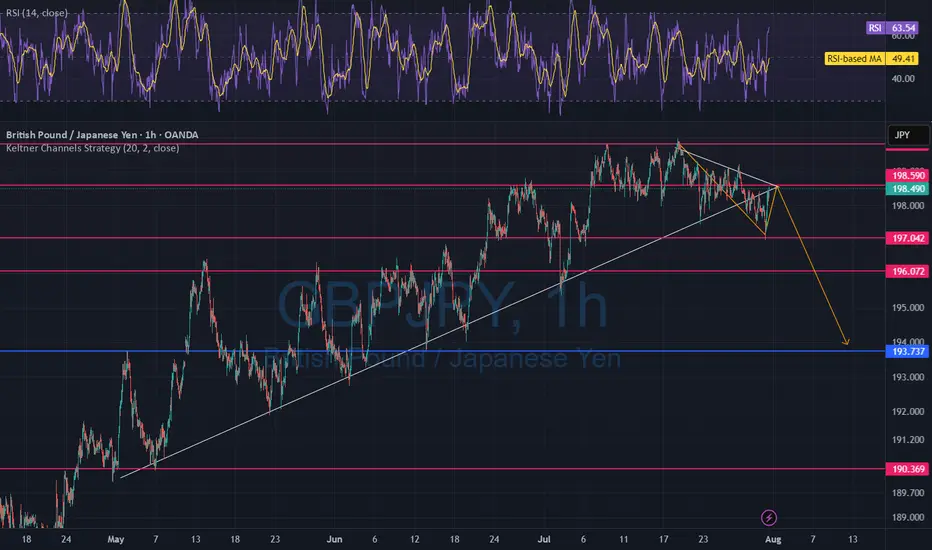
GBPJPY: Important Demand Zone 🇬🇧🇯🇵
GBPJPY is trading within an important demand zone that
is based on a rising trend line and a horizontal support.
We see a false violation of that and a bear trap, followed
by a bullish imbalance candle.
I think that the pair may go up and reach at least 198.08 level.
❤️Please, support my work with like, thank you!❤️
I am part of Trade Nation's Influencer program and receive a monthly fee for using their TradingView charts in my analysis.