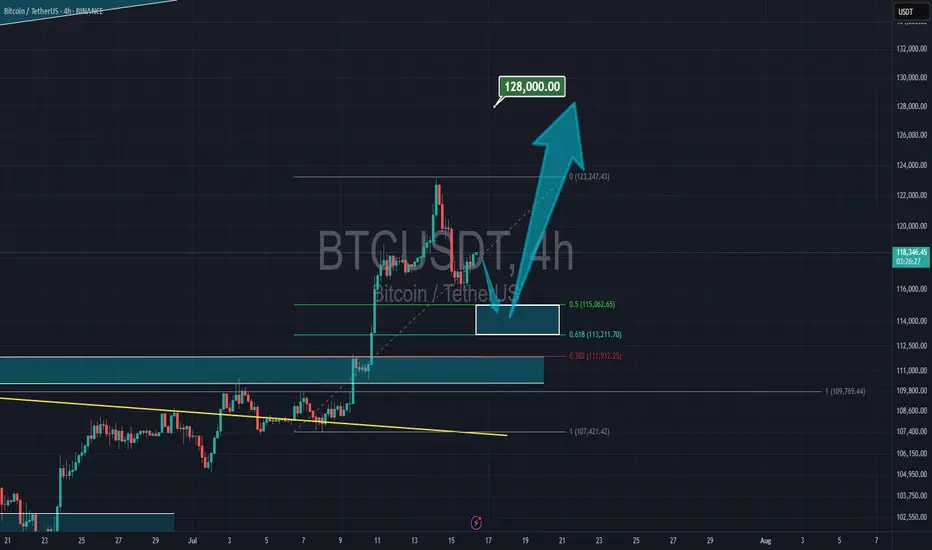
Bitcoin to 128kThere is a strong support between 113k to 115k for Bitcoin, as you see that is the 61% of the Fibonacci, and it is just the start for the rally.
Trend Lines
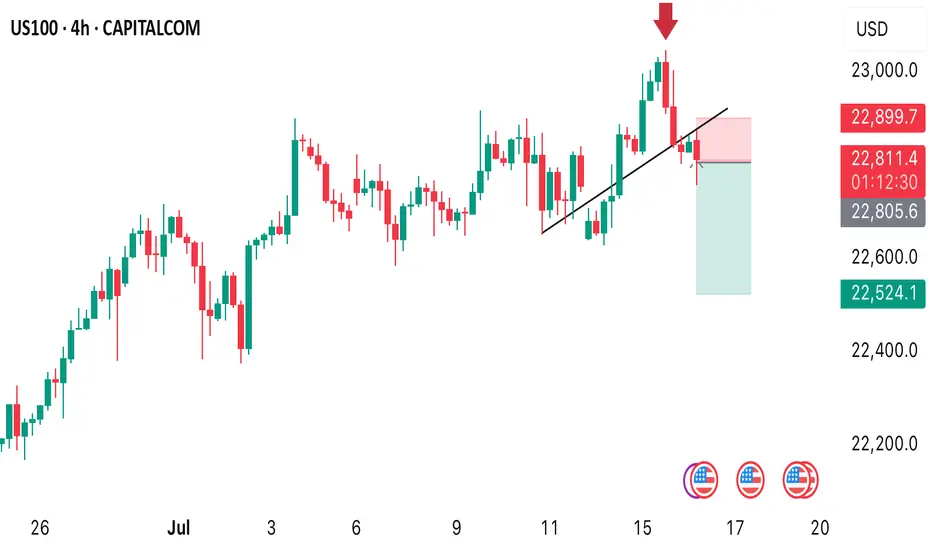
US100 SELL OPPORTUNITY A sell opportunity is envisaged as price dropped from the ALL TIME HIGH of 23000. I am shorting it with my target placed at 22524
Take advantage of this opportunity
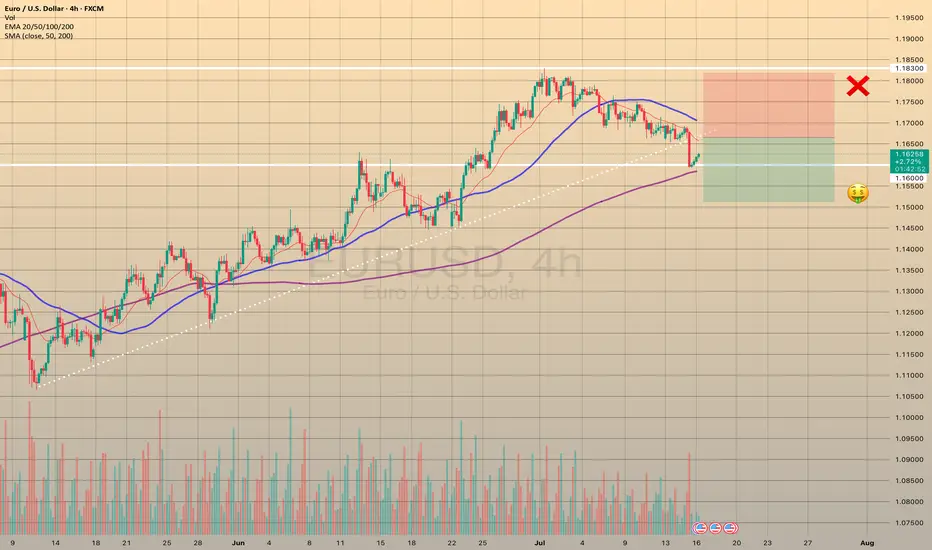
EURUSD TRIGGERED STOP LOSSTRADING IDEA UPDATE - EURUSD TRIGGERED STOP LOSS
The U.S. CPI report data came out right what the market expected (2.7% vs. 2.7% annually). After this report the pair went downwards on increased volume, triggering my stop loss and found the support only on 4-h sma200 and 1.16000 level.
What will be the possible scenario next?
I assume that the asset will go testing the trendline at 1.16650. If the test is successful, I will consider opening a
🔽 a pending sell stop order at 1.16651 with
❌a stop loss at 1.18180 and
🤑a take profit at 1.15122
Only if the retest is successful, not earlier! Let's observe first. Additionally, today is the U.S. PPI report coming out at 12:30 p.m. UTC, so got to be careful around this time
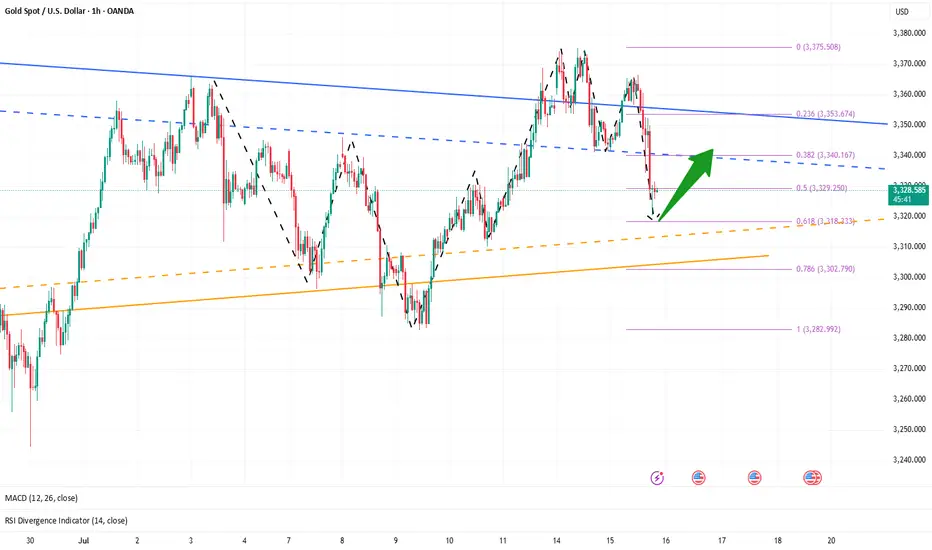
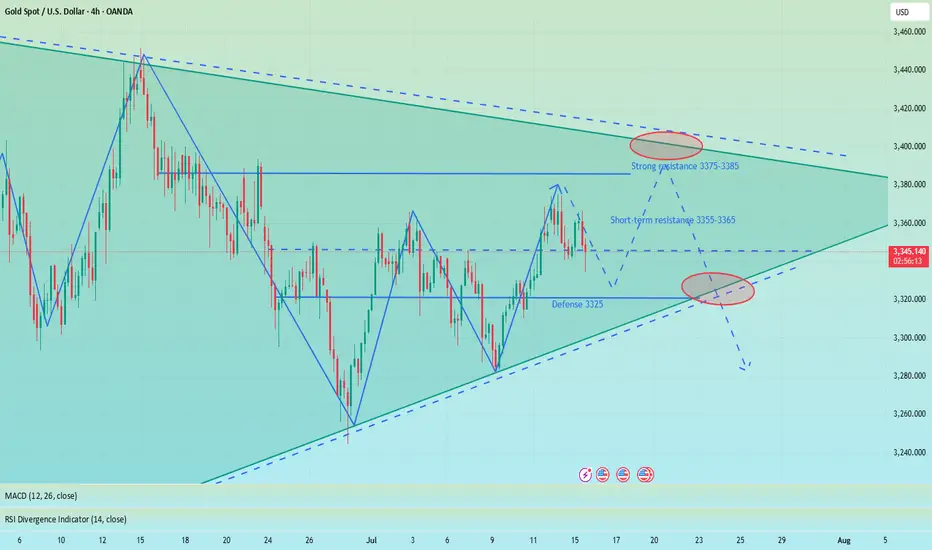
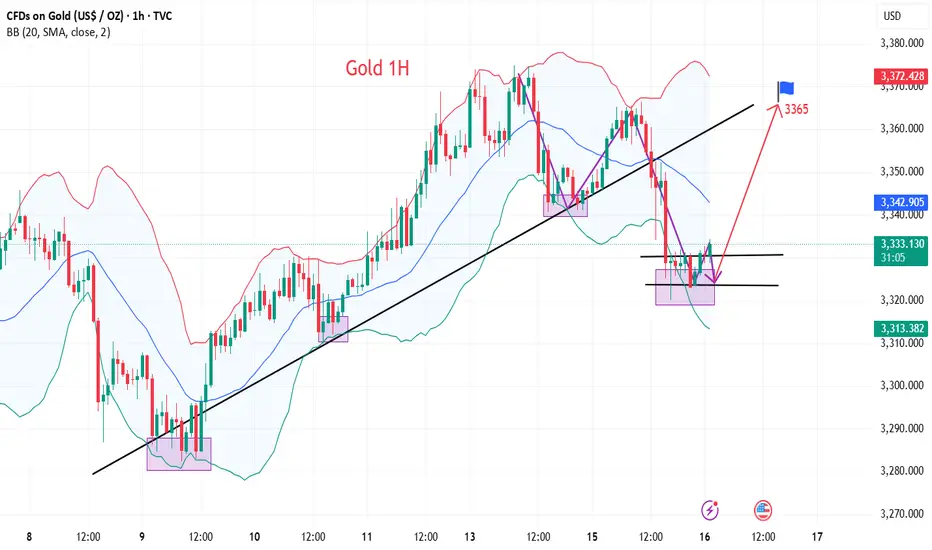
Golden Support Holds — Bulls Poised for Another Leg Higher"If gold cannot break through the 3365-3375 area, gold will fall under pressure again, or refresh the recent low of 3341, and continue to the 3335-3325 area." Gold's performance today is completely in line with my expectations. Gold just retreated to a low of around 3320, but soon recovered above 3325, proving that there is strong buying support below.
From the current gold structure, the short-term support below is mainly concentrated in the 3320-3310 area. If gold slows down its downward momentum and its volatility converges when it approaches this area, then after the gold bearish sentiment is vented, a large amount of off-site wait-and-see funds will flow into the gold market to form strong buying support, thereby helping gold regain its bullish trend again, thereby starting a retaliatory rebound, or a technical repair rebound.
Therefore, for short-term trading, I still insist on trying to go long on gold in the 3330-3320 area, first expecting gold to recover some of its lost ground and return to the 3340-3350 area.
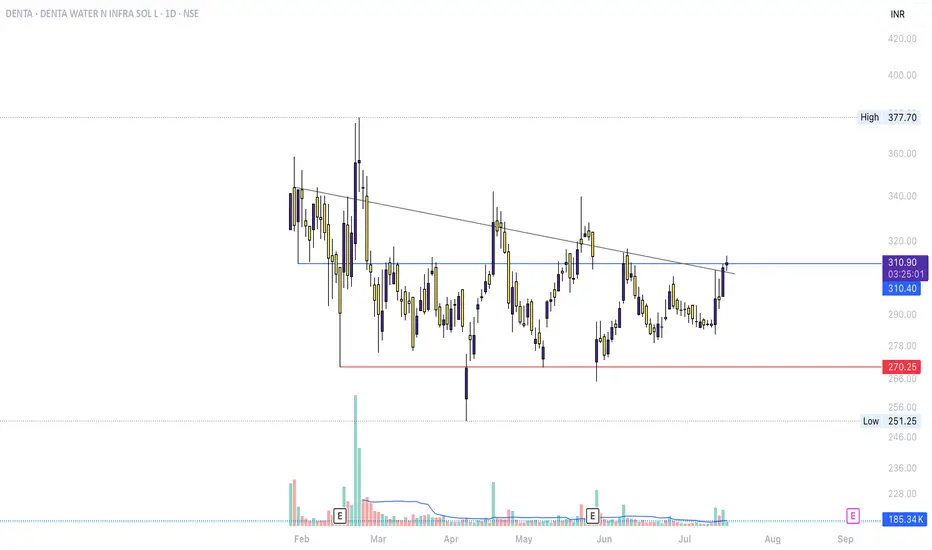
DENTA – SMC & Breakout Structure Analysis (Jul 2025)Accumulation/Distribution: Long consolidation near ₹270–₹311
Break of Structure (BOS): Trendline breakout + recent close above prior top
Neutral toward Bullish: Awaiting volume and price action confirmation to validate trend shift
1. Defined Range Structure
Support ~₹270 (red line) holding over 4+ months
Resistance ~₹311–₹315 (blue line) tested multiple times before today
2. Possible Breakout Attempt
Price has breached the descending trend line—an early mark of bullish structure shift
Close is marginally above resistance, but lacks volume confirmation for breakout validation
3. Volume & Confirmation
No substantial volume spike yet—breakouts typically require accompanying volume
Watch for multi-session closes above ₹315 with sustained volume to support continuation
4. Pullback as an Opportunity
Retracing into ₹305–₹310 could form a higher-low
Such a move would align with healthy trend behavior, offering clearer structure and stronger validation
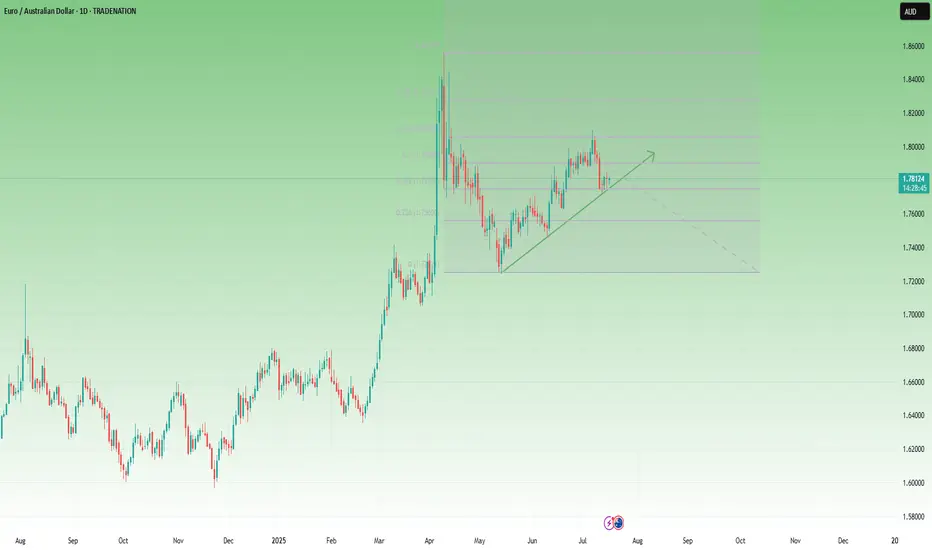
EURAUD Flag Forming Below 1.80 – Time to Sell the Rally?📈 The Big Picture
In mid-February, EURAUD exploded to the upside, gaining over 2000 pips in just two weeks. After peaking near 1.85, the pair corrected sharply, returning to more balanced levels around 1.72.
🕰️ What’s happened since?
The market has resumed its climb and just recently made a new local high at 1.81. On the surface, it looks like bulls are still in control – but a closer look reveals warning signs.
🔍 Key structure observations:
• The current rally appears to be a measured move, topping out near the 61.8% Fibonacci retracement of the previous drop
• Price structure is overlapping, suggesting weak momentum
• A large flag pattern is developing – typically bearish in this context
• The pair still trades above the ascending trendline, but a breakdown is looming
📍 Current price: 1.7805
🎯 Swing Trade Plan
From a swing trading perspective, I’m looking to sell rallies near the 1.80 zone, with:
• Negation: if the price breaks clearly above the recent high
• Target: the recent low around 1.7250 – where the last correction ended
________________________________________
📌 Conclusion:
EURAUD may have exhausted its bullish energy. The technical picture suggests we are in the late stage of the rally, with bearish patterns stacking up. Unless bulls manage a clean breakout above 1.80, this looks like a great place to position for a medium-term reversal. 🚀
Disclosure: I am part of TradeNation's Influencer program and receive a monthly fee for using their TradingView charts in my analyses and educational articles.
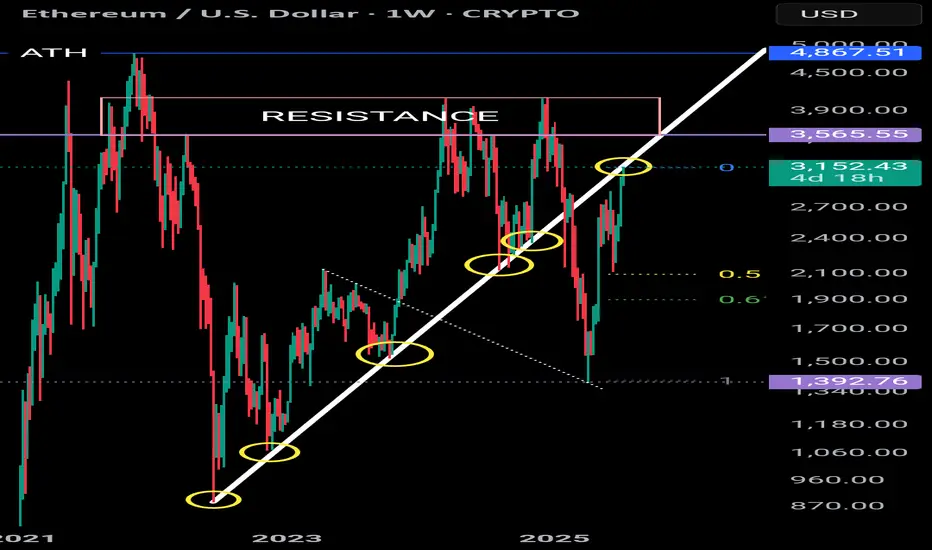
ETH - what next??Ethereum is perfectly touching a macro uptrend (5 touches acting as Support). Price has recently rallied but is currently pausing for breath. Could the uptrend begin to act as resistance? A break above this line would invalidate this thesis. Equally there is a huge resistance zone @ 3,550 - 4,100
And then there is the ATH
So there are a few hurdles in the way of printing a new ATH.
If Ethereum fails to break above the uptrend the fib retracement tool could take price to 1,900 (.618).
The next few days/weeks will give us an indication as to which direction we are headed.
Public short selling profit, NY short-term multiple layoutInterest rate futures data showed that the results were in line with our previous expectations, with a lower rate cut this month and a higher probability of a 25 basis point cut in September. In the short term, gold may first take profits and then rebound. NY session trading has just begun. Bros can pay attention to the 3335-3330 area below. If it falls back and stabilizes, you can consider participating in long positions, defending 3325 and targeting 3355-3365.
OANDA:XAUUSD
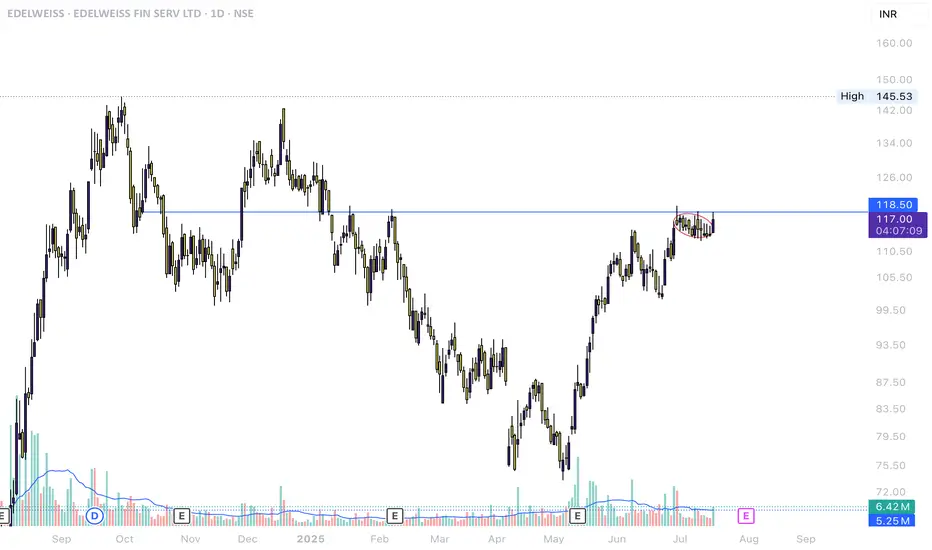
EDELWEISSAfter a strong uptrend , Price consolidated near the resistance forming a tight closing base
Price is breaking out of the range.
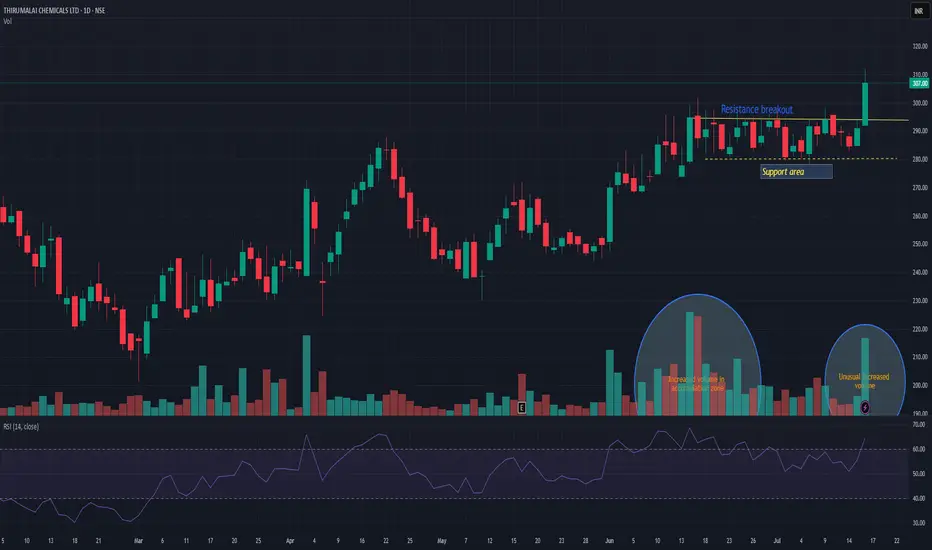
TIRUMALCHMTIRUMALCHM has given resistance breakout with decent volume. Another good thing is unusual volume increased in accumulation zone. Support can be seen near 280 levels. There is high probability that this time it may push the stock in to trend change and may take momentum to the next level. Keep it on radar.
AUDUSD InsightHello to all our subscribers!
Please feel free to share your personal thoughts in the comments. Don't forget to like and subscribe!
Key Points
- The U.S. June CPI came in at 2.7%, matching market expectations, while core CPI was 2.9%, slightly below the expected 3.0%. Overall, the figures were in line with forecasts, but the prices of essential goods rose. Companies appear to be gradually passing on the rising import costs to consumers, indicating that the effects of tariffs are starting to filter through.
- U.S. President Trump announced a trade agreement with Indonesia, under which Indonesia will pay a 19% tariff on all exports to the U.S., while U.S. exports to Indonesia will be exempt from tariffs.
- President Trump also granted a 50-day grace period on sanctions against Russia.
Major Economic Events This Week
+ July 15: U.S. June Consumer Price Index (CPI)
+ July 16: U.K. June CPI, U.S. June Producer Price Index (PPI)
+ July 17: Eurozone June CPI
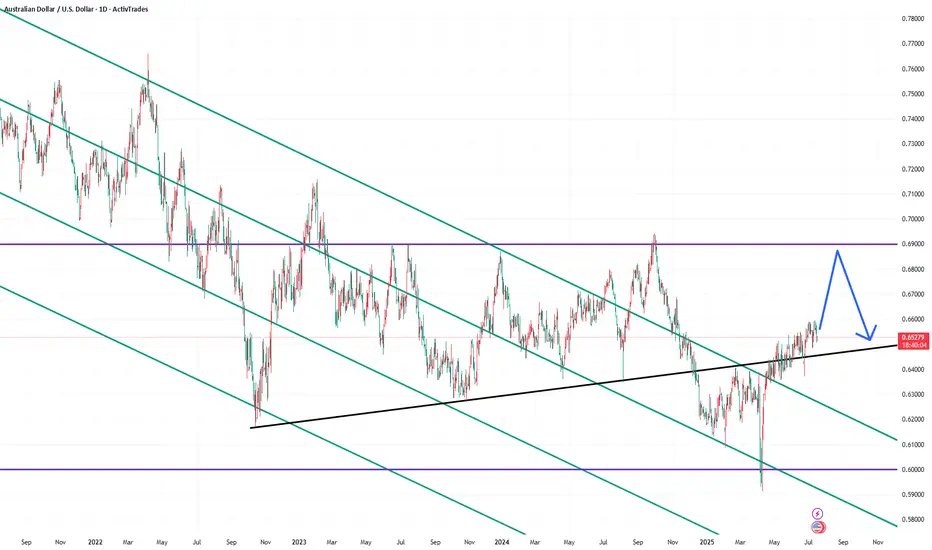
AUDUSD Chart Analysis
The pair continues a modest upward trend along the channel. As previously mentioned, a move toward the 0.69000 level is expected. However, there may be a brief pause around the 0.67000 resistance zone. This pullback is likely to be minor, and in the longer term, the 0.69000 level remains a potential target.
CPI triggers sell-off, 3330 can be short-term long📰 News information:
1. Focus on tomorrow's CPI data
2. Bowman's speech at the Federal Reserve
3. Tariff information outflows and countries' responses to tariff issues
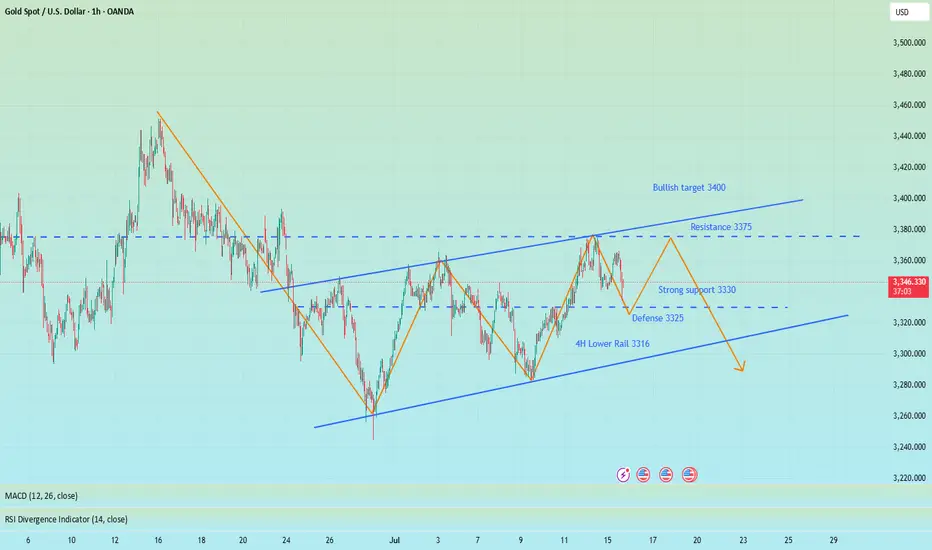
📈 Technical Analysis:
The short-term trend flag pattern has been formed, and our short-selling strategy perfectly hits the TP. According to current news, Trump has once again urged the Federal Reserve to cut interest rates. While there is almost no possibility of a rate cut this month, there is a high probability that a 25 basis point rate cut will be completed in September, which is also in line with our previous prediction of market trends.
The big negative line in 4H pierced the middle Bollinger band. Although the CPI data is bullish, it has little impact based on the announced value. Market expectations have been digested in advance, so there is no room for a big drop. The upper points still focus on the short-term resistance of 3355-3365. If it rebounds to this area first in the short term, you can consider shorting again. Focus on the strong support of 3330 below. As long as the retracement entity does not fall below 3330, gold will rise again and touch the resistance line of 3375-3385.
🎯 Trading Points:
BUY 3335-3325
TP 3355-3365
In addition to investment, life also includes poetry, distant places, and Allen. Facing the market is actually facing yourself, correcting your shortcomings, facing your mistakes, and exercising strict self-discipline. I share free trading strategies and analysis ideas every day for reference by brothers. I hope my analysis can help you.
OANDA:XAUUSD PEPPERSTONE:XAUUSD FOREXCOM:XAUUSD FX:XAUUSD TVC:GOLD FXOPEN:XAUUSD
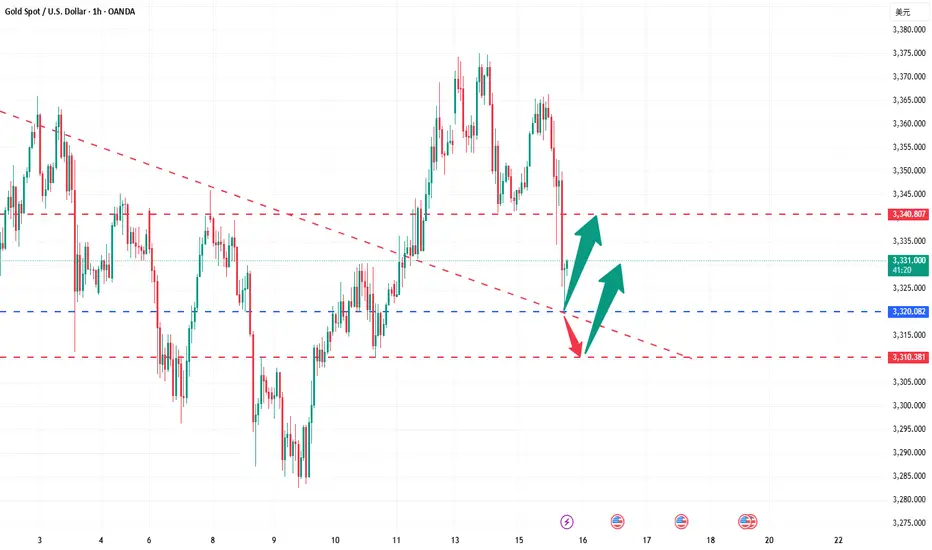
Beware of false decline and real rise of gold
💡Message Strategy
On Tuesday, the dollar index continued to rise, eventually closing at a high of 98.68, after a mild inflation report sparked speculation that the Federal Reserve might keep interest rates unchanged for the time being.
Spot gold gave up its intraday gains after the release of CPI data, once touching the $3,320 mark, falling for the second consecutive trading day.
📊Technical aspects
In the hourly chart, gold has already touched the support trend line overnight.
Therefore, at present, it may be inclined to rebound, and gold still maintains an upward trend as a whole.
However, the upper 3340-45 is a short-term suppression position. If it cannot stand firm and break through 3340-45 today, it is not ruled out that it will continue to maintain 3320-40 for consolidation.
On the contrary, as long as it can stand firm above 3345 today, then gold will really rise in the future.
It is very likely that the high point of 3375 at the beginning of this week may be refreshed.
Therefore, in terms of operation, I suggest paying more attention to 3320-30. After all, 3320 is the overnight low. As long as it is not broken again, the probability of gold rising is very high.
However, if it falls below 3320 again today, it is not ruled out that it will continue to refresh the low.
💰Strategy Package
Long Position:3320-3330,SL:3305,Target: 3365
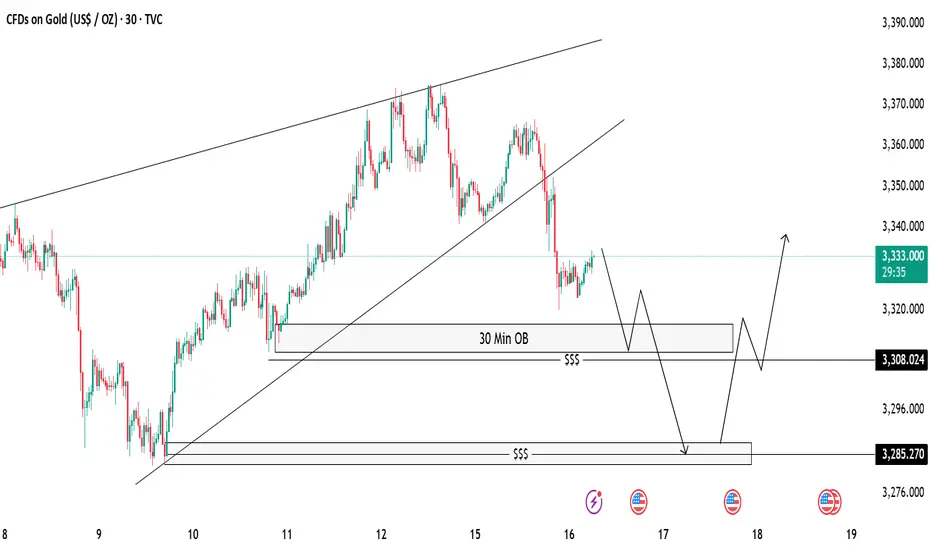
Gold 30-Min OB Analysis – Bounce or Drop..?Gold is showing a break of structure after a big sell-off 🔻. We have marked a 30-Minute Order Block (OB) 📍 which can act as a possible reaction zone.
📌 Two Scenarios We Are Watching:
✅ Scenario 1 (Bullish):
If price taps into the 30M OB and shows bullish rejection 🟢, we can look for buy opportunities, targeting the previous highs near 3335-3340 🎯.
❌ Scenario 2 (Bearish):
If price fails to hold the OB, we will watch for a liquidity sweep (marked with $$$) and expect price to move lower towards the next demand zone near 3285 📉.
⚠️ Key Notes:
Always wait for confirmation before entry.
Patience is the key 🧘♂️ — let the market come to us.
How to find stable trading opportunities in gold fluctuations?Today, the rhythm of gold going short first and then long is perfectly grasped. Congratulations to those who followed the trading plan for reaping good returns. We are still holding long orders at present, and the overall position is arranged around the idea of stepping back to low and long. From the current market structure, the 3325-3320 area below is an important dividing line for the bulls to be strong, and it is also a key support level that determines the subsequent direction. If this area stabilizes, the short-term structure will still be bullish and unchanged, and the rhythm of stepping back to low and long is expected to continue. It is expected that gold will rebound to 3340-3350 and the upper target again. If 3320 is lost, it is recommended to stop loss as soon as possible, and the defense position is recommended to be set below 3315 to prevent the short-term structure from turning short and bringing further callback risks. The core of this round of trend is that only by holding the support can we be qualified to talk about rebound; if the support is lost, we need to turn decisively to prevent being passive. The current market volatility has intensified, but the direction has not yet completely broken. The focus of operation is still on entering the market around key points, switching positions between long and short positions to find the rhythm, blindly chasing orders and emotional operations will be taboos in the current market. Opportunities are not absent, but they belong to those who are always ready. The structure is not broken and the low and long will not change.
popcat long post trade📓 Trade Follow-Up — July 16 (Entry from Previous Session)
Timeframe:
Trading window is 10:00 p.m. to 12:00 a.m. (Vietnam time).
This session, I was on the charts for less than one hour.
⚙️ Trade Setup:
Trade idea was built during the New York open.
I didn’t execute the trade in real time because I hesitated.
Price moved without me, but I left a limit order at my pre-marked zone and went to sleep.
No chasing, no new setups added after market moved.
📈 Morning Outcome:
Woke up before 5:30 a.m.
The market had returned to the entry, nearly hit the stop loss, then turned.
I was in approximately +1% unrealized profit.
🧠 Morning Decision:
I had no pre-planned rule for what to do if I woke up and the trade was active.
Market was in Sydney session with about 90 minutes left in the trading day.
Tokyo session was approaching (~1 hour and 20 mins away).
I made a quick decision to close the trade:
Reason: setup originated during New York, no longer active session context.
I didn't want to micromanage outside my committed trading window.
During the short moment it took to decide, price pulled back slightly—final profit was just under 1%.
🧩 Notes:
I need to define pre-market and post-market rules:
What to do if a trade is active when I wake up?
Under what conditions do I manage or exit a trade outside my session?
Reaction was clean, no over-involvement or chasing.
Emotionally stable, but acknowledged mild excitement and urgency when waking up to a live position.

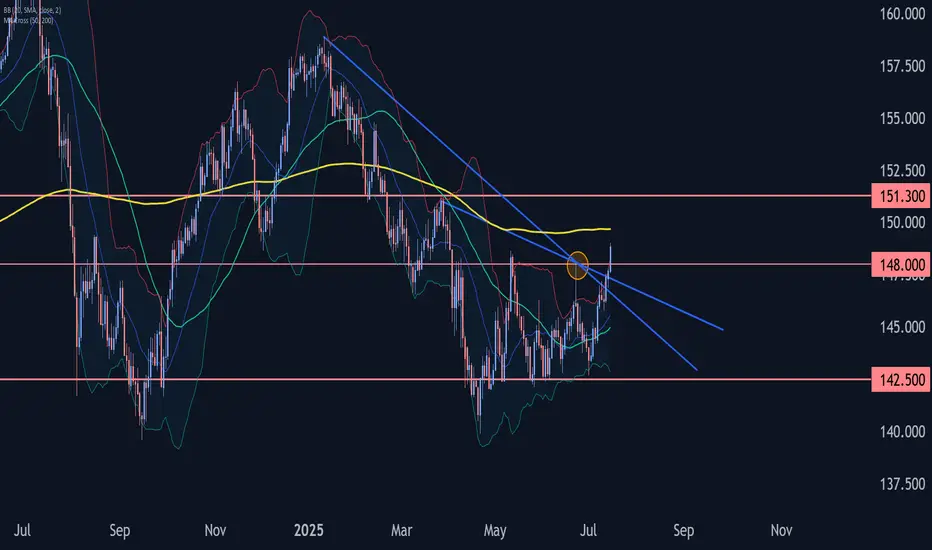
USDJPY Wave Analysis – 15 July 2025
- USDJPY broke the resistance area
- Likely to rise to resistance level 151.30
USDJPY currency pair recently broke the resistance area located at the intersection of the resistance level 148.00 and the two resistance trendlines from January and March.
The breakout of this resistance area should strengthen the bullish pressure on his currency pair.
Given the continuation of the widespread yen sales seen recently across FX markets, USDJPY currency pair index can be expected to rise to the next resistance level 151.30 (monthly high from March).
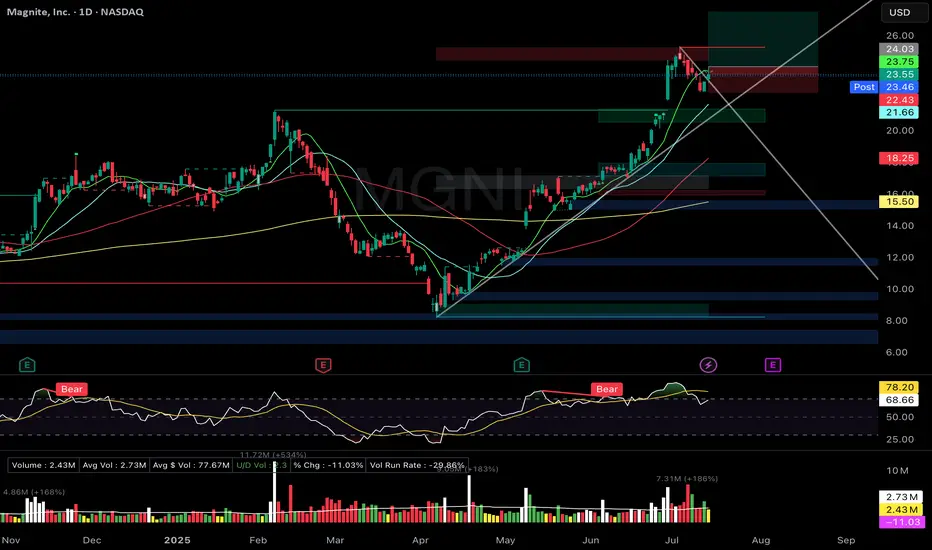
MGNI Zanger-style Bull Flag Breakout PullbackMagnite Inc. (MGNI)
🚀 Entry: $24.03
📊 Setup: Zanger-style Bull Flag Breakout Pullback
🛑 Stop: $22.43
🎯 Target: $27.50
🔑 Why I Entered:
Picture-perfect bull-flag pullback pattern with volume drying significantly, tapping precisely on the rising trendline.
Price action holding strong above rising short-term EMAs (9/21).
Excellent relative strength, reflecting a previous strong-volume breakout move.
🎯 What's Next:
Seeking strong volume surge confirmation to confirm continuation of the breakout.
Earnings report in three weeks—ready to take partial profits if price significantly appreciates ahead of the event.
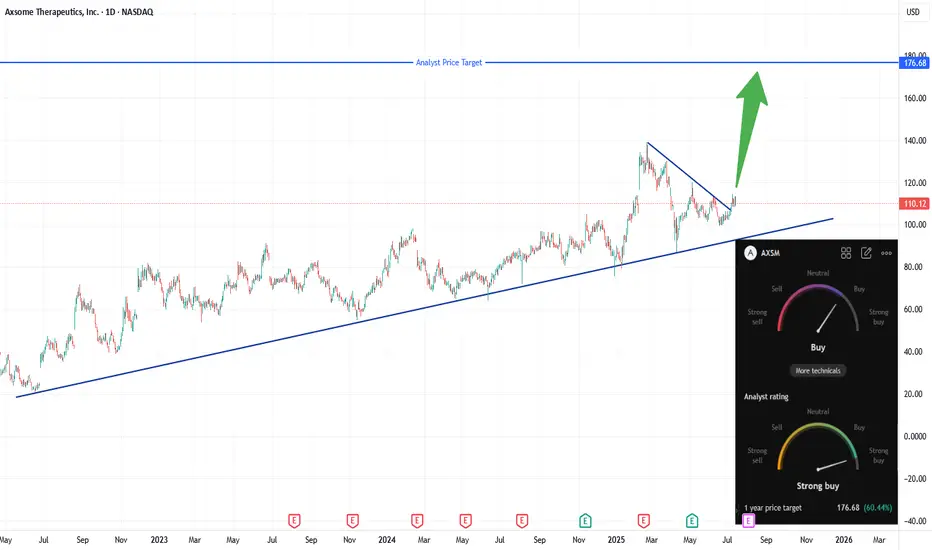
Axsome Therapeutics (AXSM) Breaks Out — Targeting Analyst Price Axsome Therapeutics (AXSM) has just broken out of a multi-month descending trendline, signaling renewed bullish momentum. I will buy at the open, targeting the analyst price target of $176.68 for a potential strong upside move. My stop will be set just below the prior resistance line (~$110), which should now act as support. This setup offers a favorable risk/reward, with the trendline breakout confirming renewed interest and upside potential.
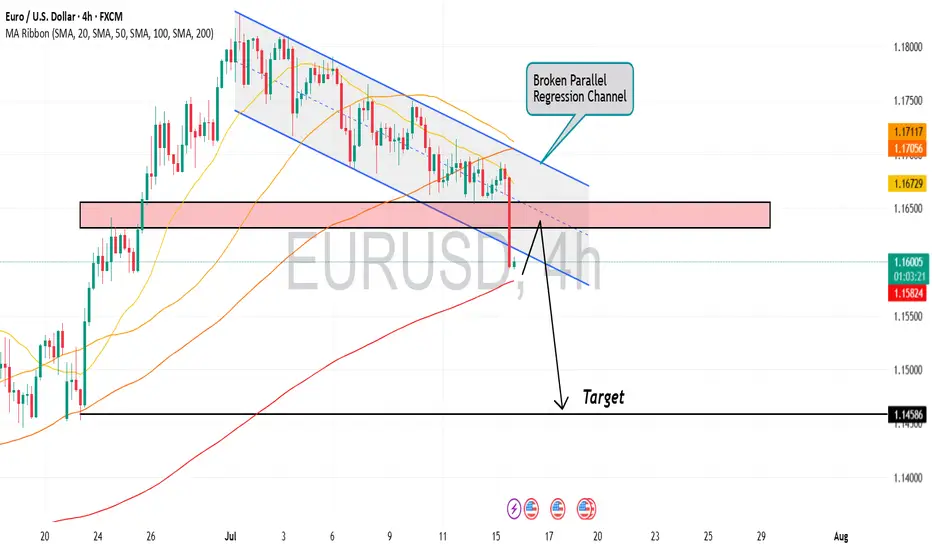
EURUSD is Bearish After Breaking Regression ChannelHello Traders
In This Chart EURUSD HOURLY Forex Forecast By FOREX PLANET
today EURUSD analysis 👆
🟢This Chart includes_ (EURUSD market update)
🟢What is The Next Opportunity on EURUSD Market
🟢how to Enter to the Valid Entry With Assurance Profit
This CHART is For Trader's that Want to Improve Their Technical Analysis Skills and Their Trading By Understanding How To Analyze The Market Using Multiple Timeframes and Understanding The Bigger Picture on the Charts
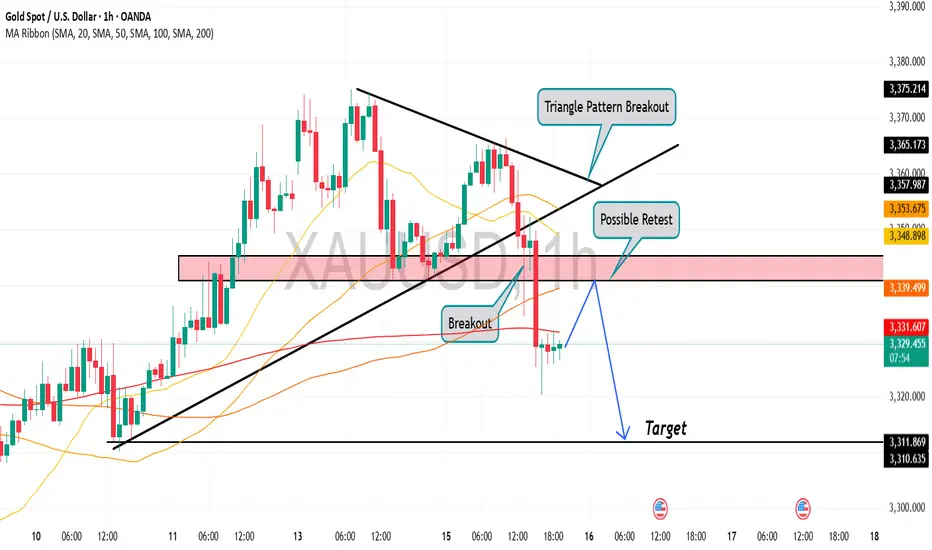
Gold is in the Bearish Direction after Breaking Triangle PatternHello Traders
In This Chart GOLD HOURLY Forex Forecast By FOREX PLANET
today Gold analysis 👆
🟢This Chart includes_ (GOLD market update)
🟢What is The Next Opportunity on GOLD Market
🟢how to Enter to the Valid Entry With Assurance Profit
This CHART is For Trader's that Want to Improve Their Technical Analysis Skills and Their Trading By Understanding How To Analyze The Market Using Multiple Timeframes and Understanding The Bigger Picture on the Charts
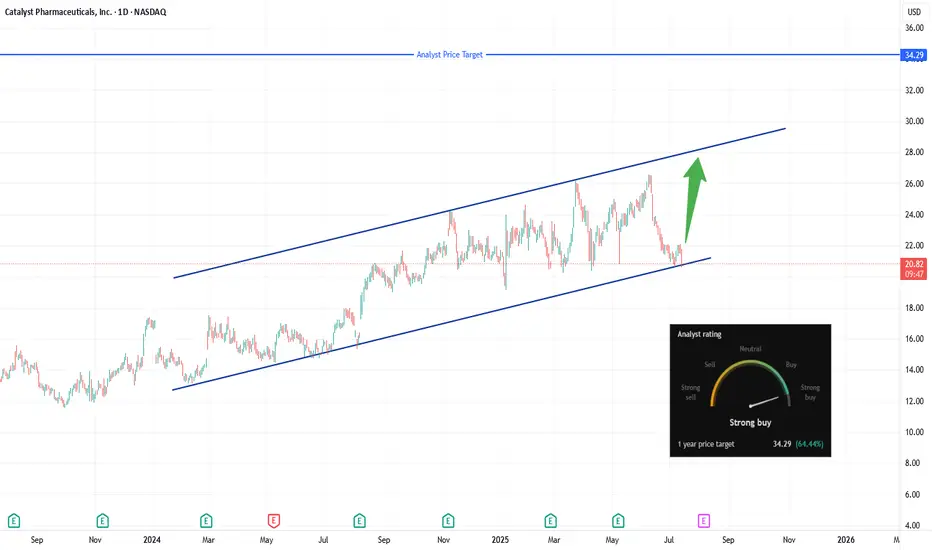
CPRX breakout watch: Eyes on $22.10, channel support intactCatalyst Pharmaceuticals (NASDAQ: CPRX) remains poised at the lower trendline of a well-defined ascending channel, trading in the $20.60–$21.00 area. The setup to monitor now is a daily close above $22.10, which would signal a real breakout through the $21.82–$22.11 resistance zone. A decisive push above that level opens the door for a test of the channel’s upper boundary near $27–$28.
💡 Trade Plan:
Trigger: Go long on a confirmed daily close above $22.10
Targets:
First: Mid-channel resistance around $24.50
Stretch: Upper-channel target of $27–$28
Stop‑Loss: Place below the channel base, ideally under $20.50 to manage risk
Why It Works:
Clear structure: Ascending channel with multiple supports provides clarity on entries and exits .
Momentum catalyst: Breaching the $21.8–$22.1 zone suggests fresh upside momentum.
Reward setup: A small stop near channel support offers a favorable risk/reward targeting channel top.
TL;DR:
Watching for a breakout above $22.10—that’s your entry trigger. Aim for $24.50, then $27–$28, with a stop under $20.50 if support fails.
Raising the bar for SpotifySpotify has been my favorite stock so far this year. Primarily because resilience in uncertain economies. Subscription-based services, especially freemium models, are seen as defensive. Spotify is the number one music streaming service in the world and unless that changes people will keep using it every single day in their lives.
They will generate revenues based on advertisements and subscriptions which are in my opinion reasonable and conducive of a strong business model. I am raising my price target to $985. This is not unreasonable considering the intrinsic value of the stock is between $400 and $2900. I am confident Spotify will find ways to stay ahead of its competitors and dominate the music streaming industry. While keeping its customers happy and loyal.
